Demographics of Sweden
The total resident population of Sweden was 10,343,403 in March 2020.[1] The population exceeded 10 million for the first time on Friday 20 January 2017.[2][3] The three largest cities are Stockholm, Gothenburg and Malmö. Sweden's population has become much more ethnically, religiously and linguistically diverse over the past 70 years as a result of global immigration. Every fourth (24.9%) resident in the country has immigrant background and every third (32.3%) has at least one parent born abroad.[4]
.jpg)
Population statistics
people/km²
Demographic statistics according to the World Population Review.[5]
- One birth every 4 minutes
- One death every 6 minutes
- Net gain of one person every 8 minutes
- One net migrant every 14 minutes
Demographic statistics according to the CIA World Factbook, unless otherwise indicated.[6]
- Population
- 10,040,995 (July 2018 est.)
- Age structure
- 0-14 years: 17.54% (male 904,957 /female 855,946)
- 15-24 years: 11.06% (male 573,595 /female 537,358)
- 25-54 years: 39.37% (male 2,005,422 /female 1,947,245)
- 55-64 years: 11.67% (male 588,314 /female 583,002)
- 65 years and over: 20.37% (male 946,170 /female 1,098,986) (2018 est.)
- 0-14 years: 17.43% (male 892,462/female 843,375)
- 15-24 years: 11.31% (male 581,025/female 545,971)
- 25-54 years: 39.42% (male 1,993,590/female 1,933,080)
- 55-64 years: 11.58% (male 578,942/female 574,479)
- 65 years and over: 20.26% (male 931,593/female 1,085,970) (2017 est.)
- Median age
- total: 41.1 years. Country comparison to the world: 45th
- male: 40.1 years
- female: 42.2 years (2018 est.)
- total: 41.2 years
- male: 40.2 years
- female: 42.2 years (2017 est.)
- Birth rate
- 12.1 births/1,000 population (2018 est.) Country comparison to the world: 164th
- 11.78 births/1,000 population (2013 est.)
- Death rate
- 9.4 deaths/1,000 population (2017 est.) Country comparison to the world: 52nd
- 9.37 deaths/1,000 population (2013 est.)
- Total fertility rate
- 1.87 children born/woman (2018 est.) Country comparison to the world: 141st
- Net migration rate
- 5.3 migrant(s)/1,000 population (2017 est.) Country comparison to the world: 23rd
- 6.75 migrant(s)/1,000 population (2013 est.)
- Population growth rate
- 0.8% (2018 est.) Country comparison to the world: 129th
- 0.81% (2017 est.)
- 0.93% (2013 est.)
- Mother's mean age at first birth
- 29.1 years (2015 est.)
- Life expectancy at birth
- total population: 82.1 years Country comparison to the world: 16th
- male: 80.2 years
- female: 84.2 years (2017 est.)
- Net birth surplus rate
- 2.40 births/1,000 population (2013 est.)
- Infant mortality rate
- total: 2.6 deaths/1,000 live births Country comparison to the world: 218th
- male: 2.9 deaths/1,000 live births
- female: 2.3 deaths/1,000 live births (2017 est.)
- 2.75 deaths/1,000 live births (2010 est.)
- Dependency ratios
- total dependency ratio: 58.5
- youth dependency ratio: 27.4
- elderly dependency ratio: 31.1
- potential support ratio: 3.2 (2015 est.)
- Unemployment, youth ages 15–24
- total: 17.9%. Country comparison to the world: 72nd
- male: 18.8%
- female: 17% (2017 est.)
- School life expectancy (primary to tertiary education)
- total: 19 years
- male: 18 years
- female: 20 years (2016)
- Urbanisation
- 85% of total population (2010 est.)
- Rate of urbanisation: 0.6% annual rate of change (2010–15 est.)
Current vital statistics
Number of births :
- from January-April 2019 =

- from January-April 2020 =
Number of deaths :
- from January-April 2019 =

- from January-April 2020 =

Natural increase :
- from January-April 2019 =
- from January-April 2020 =
Population change
The demography of Sweden is monitored by Statistics Sweden (SCB).
The 2005 Swedish census showed an increase of 475,322 compared to the 1990 census, an average increase of 31,680 annually. During the 1990s, birth rate increased by more than 100,000 children per year while death rates fell and immigration surged. In the early 2000s, birth rate declined as immigration increased further, with the context of unrest in the Middle East, upholding steady population growth.[8][9]
| Historical populations | ||
|---|---|---|
| Year | Pop. | ±% |
| 1570 | 900,000 | — |
| 1650 | 1,225,000 | +36.1% |
| 1700 | 1,485,000 | +21.2% |
| 1750 | 1,780,700 | +19.9% |
| 1800 | 2,347,300 | +31.8% |
| 1850 | 3,482,500 | +48.4% |
| 1900 | 5,136,400 | +47.5% |
| 1950 | 7,041,900 | +37.1% |
| 1970 | 8,081,300 | +14.8% |
| 1980 | 8,318,000 | +2.9% |
| 1990 | 8,590,600 | +3.3% |
| 2000 | 8,882,800 | +3.4% |
| 2010 | 9,415,600 | +6.0% |
| 2019 | 10,327,600 | +9.7% |
| Source: Historical figures – Sveriges land och folk,[10] Modern figures – Statistics Sweden As of:[11] Dec. 2019[1] | ||
Population projections

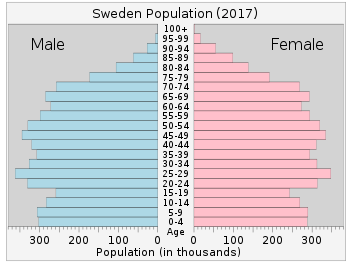
In 1950 Sweden had fewer people aged 10–20 with more people ages 20–30 and 0–10. In 2017 the ratio of male to female remains steady at about 50–50. As a whole, the graph broadens with people appearing to live longer. In 2050 it is predicted that all ages will increase from below 300,000 males and females to above 300,000 males and females. With about 50,000 people living to the ages of 90–100. In 2100 the graph is shaped as a rectangle with people of all ages and genders remaining steady. It narrows slightly at the top of the graph with about 250,000/300,000 males and females living to be 90–100 years old.[12] Statistics Sweden projects the following population development in Sweden:[13]
| Year | Projection |
|---|---|
| 2016 | 9,995,000 |
| 2020 | 10,431,000 |
| 2026 | 11,046,000 |
| 2030 | 11,344,000 |
| 2040 | 11,898,000 |
| 2050 | 12,395,000 |
| 2060 | 12,858,000 |
Eurostat projects a population in Sweden reaching 11,994,364 people in 2040 and 14,388,478 in 2080.[14]
Geography and population density
The population density is 22.5 people per km² (58.2 per square mile) and it is substantially higher in the south than in the north. About 85% of the population live in urban areas.[15] The capital city Stockholm has a municipal population of about 950,000 (with 1.5 million in the urban area and 2.3 million in the metropolitan area). The second- and third-largest cities are Gothenburg and Malmö. Greater Gothenburg counts just over a million inhabitants and the same goes for the western part of Scania, along the Öresund. The Öresund Region, the Danish-Swedish cross-border region around the Öresund that Malmö is part of, has a population of 4 million. Outside of major cities, areas with notably higher population density include the agricultural part of Östergötland, the western coast, the area around Lake Mälaren and the agricultural area around Uppsala.
Norrland, which covers approximately 60% of the Swedish territory, has a very low population density (below 5 people per square kilometer). The mountains and most of the remote coastal areas are almost unpopulated. Low population density exists also in large parts of western Svealand, as well as southern and central Småland. An area known as Finnveden, which is located in the south-west of Småland, and mainly below the 57th parallel, can also be considered as almost empty of people.
Ethnicity
The majority of the population are ethnic Swedes, or people who can trace their ethnicity to Swedish stock going back at least 12 generations. The Sweden Finns are a large ethnic minority comprising approximately 50,000 along the Swedish-Finnish border, and 450,000 first and second-generation immigrated ethnic Finns, mainly living in the Mälaren Valley region. Meänkieli Finnish has official status in parts of northern Sweden near the Finnish border. In addition, Sweden's indigenous population groups include the Sami people, who have a history of practicing hunting and gathering and gradually adopting a largely semi-nomadic reindeer herding lifestyle. They has been present in Fenno-Scandinavia from at earliest 5000 years [16] to at latest around 2650 years [17]. Today, the Sami language holds the status of official minority language in four municipalities in the Norrbotten county.
In addition to the Sami, Tornedalers, and Sweden Finns, Jewish and Roma people have national minority status in Sweden.[18]
There are no official statistics on ethnicity, but according to Statistics Sweden, around 3,311,312 (32.3%) inhabitants of Sweden were of a foreign background in 2018, defined as being born abroad or born in Sweden with at least one parent born abroad.[19] The most common countries of origin were Syria (1.82%), Finland (1.45%), Iraq (1.41%), Poland (0.91%), Iran (0.76%) and Somalia (0.67%).[20] Sweden subsequently has one of the oldest populations in the world, with the average age of 41.1 years.[21]
Historical fertility rates from 1630 to 1900
The total fertility rate is the number of children born per woman. It is based on fairly good data for the entire period. Sources: Our World In Data and Gapminder Foundation.[22]
| Years | 1630 | 1632 | 1634 | 1636 | 1638 | 1640 | 1642 | 1644 | 1646 | 1648 | 1650 | 1652 | 1654 | 1656 | 1658[22] |
|---|---|---|---|---|---|---|---|---|---|---|---|---|---|---|---|
| Total Fertility Rate in Sweden | 4.81 | 4.25 | 3.89 | 4.38 | 4.4 | 4.92 | 4.38 | 4.25 | 4.95 | 5.4 | 4.34 | 4.54 | 5.33 | 4.72 | 4.58 |
| Years | 1660 | 1662 | 1664 | 1666 | 1668 | 1670 | 1672 | 1674 | 1676 | 1678 | 1680 | 1682 | 1684 | 1686 | 1688[22] |
|---|---|---|---|---|---|---|---|---|---|---|---|---|---|---|---|
| Total Fertility Rate in Sweden | 4.2 | 4.54 | 5.01 | 4.98 | 4.6 | 5.13 | 5.01 | 4.38 | 4.28 | 4.35 | 4.64 | 5.4 | 5.25 | 4.84 | 5.29 |
| Years | 1690 | 1692 | 1694 | 1696 | 1698 | 1700 | 1702 | 1704 | 1706 | 1708 | 1710 | 1712 | 1714 | 1716 | 1718[22] |
|---|---|---|---|---|---|---|---|---|---|---|---|---|---|---|---|
| Total Fertility Rate in Sweden | 4.99 | 5.11 | 4.98 | 5.33 | 5.11 | 5.56 | 5.81 | 5.52 | 5.16 | 5.32 | 4.3 | 5.63 | 5.81 | 4.92 | 5.13 |
| Years | 1720 | 1722 | 1724 | 1726 | 1728 | 1730 | 1732 | 1734 | 1736 | 1738 | 1740 | 1742 | 1744 | 1746 | 1748[22] |
|---|---|---|---|---|---|---|---|---|---|---|---|---|---|---|---|
| Total Fertility Rate in Sweden | 4.62 | 5.09 | 5.02 | 4.75 | 4.23 | 4.77 | 4.86 | 4.77 | 4.51 | 4.96 | 4.52 | 4.35 | 5.02 | 4.85 | 4.86 |
| Years | 1750 | 1752 | 1754 | 1756 | 1758 | 1760 | 1762 | 1764 | 1766 | 1768 | 1770 | 1772 | 1774 | 1776 | 1778[22] |
|---|---|---|---|---|---|---|---|---|---|---|---|---|---|---|---|
| Total Fertility Rate in Sweden | 5.09 | 5.29 | 5.4 | 5.23 | 4.68 | 5.06 | 4.98 | 4.92 | 4.79 | 4.77 | 4.68 | 4.1 | 4.89 | 4.67 | 4.94 |
| Years | 1780 | 1782 | 1784 | 1786 | 1788 | 1790 | 1792 | 1794 | 1796 | 1798 | 1800[22] |
|---|---|---|---|---|---|---|---|---|---|---|---|
| Total Fertility Rate in Sweden | 5.06 | 4.54 | 4.47 | 4.67 | 4.81 | 4.33 | 5.19 | 4.79 | 4.92 | 4.79 | 4.07 |
| Years | 1801 | 1802 | 1803 | 1804 | 1805 | 1806 | 1807 | 1808 | 1809 | 1810[22] |
|---|---|---|---|---|---|---|---|---|---|---|
| Total Fertility Rate in Sweden | 4.26 | 4.5 | 4.45 | 4.52 | 4.5 | 4.36 | 4.42 | 4.31 | 3.78 | 4.67 |

| Years | 1811 | 1812 | 1813 | 1814 | 1815 | 1816 | 1817 | 1818 | 1819 | 1820[22] |
|---|---|---|---|---|---|---|---|---|---|---|
| Total Fertility Rate in Sweden | 5.01 | 4.76 | 4.22 | 4.42 | 4.93 | 5.01 | 4.74 | 4.8 | 4.68 | 4.68 |
| Years | 1821 | 1822 | 1823 | 1824 | 1825 | 1826 | 1827 | 1828 | 1829 | 1830[22] |
|---|---|---|---|---|---|---|---|---|---|---|
| Total Fertility Rate in Sweden | 5.03 | 5.09 | 5.22 | 4.9 | 5.18 | 4.94 | 4.44 | 4.77 | 4.94 | 4.67 |
| Years | 1831 | 1832 | 1833 | 1834 | 1835 | 1836 | 1837 | 1838 | 1839 | 1840[22] |
|---|---|---|---|---|---|---|---|---|---|---|
| Total Fertility Rate in Sweden | 4.32 | 4.38 | 4.84 | 4.78 | 4.63 | 4.52 | 4.37 | 4.17 | 4.18 | 4.46 |
| Years | 1841 | 1842 | 1843 | 1844 | 1845 | 1846 | 1847 | 1848 | 1849 | 1850[22] |
|---|---|---|---|---|---|---|---|---|---|---|
| Total Fertility Rate in Sweden | 4.3 | 4.49 | 4.36 | 4.56 | 4.46 | 4.25 | 4.2 | 4.3 | 4.66 | 4.45 |

| Years | 1851 | 1852 | 1853 | 1854 | 1855 | 1856 | 1857 | 1858 | 1859 | 1860[22] |
|---|---|---|---|---|---|---|---|---|---|---|
| Total Fertility Rate in Sweden | 4.36 | 4.2 | 4.26 | 4.53 | 4.3 | 4.23 | 4.36 | 4.66 | 4.71 | 4.71 |
| Years | 1861 | 1862 | 1863 | 1864 | 1865 | 1866 | 1867 | 1868 | 1869 | 1870[22] |
|---|---|---|---|---|---|---|---|---|---|---|
| Total Fertility Rate in Sweden | 4.44 | 4.59 | 4.65 | 4.69 | 4.58 | 4.68 | 4.4 | 3.93 | 4.03 | 4.11 |
| Years | 1871 | 1872 | 1873 | 1874 | 1875 | 1876 | 1877 | 1878 | 1879 | 1880[22] |
|---|---|---|---|---|---|---|---|---|---|---|
| Total Fertility Rate in Sweden | 4.37 | 4.34 | 4.49 | 4.54 | 4.6 | 4.57 | 4.62 | 4.44 | 4.56 | 4.36 |
| Years | 1881 | 1882 | 1883 | 1884 | 1885 | 1886 | 1887 | 1888 | 1889 | 1890[22] |
|---|---|---|---|---|---|---|---|---|---|---|
| Total Fertility Rate in Sweden | 4.29 | 4.32 | 4.24 | 4.4 | 4.34 | 4.39 | 4.36 | 4.24 | 4.1 | 4.15 |
| Years | 1891 | 1892 | 1893 | 1894 | 1895 | 1896 | 1897 | 1898 | 1899 | 1900[22] |
|---|---|---|---|---|---|---|---|---|---|---|
| Total Fertility Rate in Sweden | 4.14 | 3.93 | 3.97 | 3.94 | 4.01 | 3.98 | 3.92 | 3.99 | 3.9 | 4 |
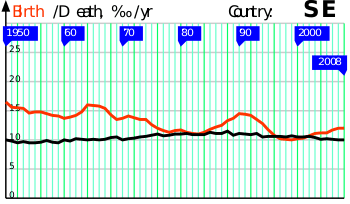
Vital statistics since 1900
Data according to Statistics Sweden, which collects the official statistics for Sweden.[23]
| Average population |
Live births | Deaths | Natural change | Crude birth rate (per 1000) | Crude death rate (per 1000) | Natural change (per 1000) | Total fertility rates[fn 1] | |
|---|---|---|---|---|---|---|---|---|
| 1900 | 5,117,000 | 138,139 | 86,146 | 51,993 | 27.0 | 16.8 | 10.2 | 4.02 |
| 1901 | 5,156,000 | 139,370 | 82,772 | 56,598 | 27.0 | 16.1 | 11.0 | 4.04 |
| 1902 | 5,187,000 | 137,364 | 79,722 | 57,642 | 26.5 | 15.4 | 11.1 | 3.95 |
| 1903 | 5,210,000 | 133,896 | 78,610 | 55,286 | 25.7 | 15.1 | 10.6 | 3.82 |
| 1904 | 5,241,000 | 134,952 | 80,152 | 54,800 | 25.7 | 15.3 | 10.5 | 3.83 |
| 1905 | 5,278,000 | 135,409 | 82,443 | 52,966 | 25.7 | 15.6 | 10.0 | 3.83 |
| 1906 | 5,316,000 | 136,620 | 76,366 | 60,254 | 25.7 | 14.4 | 11.3 | 3.81 |
| 1907 | 5,357,000 | 136,793 | 78,149 | 58,644 | 25.5 | 14.6 | 10.9 | 3.77 |
| 1908 | 5,404,000 | 138,874 | 80,568 | 58,306 | 25.7 | 14.9 | 10.8 | 3.79 |
| 1909 | 5,453,000 | 139,505 | 74,538 | 64,967 | 25.6 | 13.7 | 11.9 | 3.71 |
| 1910 | 5,499,000 | 135,625 | 77,212 | 58,413 | 24.7 | 14.0 | 10.6 | 3.60 |
| 1911 | 5,542,000 | 132,977 | 76,462 | 56,515 | 24.0 | 13.8 | 10.2 | 3.49 |
| 1912 | 5,583,000 | 132,868 | 79,241 | 53,627 | 23.8 | 14.2 | 9.6 | 3.44 |
| 1913 | 5,621,000 | 130,200 | 76,724 | 53,476 | 23.2 | 13.6 | 9.5 | 3.32 |
| 1914 | 5,659,000 | 129,458 | 78,311 | 51,147 | 22.9 | 13.8 | 9.0 | 3.29 |
| 1915 | 5,696,000 | 122,997 | 83,587 | 39,410 | 21.6 | 14.7 | 6.9 | 3.06 |
| 1916 | 5,735,000 | 121,679 | 77,771 | 43,908 | 21.2 | 13.6 | 7.7 | 2.99 |
| 1917 | 5,779,000 | 120,855 | 77,385 | 43,470 | 20.9 | 13.4 | 7.5 | 2.93 |
| 1918 | 5,807,000 | 117,955 | 104,594 | 13,361 | 20.3 | 18.0 | 2.3 | 2.83 |
| 1919 | 5,830,000 | 115,193 | 84,289 | 30,904 | 19.8 | 14.5 | 5.3 | 2.72 |
| 1920 | 5,876,000 | 138,753 | 78,128 | 60,625 | 23.6 | 13.3 | 10.3 | 3.22 |
| 1921 | 5,929,000 | 127,723 | 73,536 | 54,187 | 21.5 | 12.4 | 9.1 | 2.93 |
| 1922 | 5,971,000 | 116,946 | 76,343 | 40,603 | 19.6 | 12.8 | 6.8 | 2.66 |
| 1923 | 5,997,000 | 113,435 | 68,424 | 45,011 | 18.9 | 11.4 | 7.5 | 2.55 |
| 1924 | 6,021,000 | 109,055 | 72,001 | 37,054 | 18.1 | 12.0 | 6.2 | 2.43 |
| 1925 | 6,045,000 | 106,292 | 70,918 | 35,374 | 17.6 | 11.7 | 5.9 | 2.34 |
| 1926 | 6,064,000 | 102,007 | 71,344 | 30,663 | 16.8 | 11.8 | 5.1 | 2.22 |
| 1927 | 6,081,000 | 97,994 | 77,219 | 20,775 | 16.1 | 12.7 | 3.4 | 2.11 |
| 1928 | 6,097,000 | 97,868 | 73,267 | 24,601 | 16.1 | 12.0 | 4.0 | 2.08 |
| 1929 | 6,113,000 | 92,861 | 74,538 | 18,323 | 15.2 | 12.2 | 3.0 | 1.95 |
| 1930 | 6,131,000 | 94,220 | 71,790 | 22,430 | 15.4 | 11.7 | 3.7 | 1.96 |
| 1931 | 6,152,000 | 91,074 | 77,121 | 13,953 | 14.8 | 12.5 | 2.3 | 1.88 |
| 1932 | 6,176,000 | 89,779 | 71,459 | 18,320 | 14.5 | 11.6 | 3.0 | 1.83 |
| 1933 | 6,201,000 | 85,020 | 69,607 | 15,413 | 13.7 | 11.2 | 2.5 | 1.72 |
| 1934 | 6,222,000 | 85,092 | 69,921 | 15,171 | 13.7 | 11.2 | 2.4 | 1.67 |
| 1935 | 6,242,000 | 85,906 | 72,813 | 13,093 | 13.8 | 11.7 | 2.1 | 1.70 |
| 1936 | 6,259,000 | 88,938 | 74,836 | 14,102 | 14.2 | 12.0 | 2.3 | 1.75 |
| 1937 | 6,276,000 | 90,373 | 75,392 | 14,981 | 14.4 | 12.0 | 2.4 | 1.77 |
| 1938 | 6,297,000 | 93,946 | 72,693 | 21,253 | 14.9 | 11.5 | 3.4 | 1.84 |
| 1939 | 6,326,000 | 97,380 | 72,876 | 24,504 | 15.4 | 11.5 | 3.9 | 1.90 |
| 1940 | 6,356,000 | 95,778 | 72,748 | 23,030 | 15.1 | 11.4 | 3.6 | 1.86 |
| 1941 | 6,389,000 | 99,727 | 71,910 | 27,817 | 15.6 | 11.3 | 4.4 | 1.92 |
| 1942 | 6,432,000 | 113,961 | 63,741 | 50,220 | 17.7 | 9.9 | 7.8 | 2.19 |
| 1943 | 6,491,000 | 125,392 | 66,105 | 59,287 | 19.3 | 10.2 | 9.1 | 2.41 |
| 1944 | 6,560,000 | 134,991 | 72,284 | 62,707 | 20.6 | 11.0 | 9.6 | 2.61 |
| 1945 | 6,636,000 | 135,373 | 71,901 | 63,472 | 20.4 | 10.8 | 9.6 | 2.63 |
| 1946 | 6,719,000 | 132,597 | 70,635 | 61,962 | 19.7 | 10.5 | 9.2 | 2.57 |
| 1947 | 6,803,000 | 128,779 | 73,579 | 55,200 | 18.9 | 10.8 | 8.1 | 2.50 |
| 1948 | 6,883,000 | 126,683 | 67,693 | 58,990 | 18.4 | 9.8 | 8.6 | 2.47 |
| 1949 | 6,956,000 | 121,272 | 69,537 | 51,735 | 17.4 | 10.0 | 7.4 | 2.39 |
| 1950 | 7,014,000 | 115,414 | 70,296 | 45,118 | 16.5 | 10.0 | 6.4 | 2.28 |
| 1951 | 7,073,000 | 110,168 | 69,799 | 40,369 | 15.6 | 9.9 | 5.7 | 2.20 |
| 1952 | 7,125,000 | 110,192 | 68,270 | 41,922 | 15.5 | 9.6 | 5.9 | 2.22 |
| 1953 | 7,171,000 | 110,144 | 69,553 | 40,591 | 15.4 | 9.7 | 5.7 | 2.25 |
| 1954 | 7,213,000 | 105,096 | 69,030 | 36,066 | 14.6 | 9.6 | 5.0 | 2.18 |
| 1955 | 7,262,000 | 107,305 | 68,634 | 38,671 | 14.8 | 9.5 | 5.3 | 2.25 |
| 1956 | 7,315,000 | 107,960 | 70,205 | 37,755 | 14.8 | 9.6 | 5.2 | 2.29 |
| 1957 | 7,364,000 | 107,168 | 73,132 | 34,036 | 14.6 | 9.9 | 4.6 | 2.29 |
| 1958 | 7,409,000 | 105,502 | 71,065 | 34,437 | 14.2 | 9.6 | 4.6 | 2.26 |
| 1959 | 7,446,000 | 104,743 | 70,889 | 33,854 | 14.1 | 9.5 | 4.5 | 2.29 |
| 1960 | 7,480,000 | 102,219 | 75,093 | 27,126 | 13.7 | 10.0 | 3.6 | 2.17 |
| 1961 | 7,520,000 | 104,501 | 73,555 | 30,946 | 13.9 | 9.8 | 4.1 | 2.21 |
| 1962 | 7,562,000 | 107,284 | 76,791 | 30,493 | 14.2 | 10.2 | 4.0 | 2.25 |
| 1963 | 7,604,000 | 112,903 | 76,460 | 36,443 | 14.8 | 10.1 | 4.8 | 2.33 |
| 1964 | 7,661,000 | 122,664 | 76,661 | 46,003 | 16.0 | 10.0 | 6.0 | 2.47 |
| 1965 | 7,734,000 | 122,806 | 78,194 | 44,612 | 15.9 | 10.1 | 5.8 | 2.39 |
| 1966 | 7,808,000 | 123,354 | 78,440 | 44,914 | 15.8 | 10.0 | 5.8 | 2.37 |
| 1967 | 7,868,000 | 121,360 | 79,783 | 41,577 | 15.4 | 10.1 | 5.3 | 2.28 |
| 1968 | 7,914,000 | 113,087 | 82,476 | 30,611 | 14.3 | 10.4 | 3.9 | 2.07 |
| 1969 | 7,968,000 | 107,622 | 83,352 | 24,270 | 13.5 | 10.5 | 3.0 | 1.94 |
| 1970 | 8,043,000 | 110,150 | 80,026 | 30,124 | 13.7 | 9.9 | 3.7 | 1.94 |
| 1971 | 8,098,000 | 114,484 | 82,717 | 31,767 | 14.1 | 10.2 | 3.9 | 1.98 |
| 1972 | 8,122,000 | 112,273 | 84,051 | 28,222 | 13.8 | 10.3 | 3.5 | 1.93 |
| 1973 | 8,137,000 | 109,663 | 85,640 | 24,023 | 13.5 | 10.5 | 3.0 | 1.88 |
| 1974 | 8,161,000 | 109,874 | 86,316 | 23,558 | 13.5 | 10.6 | 2.9 | 1.91 |
| 1975 | 8,193,000 | 103,632 | 88,208 | 15,424 | 12.6 | 10.8 | 1.9 | 1.78 |
| 1976 | 8,222,000 | 98,345 | 90,677 | 7,668 | 12.0 | 11.0 | 0.9 | 1.70 |
| 1977 | 8,252,000 | 96,057 | 88,202 | 7,855 | 11.6 | 10.7 | 1.0 | 1.64 |
| 1978 | 8,276,000 | 93,248 | 89,681 | 3,567 | 11.3 | 10.8 | 0.4 | 1.61 |
| 1979 | 8,294,000 | 96,255 | 91,074 | 5,181 | 11.6 | 11.0 | 0.6 | 1.66 |
| 1980 | 8,310,000 | 97,064 | 91,800 | 5,264 | 11.7 | 11.0 | 0.6 | 1.69 |
| 1981 | 8,320,000 | 94,065 | 92,034 | 2,031 | 11.3 | 11.1 | 0.2 | 1.63 |
| 1982 | 8,325,000 | 92,748 | 90,671 | 2,077 | 11.1 | 10.9 | 0.2 | 1.60 |
| 1983 | 8,329,000 | 91,780 | 90,791 | 989 | 11.0 | 10.9 | 0.1 | 1.61 |
| 1984 | 8,337,000 | 93,889 | 90,483 | 3,406 | 11.3 | 10.9 | 0.4 | 1.66 |
| 1985 | 8,350,000 | 98,463 | 94,032 | 4,431 | 11.8 | 11.3 | 0.5 | 1.74 |
| 1986 | 8,370,000 | 101,950 | 93,295 | 8,655 | 12.2 | 11.1 | 1.0 | 1.79 |
| 1987 | 8,398,000 | 104,699 | 93,307 | 11,392 | 12.5 | 11.1 | 1.4 | 1.84 |
| 1988 | 8,437,000 | 112,080 | 96,743 | 15,337 | 13.3 | 11.5 | 1.8 | 1.96 |
| 1989 | 8,493,000 | 116,023 | 92,110 | 23,913 | 13.7 | 10.8 | 2.8 | 2.02 |
| 1990 | 8,559,000 | 123,938 | 95,161 | 28,777 | 14.5 | 11.1 | 3.4 | 2.14 |
| 1991 | 8,617,000 | 123,737 | 95,202 | 28,535 | 14.4 | 11.0 | 3.3 | 2.12 |
| 1992 | 8,668,000 | 122,848 | 94,710 | 28,138 | 14.2 | 10.9 | 3.2 | 2.09 |
| 1993 | 8,719,000 | 117,998 | 97,008 | 20,990 | 13.5 | 11.1 | 2.4 | 2.00 |
| 1994 | 8,781,000 | 112,257 | 91,844 | 20,413 | 12.8 | 10.5 | 2.3 | 1.90 |
| 1995 | 8,831,000 | 103,326 | 96,910 | 6,416 | 11.7 | 11.0 | 0.7 | 1.74 |
| 1996 | 8,843,000 | 95,297 | 94,133 | 1,164 | 10.8 | 10.6 | 0.1 | 1.61 |
| 1997 | 8,846,000 | 89,171 | 92,674 | -3,503 | 10.1 | 10.5 | -0.4 | 1.52 |
| 1998 | 8,851,000 | 88,384 | 92,891 | -4,507 | 10.0 | 10.5 | -0.5 | 1.51 |
| 1999 | 8,858,000 | 88,173 | 94,726 | -6,553 | 10.0 | 10.7 | -0.7 | 1.50 |
| 2000 | 8,872,000 | 90,441 | 93,285 | -2,844 | 10.2 | 10.5 | -0.3 | 1.54 |
| 2001 | 8,896,000 | 91,466 | 93,752 | -2,286 | 10.3 | 10.5 | -0.3 | 1.57 |
| 2002 | 8,925,000 | 95,815 | 95,009 | 806 | 10.7 | 10.6 | 0.1 | 1.65 |
| 2003 | 8,958,000 | 99,157 | 92,961 | 6,196 | 11.1 | 10.4 | 0.7 | 1.71 |
| 2004 | 8,994,000 | 100,928 | 90,532 | 10,396 | 11.2 | 10.1 | 1.2 | 1.75 |
| 2005 | 9,030,000 | 101,346 | 91,710 | 9,636 | 11.2 | 10.2 | 1.1 | 1.77 |
| 2006 | 9,081,000 | 105,913 | 91,177 | 14,736 | 11.7 | 10.0 | 1.6 | 1.85 |
| 2007 | 9,148,000 | 107,421 | 91,729 | 15,692 | 11.7 | 10.0 | 1.7 | 1.88 |
| 2008 | 9,220,000 | 109,301 | 91,449 | 17,852 | 11.9 | 9.9 | 1.9 | 1.91 |
| 2009 | 9,299,000 | 111,801 | 90,080 | 21,721 | 12.0 | 9.7 | 2.3 | 1.94 |
| 2010 | 9,378,000 | 115,641 | 90,487 | 25,154 | 12.3 | 9.6 | 2.7 | 1.98 |
| 2011 | 9,449,000 | 111,770 | 89,938 | 21,832 | 11.8 | 9.5 | 2.3 | 1.90 |
| 2012 | 9,519,000 | 113,177 | 91,938 | 21,239 | 11.9 | 9.7 | 2.2 | 1.91 |
| 2013 | 9,644,000 | 113,593 | 90,402 | 23,191 | 11.8 | 9.4 | 2.4 | 1.89 |
| 2014 | 9,747,000 | 114,907 | 88,976 | 25,931 | 11.9 | 9.2 | 2.7 | 1.88 |
| 2015 | 9,851,000 | 114,870 | 90,907 | 23,963 | 11.7 | 9.3 | 2.4 | 1.85 |
| 2016 | 9,995,000 | 117,425 | 90,982 | 26,443 | 11.8 | 9.2 | 2.6 | 1.85 |
| 2017 | 10,120,000 | 115,416 | 91,972 | 23,444 | 11.4 | 9.1 | 2.3 | 1.78 |
| 2018 | 10,230,000 | 115,832 | 92,185 | 23,647 | 11.3 | 9.0 | 2.3 | 1.75 |
| 2019 | 10,327,000 | 114,523 | 88,766 | 25,757 | 11.1 | 8.7 | 2.4 | 1.70 |
Life expectancy from 1751 to 2015
Sources: Our World In Data and the United Nations.
1751–1949
| Years | 1751 | 1754 | 1756 | 1768 | 1776 | 1781 | 1789 | 1795 | 1810 | 1818 | 1824 | 1837 | 1847 | 1855 | 1861[4] |
|---|---|---|---|---|---|---|---|---|---|---|---|---|---|---|---|
| Life expectancy in Sweden | 38.4 | 37.4 | 36.2 | 35.0 | 41.5 | 37.8 | 31.2 | 36.5 | 31.9 | 40.0 | 44.9 | 39.6 | 40.1 | 43.0 | 47.1 |
| Years | 1868 | 1872 | 1878 | 1884 | 1890 | 1896 | 1905 | 1911 | 1913 | 1916 | 1922 | 1929 | 1935 | 1943 | 1949[4] |
|---|---|---|---|---|---|---|---|---|---|---|---|---|---|---|---|
| Life expectancy in Sweden | 43.2 | 50.0 | 47.6 | 49.1 | 50.4 | 53.4 | 54.5 | 58.0 | 58.7 | 58.2 | 61.0 | 62.3 | 64.9 | 68.7 | 70.8 |
1950–2015
| Period | Life expectancy in Years |
Period | Life expectancy in Years |
|---|---|---|---|
| 1950–1955 | 71.9 | 1985–1990 | 77.2 |
| 1955–1960 | 72.9 | 1990–1995 | 78.2 |
| 1960–1965 | 73.5 | 1995–2000 | 79.3 |
| 1965–1970 | 74.1 | 2000–2005 | 80.1 |
| 1970–1975 | 74.8 | 2005–2010 | 81.1 |
| 1975–1980 | 75.4 | 2010–2015 | 81.9 |
| 1980–1985 | 76.4 |
Source: UN World Population Prospects[24]
Migration
Prior to World War II, emigrants generally outnumbered immigrants. Since then, net migration has been positive with many immigrants coming to Sweden from the 1970s through today.
Emigration
Between 1820 and 1930, approximately 1.3 million Swedes, a third of the country's population at the time, emigrated to North America, and most of them to the United States. There are more than 4.4 million Swedish Americans according to a 2006 US Census Bureau estimate.[25] In Canada, the community of Swedish ancestry is 330,000 strong.[26]
Immigration
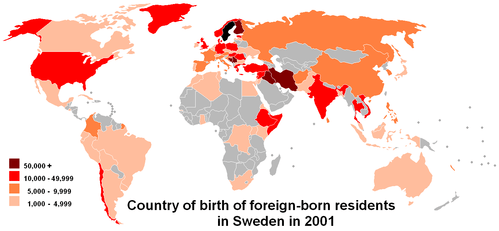
.jpg)
The demographic profile of Sweden has altered considerably due to immigration patterns since the 1970s. As of 2017, Statistics Sweden reported that around 2,439,007 or 24.1% of the inhabitants of Sweden were from a foreign background: that is, each such person either had been born abroad or had been born in Sweden to two parents who themselves had both been born abroad.[27] Also taking into account people with only one parent born abroad, this number increases to almost a third in 2017.[28]
Additionally, the birth rate among immigrant women after arriving in Sweden is somewhat higher than among ethnic Swedes.[29] Taking into account the fact that immigrant women have on average fewer children than Swedish women of comparable age, however, the difference in total birth rate is only 0.1 children more if the woman is foreign born – with the disclaimer that some women may have children not immigrating to and not reported in Sweden, who are thus not included in the statistics.[30]
Historical immigration
- World War II
Immigration increased markedly with World War II. Historically, the most numerous of foreign born nationalities are ethnic Germans from Germany and other Scandinavians from Denmark and Norway. In short order, 70,000 war children were evacuated from Finland, of which 15,000 remained in Sweden. Also, many of Denmark's nearly 7,000 Jews who were evacuated to Sweden decided to remain there.
A sizable community from the Baltic States (Estonia, Latvia and Lithuania) arrived during the Second World War.[31]
- 1945 to 1967
During the 1950s and 1960s, the recruitment of immigrant labour was an important factor of immigration. The Nordic countries signed a trade agreement in 1952, establishing a common labour market and free movement across borders. This migration within the Nordic countries, especially from Finland to Scandinavia, was essential to create the tax-base required for the expansion of the strong public sector now characteristic of Scandinavia. This continued until 1967, when the labour market became saturated, and Sweden introduced new immigration controls.
On a smaller scale, Sweden took in political refugees from Hungary and the former Czechoslovakia after their countries were invaded by the Soviet Union in 1956 and 1968, respectively.
Contemporary immigration
Since the early 1970s, immigration to Sweden has been mostly due to refugee migration and family reunification from countries in the Middle East and Latin America.[32] According to Eurostat, in 2010, there were 1.33 million foreign-born residents in Sweden, corresponding to 14.3% of the total population. Of these, 859,000 (64.3%) were born outside the EU and 477,000 (35.7%) were born in another EU Member State.[33][34] By comparison, the Swedish civil registry reports, for 2018, that nearly 1.96 million residents are foreign-born, a 47% increase from 2010. There are 8.27 million Swedish-born residents, giving a total population of 10.23 million, and a 19.1% foreign-born population.[35]
The first group of Assyrians/Syriacs moved to Sweden from Lebanon in 1967. Many of them live in Södertälje (Stockholm).[36][37] There are also around 40,000 Roma in Sweden.[38] Some Roma people have long historical roots in Sweden, while others are more recent migrants from elsewhere in Europe.
Immigrants from Western Asia have been a rapidly growing share of Sweden's population. According to the government agency Statistics Sweden, the number of immigrants born in all of Asia (including the Middle East) rose from just 1,000 in 1950 to 295,000 in 2003.[39] Most of those immigrants came from Iraq, Iran, Lebanon and Syria, according to Statistics Sweden.[39]
Immigration of Iraqis increased dramatically during the Iraq War, beginning in 2003. A total of 8,951 Iraqis came to Sweden in 2006, accounting for 45% of the entire Iraqi migration to Europe. By 2007, the community of Iraqis in Sweden numbered above 70,000. In 2008, Sweden introduced tighter rules on asylum seekers.[40]
A significant number of Syrian Christians have also settled in Sweden. There have also been immigrants from South-Central Asia such as Afghanistan and Pakistan. Since the European migrant crisis, Syrians became the second-largest group of foreign-born persons in the Swedish civil registry in 2017 with 158,443 people (after former Yugoslavia).
Note that the table below lists the citizenship the person had when arriving in Sweden, and therefore there are no registered Eritreans, Russians or Bosnians from 1990, they were recorded as Ethiopians, Soviets and Yugoslavs. The nationality of Yugoslavs below is therefore people who came to Sweden from the Socialist Federal Republic of Yugoslavia before 1991 and people who came from today's Montenegro and Serbia before 2003, then called the Federal Republic of Yugoslavia. Counting all people who came from Slovenia, Croatia, Bosnia and Herzegovina, Serbia, Montenegro, Kosovo, Macedonia, Serbia and Montenegro, the Federal Republic of Yugoslavia and the Socialist Federal Republic of Yugoslavia, there were 176,033 people from there in 2018.
| Country | 1900 | 1930 | 1960 | 1990 | 2000 | 2010 | 2018 | 2019 |
|---|---|---|---|---|---|---|---|---|
| − | − | 6 | 5,874 | 14,162 | 20,758 | 185,991 | 191,530 | |
| − | − | 16 | 9,818 | 49,372 | 121,761 | 144,035 | 146,048 | |
| 6,644 | 9,746 | 101,307 | 217,636 | 195,447 | 169,521 | 147,883 | 144,561 | |
| − | 1,065 | 6,347 | 35,631 | 40,123 | 70,253 | 92,759 | 93,722 | |
| 2 | 8 | 115 | 40,084 | 51,101 | 62,120 | 77,386 | 80,136 | |
| − | − | − | 1,441 | 13,082 | 37,846 | 68,678 | 70,173 | |
| − | 19 | 1,532 | 43,346 | 71,972 | 70,819 | 65,124 | 64,349 | |
| − | − | − | − | 51,526 | 56,183 | 59,395 | 60,012 | |
| − | − | 17 | 534 | 4,287 | 14,420 | 51,979 | 58,780 | |
| 15 | 22 | 202 | 25,528 | 31,894 | 42,527 | 49,948 | 51,689 | |
| 5,107 | 8,566 | 37,580 | 37,558 | 38,155 | 48,158 | 51,140 | 51,436 | |
| − | − | − | − | 3,054 | 10,301 | 42,300 | 45,734 | |
| − | − | 20 | 4,934 | 10,353 | 31,378 | 42,394 | 43,556 | |
| 7,978 | 14,731 | 37,253 | 52,744 | 42,464 | 43,480 | 41,747 | 41,578 | |
| 45 | 135 | 361 | 9,054 | 11,110 | 17,863 | 35,288 | 40,641 | |
| 6,872 | 8,726 | 35,112 | 43,931 | 38,190 | 45,548 | 40,011 | 39,457 | |
| 34 | 201 | 520 | 3,896 | 8,150 | 23,998 | 33,288 | 35,282 | |
| 3 | 34 | 719 | 8,785 | 11,776 | 19,741 | 31,040 | 32,294 | |
| 779 | 1,270 | 2,738 | 11,378 | 14,602 | 20,839 | 28,976 | 29,979 | |
| − | − | 15 | 15,986 | 20,038 | 24,116 | 28,119 | 28,508 | |
| 6 | 28 | 69 | 27,635 | 26,842 | 28,387 | 27,995 | 28,025 | |
| 5,130 | 8,852 | 10,874 | 13,001 | 14,413 | 17,179 | 21,943 | 22,802 | |
| 1,506 | − | − | − | 6,523 | 15,511 | 21,615 | 22,265 | |
| 5 | − | 59 | 10,027 | 11,907 | 13,822 | 20,695 | 21,686 | |
| − | − | 1 | 6,265 | 10,898 | 14,584 | 19,741 | 20,676 | |
| 5 | 22 | 266 | 13,171 | 10,851 | 11,381 | 18,917 | 19,547 | |
| − | − | 11 | 2,291 | 3,100 | 10,265 | 16,185 | 19,107 | |
| 50 | 108 | 8,544 | 15,045 | 14,127 | 15,339 | 16,799 | 16,728 | |
| − | 149 | − | 233 | 785 | 6,735 | 14,732 | 15,596 | |
| − | − | 5 | 2,613 | 5,460 | 9,826 | 14,509 | 15,281 | |
| − | − | − | − | − | 5,324 | 13,856 | 15,022 | |
| − | − | − | − | 6,337 | 7,804 | 13,192 | 13,741 | |
| − | − | − | − | 7,317 | 10,531 | 12,575 | 12,865 | |
| − | − | − | − | 5,079 | 6,763 | 12,268 | 12,688 | |
| − | − | − | − | 4,532 | 8,700 | 12,095 | 12,470 | |
| − | − | − | − | 5,229 | 6,277 | 11,163 | 11,844 | |
| − | − | − | − | 9,170 | 10,398 | 11,353 | 11,642 | |
| − | − | − | − | 5,602 | 7,944 | 11,159 | 11,537 | |
| − | − | − | − | 4,492 | 7,391 | 11,025 | 11,530 | |
| − | − | − | − | 2,937 | 6,289 | 10,009 | 11,520 | |
| − | − | − | − | 1,459 | 4,741 | 9,924 | 11,069 | |
| − | − | − | − | − | 2,288 | 9,487 | 10,420 | |
| − | − | − | − | 3,496 | 6,005 | 9,297 | 10,159 | |
| Total | 35,627 | 61,657 | 299,879 | 790,445 | 1,003,798 | 1,384,929 | 1,955,569 | 2,019,733 |
The twenty-five largest groups of foreign-born persons in the Swedish civil registry as of autumn 2018 were:[42]
.svg.png)


- This only lists Swedish Finns born outside of Sweden; There are ~569,000 people of Finnish origin living in Sweden
- The seven successor states of Yugoslavia and their historic counterparts (Slovenia, Croatia, Bosnia, Serbia, North Macedonia, Montenegro, and Kosovo) are counted as one group in many agencies across Sweden. There are also roughly 100,000 native-born "Yugoslavians" in Sweden
The ten most common countries of birth among immigrants registered in Sweden during 2016 (including asylum seekers who came in 2015) were the following:[43]
Language
The Swedish language is by far the dominating language in Sweden, and is used by the government administration. English is also widely spoken and is taught in public schools.
Since 1999, Sweden has five officially recognised minority languages: Sami, Meänkieli, Standard Finnish, Romani chib and Yiddish.
The Sami language, spoken by about 7,000 people in Sweden, may be used in government agencies, courts, preschools and nursing homes in the municipalities of Arjeplog, Gällivare, Jokkmokk and Kiruna and its immediate neighbourhood.
Similarly, Finnish and Meänkieli can be used in the municipalities of Gällivare, Haparanda, Kiruna, Pajala and Övertorneå and its immediate neighbourhood. Finnish is also official language, along with Swedish, in the city of Eskilstuna.
During the mid to late 20th century, immigrant communities brought other languages, among others being Persian, Serbo-Croatian, Arabic and Neo-Aramaic.[44]
Religion
The majority (57.7%) of the population belongs to the Church of Sweden,[45] the Lutheran church that was disestablished in 2000. This is because until 1996, those who had family members in the church automatically became members at birth. Other Christian denominations in Sweden include the Roman Catholic Church (see Catholic Church of Sweden), several Orthodox churches in diaspora, Baptist, Pentecostal, Neo-pietistic (nyevangeliska) and other evangelical Christian churches (frikyrkor = 'free churches'). Shamanism persisted among the Sami people up until the 18th century, but no longer exists in its traditional form as most Sami today belong to the Lutheran church.
Jews were permitted to practice their religion in five Swedish cities in 1782, and have enjoyed full rights as citizens since 1870. The new Freedom of Religion Bill was passed in 1951, and former obstacles against Non-Lutherans working in schools and hospitals were removed. Further, that bill made it legal to leave any religious denomination, without entering another. There are also many Muslims, as well as a number of Buddhists and Bahá'í in Sweden, mainly as a result of 20th and 21st century immigration. There is also a small Zoroastrian community in Sweden.
See also
- Statistics Sweden
- Municipalities of Sweden
- Demographical center of Sweden
- Immigration to Europe
- List of countries by immigrant population
- Aging of Europe
Notes
- In fertility rates, 2.1 and above represents a stable or increasing population and have been marked blue, while 2.0 and below leads to an aging and, ultimately, declining population.
References
- Population Archived 2 May 2019 at the Wayback Machine. Statistics Sweden. Retrieved 6 July 2019.
- Radio, Sveriges. "Swedish population hits 10-million mark - Radio Sweden". sverigesradio.se. Retrieved 19 September 2019.
- "Sweden's population reaches historic ten million milestone". www.thelocal.se. 20 January 2017. Retrieved 19 September 2019.
- "Life expectancy". Our World in Data. Retrieved 11 October 2018.
- "Sweden Population 2018", World Population Review
- "Sweden". The World Factbook. Central Intelligence Agency.
- "Preliminary Population Statistics by month, 2020". Statistics Sweden. Retrieved 5 June 2020.
- "The 2005 population and housing census in Sweden will be totally register-based". Census Knowledge Base. United Nations Statistics Division.
- Bruhn, Åke (6 July 2001). "The 2005 population and housing census in Sweden will be totally register-based". Symposium on Global Review of 2000 Round of Population and Housing Censuses: Mid-Decade Assessment and Future Prospects. Retrieved 12 March 2017: Does not provide figures, only methodology.
- Gustav Sundbärg, Sveriges land och folk (1901), p. 90.
- "Population and Population Changes 1749–2015". Statistics Sweden. Archived from the original on 16 February 2017.
- "World Population Prospects – Population Division – United Nations". Esa.un.org. Archived from the original on 1 December 2017. Retrieved 16 December 2017.
- "Sveriges framtida befolkning 2017–2060" (PDF). Statistics Sweden. Retrieved 16 April 2017.
- "Population on 1st January by age and sex". Eurostat Commission. Retrieved 14 June 2017.
- Yearbook of Housing and Building Statistics 2007
- Broadbent, Noel (16 March 2010). Lapps and Labyrinths: Saami Prehistory, Colonisation, and Cultural Resilience. Smithsonian Institution Scholarly Press. p. 304. ISBN 978-0-9788460-6-0.
- Aikio, Ante. "The Study of Saami Substrate Toponyms in Finland" (PDF). Retrieved 12 June 2020.
- "National minorities and minority languages" (PDF). Government Offices of Sweden. Retrieved 26 June 2020.
- "Number of persons with foreign or Swedish background (detailed division) by region, age and sex. Year 2016". Statistics Sweden. 8 June 2017. Archived from the original on 12 July 2017. Retrieved 11 July 2017.
- "Statistics Sweden". Archived from the original on 6 July 2017. Retrieved 7 July 2017.
- "World Factbook EUROPE : SWEDEN", The World Factbook, 12 July 2018
- Max Roser (2014), "Total Fertility Rate around the world over the last centuries", Our World In Data, Gapminder Foundation, archived from the original on 7 August 2018, retrieved 7 August 2018
- "Statistics Sweden". Scb.se. Retrieved 16 December 2017.
- "World Population Prospects – Population Division – United Nations". Archived from the original on 19 September 2016. Retrieved 15 July 2017.
- "United States – Selected Social Characteristics: 2006". United States Census Bureau. Archived from the original on 12 February 2020. Retrieved 21 March 2014.
- "Ethnocultural Portrait of Canada Highlight Tables, 2006 Census". Statistics Canada. 2 April 2008. Archived from the original on 23 July 2013. Retrieved 30 June 2008.
- "Number of persons by foreign/Swedish background, age, sex and year". Statistics Sweden. Retrieved 31 March 2017.
- "Statistikdatabasen – välj tabell". Statistikdatabasen.scb.se. Retrieved 16 December 2017.
- "Visa detaljerad information". Scb.se. Retrieved 16 December 2017.
- "Får utrikes födda fler barn?". Statistiska Centralbyrån. Retrieved 29 October 2016.
- Pocket Facts: Statistics on Integration (PDF). Integrationsverket. The Swedish Integration Board. 2006. ISBN 91-89609-30-1. Archived from the original (PDF) on 5 June 2007.
- Sweden: Restrictive Immigration Policy and Multiculturalism, Migration Policy Institute, 2006.
- Vasileva, Katya (2011). "6.5% of the EU population are foreigners and 9.4% are born abroad" (PDF). Statistics in focus. Eurostat (34). Archived from the original (PDF) on 28 January 2012.
- "Statistikdatabasen – välj tabell". Ssd.scb.se. Archived from the original on 6 April 2011. Retrieved 16 December 2017.
- "Population by country of birth, age and sex. Year 2000 - 2018". Statistikdatabasen. Retrieved 15 September 2019.
- "Assyrier/Syrianer – Vilka är de?" [Assyrians/Syriacs – Who are they?] (in Swedish). Ronnaskolan.sodertalje.se. Archived from the original on 8 February 2009.
- Vems är historien? Historia som medvetande, kultur och handling i det mångkulturella Sverige [Who Does History Belong To? History as Consciousness, Culture and Action in Multicultural Sweden] (PDF) (in Swedish). educ.umu.se. 2006. ISBN 91-7264-128-2. ISSN 1653-6894. Archived from the original (PDF) on 6 November 2006.
- United Nations High Commissioner for Refugees (17 October 2012). "UNHCR | Refworld | The Situation of Roma in Selected Western European Countries". Archived from the original on 17 October 2012. Retrieved 16 January 2020.
- "Immigration and emigration in the postwar period, Yugoslav immigration was substantial" (PDF). Statistics Sweden. 2004. p. 96. Retrieved 16 December 2017.
- "Sweden tightens rules on Iraqi asylum seekers". reuters.com. 6 July 2007. Retrieved 14 December 2010.
- "Folkmängd efter födelseland 1900–2017". Statistics Sweden. 21 February 2018.
- "Befolkning efter födelseland och år". Statistics Sweden / Befolkning efter födelseland och ursprungsland 31 december 2017. Retrieved 10 September 2018.
- "Invandring till Sverige 2016 och 2015 efter de 20 vanligaste födelseländerna för de invandrade 2016". Statistics Sweden. Retrieved 26 February 2017.
- "Sweden". Ethnologue. 19 February 1999. Retrieved 3 October 2013.
- "Svenska kyrkans medlemsutveckling år 1972–2018" [Swedish church's membership development from 1972–2018] (PDF) (in Swedish). Church of Sweden. Retrieved 2 June 2019.
External links
- Statistics Sweden – Official Data Base available in English

| Europe |  | |
|---|---|---|
| South America |
| |
| Middle East | ||
| Asia | ||
| Africa | ||
| See also | ||
| Wikimedia Commons has media related to Demographics of Sweden. |