Demographics of Guinea-Bissau
This article is about the demographic features of the population of Guinea-Bissau, including population density, ethnicity, education level, health of the populace, economic status, religious affiliations and other aspects of the population.
Ethnic groups
The population of Guinea-Bissau is ethnically diverse with distinct languages, customs, and social structures. Most Guineans, 99%, are Blacks — mostly Fula and Mandinka-speakers concentrated in the north and northeast, the Balanta and Papel, living in the southern coastal regions, and the Manjaco and Mancanha, occupying the central and northern coastal areas.
Most of the rest, 1% of its total population, are mestiços of mixed Portuguese and black descent, including Cape Verdean minority. Due to the exodus of most Portuguese settlers after independence, less than 1% of Guinea-Bissauans are pure Portuguese. The country also has a Chinese minority, including Macanese people of mixed Portuguese and Chinese blood from Macau.
Most people are farmers. 38%-45% are Muslims - this makes Guinea-Bissau the only Portuguese-speaking nation with a sizable Muslim population. Most Muslims are Sunnis. The rest of the population are pagans, principally the Balanta, and Christians, mostly Roman Catholics.
Population
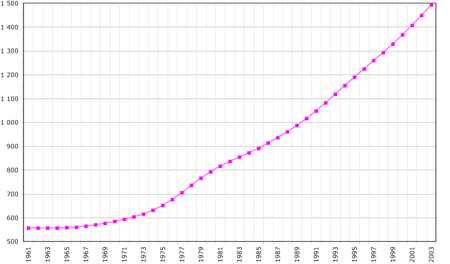
According to the 2019 revision of the World Population Prospects[1][2], Guinea-Bissau's population was 1,874,303 in 2018, compared to 518,000 in 1950.[3] The proportion of the population below the age of 15 in 2010 was 41.3%, 55.4% were aged between 15 and 65 years of age, while 3.3% were aged 65 years or older.[3]
| Total population | Population aged 0–14 (%) | Population aged 15–64 (%) | Population aged 65+ (%) | |
|---|---|---|---|---|
| 1950 | 518 000 | 38.8 | 57.6 | 3.6 |
| 1955 | 566 000 | 41.9 | 54.9 | 3.2 |
| 1960 | 593 000 | 41.3 | 55.7 | 3.0 |
| 1965 | 598 000 | 41.3 | 55.6 | 3.1 |
| 1970 | 603 000 | 37.0 | 59.7 | 3.3 |
| 1975 | 694 000 | 41.0 | 55.7 | 3.3 |
| 1980 | 835 000 | 42.1 | 54.4 | 3.5 |
| 1985 | 922 000 | 45.4 | 51.1 | 3.5 |
| 1990 | 1 017 000 | 43.8 | 52.8 | 3.5 |
| 1995 | 1 125 000 | 44.1 | 52.6 | 3.4 |
| 2000 | 1 241 000 | 43.1 | 53.6 | 3.3 |
| 2005 | 1 368 000 | 42.4 | 54.4 | 3.2 |
| 2010 | 1 515 000 | 41.3 | 55.4 | 3.3 |
Vital statistics
Registration of vital events is in Guinea-Bissau not complete. The Population Departement of the United Nations prepared the following estimates. [3]
| Period | Live births per year | Deaths per year | Natural change per year | CBR* | CDR* | NC* | TFR* | IMR* |
|---|---|---|---|---|---|---|---|---|
| 1950-1955 | 30 000 | 18 000 | 12 000 | 54.9 | 33.5 | 21.4 | 7.41 | 211 |
| 1955-1960 | 25 000 | 17 000 | 7 000 | 42.3 | 29.5 | 12.8 | 5.88 | 201 |
| 1960-1965 | 25 000 | 16 000 | 9 000 | 42.3 | 27.4 | 14.9 | 5.88 | 191 |
| 1965-1970 | 21 000 | 15 000 | 6 000 | 35.6 | 24.8 | 10.8 | 4.78 | 182 |
| 1970-1975 | 36 000 | 18 000 | 18 000 | 55.7 | 27.3 | 28.4 | 7.34 | 174 |
| 1975-1980 | 35 000 | 19 000 | 15 000 | 45.5 | 25.3 | 20.3 | 6.11 | 165 |
| 1980-1985 | 42 000 | 21 000 | 21 000 | 47.9 | 23.5 | 24.4 | 6.70 | 153 |
| 1985-1990 | 44 000 | 21 000 | 23 000 | 45.8 | 22.1 | 23.7 | 6.68 | 145 |
| 1990-1995 | 48 000 | 23 000 | 26 000 | 45.2 | 21.2 | 24.0 | 6.54 | 141 |
| 1995-2000 | 51 000 | 24 000 | 27 000 | 42.8 | 19.9 | 22.9 | 6.05 | 134 |
| 2000-2005 | 54 000 | 24 000 | 29 000 | 41.1 | 18.5 | 22.5 | 5.66 | 126 |
| 2005-2010 | 57 000 | 25 000 | 32 000 | 39.3 | 17.5 | 21.9 | 5.27 | 119 |
| * CBR = crude birth rate (per 1000); CDR = crude death rate (per 1000); NC = natural change (per 1000); IMR = infant mortality rate per 1000 births; TFR = total fertility rate (number of children per woman) | ||||||||
Life expectancy
| Period | Life expectancy in Years[4] |
|---|---|
| 1950–1955 | 35.88 |
| 1955–1960 | |
| 1960–1965 | |
| 1965–1970 | |
| 1970–1975 | |
| 1975–1980 | |
| 1980–1985 | |
| 1985–1990 | |
| 1990–1995 | |
| 1995–2000 | |
| 2000–2005 | |
| 2005–2010 | |
| 2010–2015 |
Other demographic statistics
Demographic statistics according to the World Population Review in 2019.[5]
- One birth every 8 minutes
- One death every 27 minutes
- One net migrant every 288 minutes
- Net gain of one person every 11 minutes
The following demographic are from the independent Ghana Statistical Service and from the CIA World Factbook[6] unless otherwise indicated.
Population
- 1,833,247 (July 2018 est.)
- 1,596,677 (July 2011 est.)
Age structure
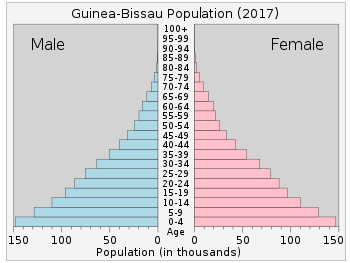
- 0-14 years: 43.55% (male 400,666 /female 397,704)
- 15-24 years: 20.23% (male 181,286 /female 189,515)
- 25-54 years: 29.9% (male 259,762 /female 288,300)
- 55-64 years: 3.29% (male 27,621 /female 32,611)
- 65 years and over: 3.04% (male 24,331 /female 31,451) (2018 est.)
Median age
- total: 17.8 years. Country comparison to the world: 216th
- male: 17.2 years
- female: 18.5 years (2018 est.)
Birth rate
- 37.3 births/1,000 population (2018 est.) Country comparison to the world: 13th
Death rate
- 8.5 deaths/1,000 population (2018 est.) Country comparison to the world: 79th
Total fertility rate
- 4.81 children born/woman (2018 est.) Country comparison to the world: 18th
Population growth rate
- 2.48% (2018 est.) Country comparison to the world: 23rd
- 1.988% (2011 est.)
Contraceptive prevalence rate
- 16% (2014)
Net migration rate
- 0 migrant(s)/1,000 population (2017 est.) Country comparison to the world: 85th
Life expectancy at birth
- total population: 61.4 years (2018 est.)
- male: 59.2 years (2018 est.)
- female: 63.6 years (2018 est.)
- total population: 50.23 years
- male: 48.21 years
- female: 52.31 years (2015 est.)
Dependency ratios
- total dependency ratio: 80.4 (2015 est.)
- youth dependency ratio: 75.2 (2015 est.)
- elderly dependency ratio: 5.2 (2015 est.)
- potential support ratio: 19.3 (2015 est.)
Urbanization
- urban population: 43.4% of total population (2018)
- rate of urbanization: 3.41% annual rate of change (2015-20 est.)
Sex ratio
- at birth: 1.03 male(s)/female
- 0–14 years: 1 male(s)/female
- 15–24 years: 0.98 male(s)/female
- 25–54 years: 0.99 male(s)/female
- 55–64 years: 0.6 male(s)/female
- 65 years and over: 0.6 male(s)/female
- total population: 0.95 male(s)/female (2015 est.)
Nationality
- noun:Guinean (s)
- adjective:Guinean
Ethnic groups[7]
Languages[7]
- Crioulo 90.4%
- Portuguese 27.1% (official)
- French 5.1%
- English 2.9%
- Other 2.4%
Literacy
definition: age 15 and over can read and write
- total population: 59.9%
- male: 71.8%
- female: 48.3% (2015 est.)
References
| Wikimedia Commons has media related to Demographics of Guinea-Bissau. |
- ""World Population prospects – Population division"". population.un.org. United Nations Department of Economic and Social Affairs, Population Division. Retrieved November 9, 2019.
- ""Overall total population" – World Population Prospects: The 2019 Revision" (xslx). population.un.org (custom data acquired via website). United Nations Department of Economic and Social Affairs, Population Division. Retrieved November 9, 2019.
- Population Division of the Department of Economic and Social Affairs of the United Nations Secretariat, World Population Prospects: The 2010 Revision
- "World Population Prospects - Population Division - United Nations". esa.un.org. Retrieved 2018-08-26.
- "Guinea-Bissau Population 2019", World Population Review
- "The World FactBook - Ghana", The World Factbook, July 12, 2018

- "Africa :: GUINEA-BISSAU". CIA The World Factbook.
| History |  | ||||
|---|---|---|---|---|---|
| Geography | |||||
| Politics |
| ||||
| Economy | |||||
| Society |
| ||||