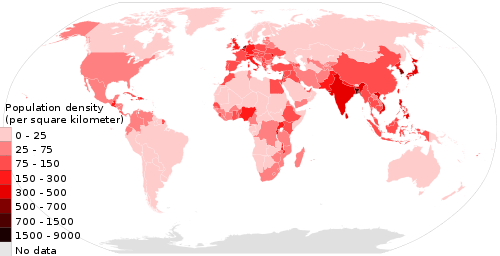
List of countries and dependencies by population density
This is a list of countries and dependent territories ranked by population density, measured by the number of human inhabitants per square kilometer, and also sortable by total area and by population.
The list includes sovereign states and self-governing dependent territories based upon the ISO standard ISO 3166-1. The list also includes but does not rank unrecognized but de facto independent countries. All 193 member states of the United Nations plus the Vatican City are given a rank number. The figures in the following table are based on areas including internal bodies of water such as bays, lakes, reservoirs and rivers.
The list does not include entities not on ISO 3166-1, except for states with limited recognition. Thus constituent countries that are not included on ISO 3166-1, and other entities not on ISO 3166-1 like the European Union, are not included.
Figures used in this article are mainly based on the latest censuses and official estimates or projections. Where these are unavailable, projections provided by the Population Division of the United Nations Department of Economic and Social Affairs are used.[1]
Main table
The names of dependent territories are shown in italics.
Area figures provided here have been obtained from the main articles of the respective countries and territories.
| Rank | Country (or dependent territory) | Area | Population | Density | Date | Population source | ||
|---|---|---|---|---|---|---|---|---|
| km2 | mi2 | pop./km2 | pop./mi2 | |||||
| – | 32.9 | 13 | 696,100 | 21,158.05 | 54,799 | September 30, 2019 | Official quarterly estimate | |
| 1 | 2.02 | 0.78 | 38,300 | 18,960.4 | 49,107 | December 31, 2018 | Official estimate | |
| 2 | 722.5 | 279 | 5,703,600 | 7,894.26 | 20,446 | July 1, 2019 | Official estimate | |
| – | 1,106 | 427 | 7,500,700 | 6,781.83 | 17,565 | December 31, 2019 | Official estimate | |
| – | 6.8 | 2.6 | 33,701 | 4,956.03 | 12,836 | July 1, 2019 | UN projection | |
| 3 | 778 | 300 | 1,543,300 | 1,982.91 | 5,136 | July 1, 2019 | Official annual projection | |
| 4 | 315 | 122 | 493,559 | 1,566.85 | 4,058 | July 10, 2019 | Official Estimate | |
| 5 | 298 | 115 | 374,775 | 1,257.63 | 3,257 | December 31, 2018 | Official estimate | |
| – | 52 | 20 | 64,027 | 1,226.52 | 3,177 | July 1, 2019 | Official Projection | |
| – | 34 | 13 | 42,876 | 1,261 | 3,266 | January 1, 2019 | Official estimate | |
| 6 | 143,998 | 55,598 | 168,872,634 | 1,173 | 3,037 | June 30, 2020 | Official population clock | |
| 7 | 0.49 | 0.19 | 453 | 924.49 | 2,394 | February 1, 2019 | Official estimate | |
| – | 116 | 45 | 104,200 | 898.28 | 2,327 | December 31, 2016 | Official estimate | |
| - | 6,020 | 2,324 | 4,976,684 | 826.69 | 2,141 | July 1, 2019 | Official projection | |
| – | 78 | 30 | 62,723 | 804.14 | 2,083 | March 31, 2016 | Official estimate | |
| – | 374 | 144 | 256,518 | 685.88 | 1,776 | September 5, 2017 | 2017 census result | |
| 8 | 10,452 | 4,036 | 6,855,713 | 672.06 | 1,741 | July 1, 2019 | UN projection | |
| 9 | 430 | 166 | 287,025 | 667.5 | 1,729 | July 1, 2019 | UN projection | |
| – | Saint Martin (France) | 53.2 | 21 | 35,107 | 659.91 | 1,709 | January 1, 2014 | Official estimate |
| – | 36,197 | 13,976 | 23,604,265 | 652.11 | 1,689 | January 31, 2020 | Monthly official estimate | |
| 10 | 2,040 | 788 | 1,265,577 | 620.38 | 1,607 | July 1, 2018 | Official estimate | |
| – | 180 | 69 | 112,309 | 624 | 1,616 | January 1, 2019 | Official estimate | |
| 11 | 61 | 24 | 34,641 | 567.89 | 1,471 | April 30, 2019 | Official monthly estimate | |
| 12 | 21 | 8 | 11,200 | 533.33 | 1,381 | July 1, 2020 | Annual projection | |
| 13 | 100,210 | 38,691 | 51,780,579 | 516.72 | 1,338 | July 1, 2020 | Official annual projection | |
| 14 | 26,338 | 10,169 | 12,374,397 | 469.83 | 1,217 | July 1, 2019 | Official projection | |
| 15 | 1,861 | 719 | 873,724 | 469.49 | 1,216 | July 1, 2019 | Official projection | |
| – | 21 | 8 | 9,427 | 448.9 | 1,163 | January 1, 2014 | Official estimate | |
| 16 | 41,526 | 16,033 | 17,482,181 | 421 | 1,090 | June 30, 2020 | Official population clock | |
| 17 | 22,072 | 8,522 | 9,216,070 | 418 | 1,081 | June 30, 2020 | Official population clock | |
| 18 | 27,065 | 10,450 | 11,263,077 | 416.15 | 1,078 | July 1, 2019 | UN projection | |
| 19 | 3,287,263 | 1,269,219 | 1,352,642,280 | 411.48 | 1,066 | January 1, 2019 | UN estimate [4][5] | |
| 20 | 27,816 | 10,740 | 11,215,578 | 403.21 | 1,044 | July 1, 2020 | Official annual projection | |
| 21 | 26 | 10 | 10,300 | 396.15 | 1,026 | July 1, 2020 | Annual projection | |
| 22 | 30,689 | 11,849 | 11,524,454 | 375.52 | 973 | January 1, 2020 | Official monthly estimate | |
| 23 | 300,000 | 115,831 | 108,829,500 | 363 | 940 | June 30, 2020 | Official population clock | |
| – | 444 | 171 | 158,665 | 357.35 | 926 | January 1, 2019 | Official Estimate | |
| – | 9,104 | 3,515 | 3,195,153 | 350.96 | 909 | July 1, 2018 | Official estimate | |
| – | 2,503.7 | 967 | 850,996 | 339.89 | 880 | January 1, 2016 | Official estimate | |
| 24 | 377,975 | 145,937 | 126,010,000 | 333.38 | 863 | February 1, 2020 | Monthly official estimate | |
| 25 | 65,610 | 25,332 | 21,803,000 | 332.31 | 861 | July 1, 2019 | Official estimate | |
| – | 1,128 | 436 | 371,246 | 329.12 | 852 | January 1, 2018 | Official estimate | |
| – | 541 | 209 | 175,200 | 323.84 | 839 | July 1, 2019 | Annual projection | |
| 26 | 21,040 | 8,124 | 6,704,864 | 318.67 | 825 | July 1, 2019 | Official annual projection | |
| 27 | 344 | 133 | 108,825 | 316.35 | 819 | July 1, 2019 | UN projection | |
| 28 | 181 | 70 | 55,900 | 308.84 | 800 | July 1, 2020 | Annual projection | |
| – | 352 | 136 | 104,909 | 298.04 | 772 | July 1, 2019 | UN projection | |
| 29 | 617 | 238 | 180,454 | 292.47 | 757 | July 1, 2019 | UN projection | |
| 30 | 331,212 | 127,882 | 96,208,984 | 290.48 | 752 | April 1, 2019 | Official annual projection | |
| – | 197 | 76 | 57,100 | 289.85 | 751 | July 1, 2020 | Annual projection | |
| 31 | 389 | 150 | 110,520 | 284.11 | 736 | July 1, 2018 | Official estimate | |
| 32 | 242,495 | 93,628 | 67,886,004 | 279.95 | 725 | May 11, 2020 | Population Division UN | |
| 33 | 803,940 | 310,403 | 220,127,520 | 274 | 709 | June 30, 2020 | Pakistan Bureau of Statistics | |
| 34 | 5,155 | 1,990 | 1,363,985 | 264.59 | 685 | July 1, 2019 | Official annual estimate | |
| – | 259 | 100 | 65,813 | 254.1 | 658 | December 31, 2018 | Official estimate | |
| 35 | 10,991 | 4,244 | 2,726,667 | 248.08 | 643 | December 31, 2018 | Official estimate | |
| 36 | 17,818 | 6,880 | 4,420,110 | 248.07 | 642 | January 1, 2019 | Official estimate | |
| – | Guadeloupe (France) | 1,628.4 | 629 | 395,725 | 243.01 | 629 | January 1, 2016 | Official estimate |
| 37 | 160 | 62 | 38,380 | 239.88 | 621 | December 31, 2018 | Official estimate | |
| 38 | 2,586 | 998 | 613,894 | 237.39 | 615 | January 1, 2019 | Official estimate | |
| 39 | 11,571 | 4,468 | 2,740,479 | 236.84 | 613 | May 31, 2019 | Official monthly estimate | |
| 40 | 442 | 171 | 104,084 | 235.48 | 610 | July 1, 2019 | UN projection | |
| 41 | 357,168 | 137,903 | 83,149,300 | 232.8 | 603 | September 30, 2019 | Official quarterly estimate | |
| 42 | 923,768 | 356,669 | 200,962,000 | 217.55 | 563 | July 1, 2019 | UN projection | |
| 43 | 47,875 | 18,485 | 10,358,320 | 216.36 | 560 | July 1, 2019 | Official projection | |
| – | 151 | 58 | 32,206 | 213.28 | 552 | July 1, 2019 | UN projection | |
| 44 | 455 | 176 | 96,762 | 212.66 | 551 | June 30, 2018 | Official estimate | |
| 45 | 120,540 | 46,541 | 25,450,000 | 211.13 | 547 | July 1, 2019 | UN projection | |
| 46 | 270 | 104 | 56,345 | 208.69 | 541 | July 1, 2019 | UN projection | |
| 47 | 10,690 | 4,127 | 2,228,075 | 208.43 | 540 | July 1, 2019 | UN projection | |
| 48 | 41,285 | 15,940 | 8,586,550 | 207.98 | 539 | September 30, 2019 | Official provisional figure | |
| 49 | 1,001 | 386 | 201,784 | 201.58 | 522 | July 1, 2018 | Official Estimate | |
| 50 | 147,516 | 56,956 | 29,609,623 | 200.72 | 520 | July 1, 2019 | Official annual projection | |
| 51 | 301,308 | 116,336 | 60,252,824 | 199.97 | 518 | August 31, 2019 | Monthly official estimate | |
| 52 | 241,551 | 93,263 | 40,006,700 | 165.62 | 429 | July 1, 2019 | Annual official estimate | |
| – | 10,910 | 4,212 | 1,795,666 | 164.59 | 426 | December 31, 2018 | Official estimate | |
| 53 | 464 | 179 | 76,177 | 164.17 | 425 | December 31, 2018 | Official estimate | |
| 54 | 108,889 | 42,042 | 17,679,735 | 162.36 | 421 | July 1, 2019 | Official annual projection | |
| 55 | 811 | 313 | 125,000 | 154.13 | 399 | July 1, 2020 | Annual projection | |
| – | 21 | 8 | 3,193 | 152.05 | 394 | July 1, 2015 | ||
| 56 | 701 | 271 | 105,600 | 150.64 | 390 | July 1, 2020 | Annual projection | |
| – | 13 | 5 | 1,947 | 149.77 | 388 | January 1, 2016 | ||
| 57 | 5,896 | 2,276 | 875,900 | 148.56 | 385 | December 31, 2018 | Official estimate | |
| 58 | 118,484 | 45,747 | 17,563,749 | 148.24 | 384 | September 3, 2018 | 2018 Census Result | |
| – | 572 | 221 | 83,314 | 145.65 | 377 | April 24, 2016 | 2016 census result | |
| 59 | 9,640,821 | 3,722,342 | 1,403,322,440 | 146 | 377 | June 30, 2020 | Official estimate | |
| 60 | 1,904,569 | 735,358 | 268,074,600 | 140.75 | 365 | July 1, 2019 | Official annual projection | |
| – | 10 | 4 | 1,400 | 140 | 363 | July 1, 2020 | Annual projection | |
| – | 96 | 37 | 13,452 | 140.13 | 363 | May 11, 2011 | Preliminary 2011 census result | |
| 61 | 720 | 278 | 100,000 | 138.89 | 360 | July 1, 2020 | Annual projection | |
| 62 | 4,033 | 1,557 | 550,483 | 136.49 | 354 | July 1, 2019 | Official annual projection | |
| 63 | 78,867 | 30,451 | 10,681,161 | 135.43 | 351 | September 30, 2019 | Official quarterly estimate | |
| 64 | 43,098 | 16,640 | 5,814,461 | 134.91 | 349 | July 1, 2019 | Official quarterly estimate | |
| 65 | 56,600 | 21,853 | 7,538,000 | 133.18 | 345 | July 1, 2019 | Official estimate | |
| 66 | 513,120 | 198,117 | 66,523,092 | 130 | 336 | June 30, 2020 | Official population clock | |
| 67 | 238,533 | 92,098 | 30,280,811 | 126.95 | 329 | July 1, 2019 | Official projection | |
| – | 457 | 176 | 56,600 | 123.85 | 321 | July 1, 2020 | Annual projection | |
| 68 | 543,965 | 210,026 | 67,060,000 | 123.28 | 319 | December 1, 2019 | Monthly official estimate | |
| 69 | 312,685 | 120,728 | 38,386,000 | 122.76 | 318 | June 30, 2019 | Official estimate | |
| 70 | 89,342 | 34,495 | 10,713,832 | 120 | 311 | June 30, 2020 | Official population clock | |
| 71 | 83,600 | 32,278 | 9,770,529 | 116.87 | 303 | July 1, 2019 | UN projection | |
| 72 | 86,600 | 33,436 | 10,067,108 | 116.25 | 301 | January 1, 2020 | Official publication | |
| – | 4,163 | 1,607 | 469,000 | 112.66 | 292 | January 1, 2018 | Official estimate | |
| 73 | 92,090 | 35,556 | 10,276,617 | 111.59 | 289 | December 31, 2018 | Official estimate | |
| 74 | 49,036 | 18,933 | 5,450,421 | 111.15 | 288 | December 31, 2018 | Official estimate | |
| 75 | 71,740 | 27,699 | 7,901,454 | 110.14 | 285 | July 1, 2019 | Official annual projection | |
| 76 | 83,879 | 32,386 | 8,902,600 | 106.14 | 275 | January 1, 2020 | Official quarterly estimate | |
| 77 | 783,562 | 302,535 | 83,154,997 | 106.12 | 275 | December 31, 2019 | Annual official estimate | |
| 78 | 93,029 | 35,919 | 9,764,000 | 104.96 | 272 | January 1, 2019 | Annual official estimate | |
| – | 3,355 | 1,295 | 351,965 | 104.91 | 272 | December 31, 2017 | Official estimate | |
| 79 | 112,622 | 43,484 | 11,733,059 | 104.18 | 270 | July 1, 2019 | Official annual projection | |
| 80 | 20,273 | 7,827 | 2,084,301 | 102.81 | 266 | January 1, 2019 | Official quarterly estimate | |
| 81 | 109,884 | 42,426 | 11,193,470 | 101.87 | 264 | December 31, 2019 | Official population estimate | |
| 82 | 1,063,652 | 410,678 | 107,534,882 | 101.1 | 262 | July 1, 2018 | UN projection | |
| 83 | 1,002,450 | 387,048 | 100,554,998 | 100 | 260 | June 30, 2020 | Official population clock | |
| 84 | 28,703 | 11,082 | 2,862,427 | 99.73 | 258 | January 1, 2019 | Official annual estimate | |
| 85 | 29,743 | 11,484 | 2,957,500 | 99.44 | 258 | September 30, 2019 | Official quarterly estimate | |
| 86 | 330,803 | 127,724 | 32,826,760 | 99 | 257 | June 30, 2020 | Official population clock | |
| 87 | 51,100 | 19,730 | 5,058,007 | 98.98 | 256 | June 30, 2019 | Official estimate | |
| 88 | 739 | 285 | 71,808 | 97.17 | 252 | July 1, 2019 | UN projection | |
| 89 | 505,990 | 195,364 | 46,934,632 | 92.76 | 240 | July 1, 2019 | Official estimate | |
| 90 | 185,180 | 71,498 | 17,070,135 | 92.18 | 239 | July 1, 2019 | UN projection | |
| 91 | 181,035 | 69,898 | 16,289,270 | 89.98 | 233 | July 1, 2019 | Official annual projection | |
| 92 | 438,317 | 169,235 | 39,309,783 | 89.68 | 232 | July 1, 2019 | UN projection- | |
| 93 | 77,474 | 29,913 | 6,901,188 | 89.08 | 231 | July 1, 2019 | Official estimate | |
| 94 | 196,722 | 75,955 | 16,209,125 | 82.4 | 213 | July 1, 2019 | Official projection | |
| 95 | 581,834 | 224,647 | 47,564,296 | 81.75 | 212 | August 31, 2019 | 2019 census result | |
| – | 142 | 55 | 11,600 | 81.69 | 212 | July 1, 2020 | Annual projection | |
| 96 | 112,492 | 43,433 | 9,158,345 | 81.41 | 211 | July 1, 2019 | Official projection | |
| 97 | 238,391 | 92,043 | 19,405,156 | 81.4 | 211 | January 1, 2019 | Official annual estimate | |
| 98 | 131,957 | 50,949 | 10,724,599 | 81.27 | 210 | January 1, 2019 | Official estimate | |
| 99 | 25,713 | 9,928 | 2,077,132 | 80.78 | 209 | December 31, 2018 | Official estimate | |
| 100 | 676,577 | 261,228 | 54,339,766 | 80.32 | 208 | July 1, 2019 | Official annual projection | |
| 101 | 446,550 | 172,414 | 35,942,525 | 80 | 208 | June 30, 2020 | Official population clock | |
| 102 | 322,921 | 124,680 | 25,823,071 | 79.97 | 207 | January 1, 2019 | Official projection | |
| – | 3,521 | 1,359 | 280,600 | 79.69 | 206 | July 1, 2020 | Annual projection | |
| 103 | 33,843 | 13,067 | 2,681,735 | 79.24 | 205 | January 1, 2019 | Official estimate | |
| 104 | 14,919 | 5,760 | 1,167,242 | 78.24 | 203 | July 11, 2015 | Preliminary 2015 census result | |
| – | 497 | 192 | 37,910 | 76.28 | 198 | July 1, 2016 | Official estimate | |
| 105 | 270,764 | 104,543 | 20,244,080 | 74.77 | 194 | July 1, 2018 | Annual official projection | |
| 106 | 30,355 | 11,720 | 2,263,010 | 74.55 | 193 | July 1, 2018 | UN projection | |
| 107 | 5,765 | 2,226 | 421,300 | 73.08 | 189 | July 1, 2017 | Official estimate | |
| 108 | 447,400 | 172,742 | 32,653,900 | 72.99 | 189 | January 1, 2018 | Official estimate | |
| 109 | 56,542 | 21,831 | 4,087,843 | 72.3 | 187 | July 1, 2018 | Annual official estimate | |
| 110 | 163,610 | 63,170 | 11,722,038 | 71.65 | 186 | July 1, 2019 | Official estimate | |
| 111 | 2,831 | 1,093 | 199,300 | 70.4 | 182 | July 1, 2020 | Annual projection | |
| 112 | 70,273 | 27,133 | 4,921,500 | 70.03 | 181 | April 1, 2019 | Official annual estimate | |
| 113 | 603,000 | 232,820 | 41,902,416 | 69.49 | 180 | January 1, 2020 | Official monthly estimate | |
| 114 | 51,209 | 19,772 | 3,511,372 | 68.57 | 178 | July 1, 2016 | Official estimate | |
| 115 | 17,364 | 6,704 | 1,159,250 | 66.76 | 173 | July 1, 2018 | Official projection | |
| – | 288 | 111 | 18,905 | 65.64 | 170 | December 31, 2014 | ||
| 116 | 455,000 | 175,676 | 28,915,284 | 63.55 | 165 | July 1, 2018 | UN projection | |
| 117 | 1,967,138 | 759,516 | 126,577,691 | 64.35 | 167 | July 1, 2019 | Official estimate | |
| – | 237 | 92 | 15,250 | 64.35 | 167 | July 1, 2020 | Annual projection | |
| 118 | 143,100 | 55,251 | 9,127,000 | 63.78 | 165 | January 1, 2019 | Official estimate | |
| 119 | 111,002 | 42,858 | 7,000,039 | 63.06 | 163 | December 31, 2018 | Official annual estimate | |
| 120 | 276,841 | 106,889 | 17,516,888 | 63 | 164 | June 30, 2020 | Official projection | |
| 121 | 945,087 | 364,900 | 55,890,747 | 59.14 | 153 | July 1, 2019 | Official annual projection | |
| • | World (land only, excluding Antarctica) | 134,940,000 | 52,100,000 | 7,795,914,000 | 57.77 | 150 | June 30, 2020 | USCB's world population clock |
| 122 | 74,177 | 28,640 | 4,158,783 | 56.07 | 145 | July 1, 2018 | Official projection | |
| 123 | 69,700 | 26,911 | 3,729,600 | 53.51 | 139 | January 1, 2018 | Official estimate | |
| 124 | 121,428 | 46,884 | 6,393,824 | 52.66 | 136 | July 1, 2017 | Official estimate | |
| • | World (land only) | 148,940,000 | 57,510,000 | 7,795,914,000 | 52.34 | 136 | June 30, 2020 | USCB's World population clock |
| 125 | 466,050 | 179,943 | 24,348,251 | 52.24 | 135 | July 1, 2019 | Official projection | |
| 126 | 1,648,195 | 636,372 | 83,573,873 | 51 | 131 | June 30, 2020 | Official population clock | |
| – | 35 | 14 | 1,748 | 49.94 | 129 | August 9, 2016 | census result | |
| 127 | 245,857 | 94,926 | 12,218,357 | 49.7 | 129 | July 1, 2019 | official projection | |
| 128 | 645,807 | 249,347 | 31,575,018 | 48.89 | 127 | July 1, 2018 | Official estimate | |
| 129 | 18,333 | 7,078 | 884,887 | 48.27 | 125 | September 17, 2017 | Official census result | |
| – | 102 | 39 | 4,922 | 48.25 | 125 | May 12, 2011 | 2011 census result | |
| 130 | 28,051 | 10,831 | 1,358,276 | 48.42 | 125 | July 1, 2018 | Official estimate | |
| 131 | 1,220,813 | 471,359 | 58,775,022 | 48.14 | 125 | July 1, 2019 | Official estimate | |
| 132 | 23,000 | 8,880 | 1,078,373 | 46.89 | 121 | July 1, 2019 | Official projection | |
| 133 | 97,036 | 37,466 | 4,475,353 | 46.12 | 119 | July 1, 2019 | Official projection | |
| 134 | 207,600 | 80,155 | 9,397,800 | 45.59 | 118 | April 1, 2020 | Quarterly official estimate | |
| 135 | 13,812 | 5,333 | 622,182 | 45.05 | 117 | January 1, 2019 | Official estimate | |
| 136 | 36,125 | 13,948 | 1,604,528 | 44.42 | 115 | July 1, 2019 | Official annual projection | |
| 137 | 587,041 | 226,658 | 25,680,342 | 43.75 | 113 | May 18, 2018 | Official Census | |
| 138 | 65,300 | 25,212 | 2,793,466 | 42.78 | 111 | November 1, 2019 | Monthly official estimate | |
| 139 | 1,141,748 | 440,831 | 46,348,400 | 41 | 105 | June 30, 2020 | Official population clock | |
| 140 | 444 | 171 | 17,900 | 40.32 | 104 | July 1, 2018 | Official estimate | |
| – | 14 | 5 | 544 | 38.86 | 101 | August 9, 2016 | census result | |
| 141 | 390,757 | 150,872 | 15,159,624 | 38.8 | 100 | July 1, 2019 | Official annual projection | |
| 142 | 2,345,095 | 905,446 | 86,790,567 | 37.01 | 96 | July 1, 2019 | UN projection | |
| 143 | 799,380 | 308,642 | 28,571,310 | 35.74 | 93 | July 1, 2019 | Official projection | |
| 144 | 916,445 | 353,841 | 32,219,521 | 35.16 | 91 | July 1, 2019 | Official annual projection | |
| – | 1,399 | 540 | 50,844 | 34.48 | 89 | May 1, 2018 | Official monthly estimate | |
| 145 | 9,833,517 | 3,796,742 | 329,952,186 | 34 | 87 | June 30, 2020 | Official population clock | |
| 146 | 199,945 | 77,199 | 6,309,300 | 31.56 | 82 | June 1, 2018 | Official estimate | |
| 147 | 64,562 | 24,928 | 1,910,400 | 29.59 | 77 | October 1, 2019 | Official monthly estimate | |
| 148 | 45,339 | 17,505 | 1,324,820 | 29.22 | 76 | January 1, 2019 | Official estimate | |
| 149 | 121,100 | 46,757 | 3,497,117 | 28.88 | 75 | July 1, 2019 | UN projection | |
| – | 8,660 | 3,344 | 243,206 | 28.08 | 73 | April 27, 2018 | ||
| 150 | 13,940 | 5,382 | 386,870 | 27.75 | 72 | July 1, 2018 | Official projection | |
| 151 | 236,800 | 91,429 | 6,492,400 | 27.42 | 71 | March 1, 2015 | Preliminary 2015 census result | |
| – | 242 | 2,605 | 6,081 | 25.13 | 65 | January 1, 2010 | Official estimate | |
| 152 | 1,285,216 | 496,225 | 32,162,184 | 25.02 | 65 | July 1, 2018 | Official estimate | |
| 153 | 8,515,767 | 3,287,956 | 211,729,470 | 25 | 64 | June 30, 2020 | Official population clock | |
| 154 | 12,281 | 4,742 | 304,500 | 24.79 | 64 | July 1, 2018 | Official estimate | |
| 155 | 28,370 | 10,954 | 682,500 | 24.06 | 62 | July 1, 2018 | Official estimate | |
| 156 | 637,657 | 246,201 | 15,181,925 | 23.81 | 62 | July 1, 2018 | UN projection | |
| 157 | 1,246,700 | 481,354 | 29,250,009 | 23.46 | 61 | January 1, 2018 | Official estimate | |
| 158 | 756,096 | 291,930 | 17,373,831 | 22.98 | 60 | August 31, 2017 | Preliminary 2017 census result | |
| 159 | 450,295 | 173,860 | 10,343,403 | 22.97 | 59 | April 1, 2020 | Official quarterly estimate | |
| 160 | 1,839,542 | 710,251 | 40,782,742 | 22.17 | 57 | July 1, 2017 | Official annual projection | |
| 161 | 752,612 | 290,585 | 16,405,229 | 21.8 | 56 | July 1, 2017 | Official annual projection | |
| 162 | 38,394 | 14,824 | 827,892 | 21.56 | 55.85 | June 30, 2020 | Official population clock | |
| 163 | 176,215 | 68,037 | 3,518,553 | 19.97 | 52 | June 30, 2019 | Official annual projection | |
| – | 176,120 | 68,000 | 3,508,180 | 19.92 | 52 | August 17, 2017 | ||
| 164 | 644,329 | 248,777 | 12,778,250 | 19.83 | 51 | July 1, 2019 | Official annual projection | |
| – | 1,552 | 599 | 29,789 | 19.19 | 50 | December 31, 2018 | Official estimate | |
| 165 | 462,840 | 178,704 | 8,935,000 | 19.3 | 50 | July 1, 2020 | Annual official estimate | |
| 166 | 270,467 | 104,428 | 5,008,365 | 19 | 48 | June 30, 2020 | Official population clock | |
| 167 | 1,186,408 | 458,075 | 22,314,743 | 18.81 | 49 | July 1, 2019 | Official annual projection | |
| 168 | 2,381,741 | 919,595 | 43,000,000 | 18.05 | 47 | January 1, 2019 | Official projection | |
| 169 | 22,965 | 8,867 | 398,050 | 17.33 | 45 | July 1, 2018 | Official annual estimate | |
| 170 | 406,752 | 157,048 | 7,052,983 | 17.1 | 44 | July 1, 2018 | Official projection | |
| 171 | 323,808 | 125,023 | 5,367,580 | 16.58 | 43 | January 1, 2020 | Official quarterly estimate | |
| 172 | 338,424 | 130,666 | 5,527,405 | 16.33 | 42 | December 20, 2019 | Official monthly estimate | |
| 173 | 2,780,400 | 1,073,518 | 44,938,712 | 16.16 | 42 | July 1, 2019 | Annual official estimate | |
| 174 | 2,149,690 | 830,000 | 34,218,169 | 15.92 | 41 | January 1, 2019 | Annual official estimate | |
| 175 | 342,000 | 132,047 | 5,399,895 | 15.79 | 41 | July 1, 2018 | UN projection | |
| 176 | 1,248,574 | 482,077 | 19,107,706 | 15.3 | 40 | July 1, 2018 | UN projection | |
| – | 137 | 53 | 2,072 | 15.12 | 39 | August 9, 2011 | 2011 census result | |
| 177 | 309,500 | 119,499 | 4,645,249 | 15.01 | 39 | April 1, 2020 | Official quarterly estimate | |
| – | 394 | 152 | 5,633 | 14.3 | 37 | February 7, 2016 | 2016 census result | |
| – | 18,575 | 7,172 | 258,958 | 13.94 | 36 | July 1, 2013 | Official estimate | |
| – | 3,900 | 1,506 | 53,532 | 13.73 | 36 | August 11, 2016 | ||
| – | 11,458 | 4,424 | 150,932 | 13.17 | 34 | October 14, 2015 | ||
| 178 | 1,284,000 | 495,755 | 15,353,184 | 11.96 | 31 | July 1, 2018 | UN projection | |
| 179 | 491,210 | 189,657 | 5,851,466 | 11.91 | 31 | July 1, 2018 | UN projection | |
| 180 | 1,098,581 | 424,164 | 11,307,314 | 10.29 | 27 | July 1, 2018 | Official projection | |
| 181 | 17,125,242 | 6,612,093 | 146,877,088 | 8.58 | 22 | January 1, 2018 | Official estimate | |
| 182 | 267,667 | 103,347 | 2,067,561 | 7.72 | 20 | July 1, 2018 | UN projection | |
| 183 | 622,436 | 240,324 | 4,737,423 | 7.61 | 20 | July 1, 2018 | UN projection | |
| 184 | 2,724,900 | 1,052,090 | 18,592,700 | 6.69 | 17 | January 4, 2020 | Official monthly estimate | |
| – | 261 | 101 | 1,613 | 6.18 | 16 | September 10, 2011 | Final 2011 census result | |
| 185 | 9,984,670 | 3,855,103 | 38,083,197 | 4 | 10 | June 30, 2020 | Official estimate | |
| 186 | 581,730 | 224,607 | 2,302,878 | 3.96 | 10.3 | July 1, 2018 | Official projection | |
| 187 | 1,030,700 | 397,955 | 3,984,233 | 3.87 | 10.0 | July 1, 2018 | Official projection | |
| 188 | 1,770,060 | 683,424 | 6,470,956 | 3.66 | 9.5 | July 1, 2018 | UN projection | |
| 189 | 214,999 | 83,012 | 782,225 | 3.64 | 9.4 | July 1, 2018 | UN projection | |
| 190 | 102,775 | 39,682 | 366,130 | 3.56 | 9.2 | March 31, 2020 | Official quarterly estimate | |
| 191 | 163,820 | 63,251 | 568,301 | 3.47 | 9.0 | July 1, 2018 | UN projection | |
| 192 | 7,692,024 | 2,969,907 | 25,756,880 | 3 | 9 | June 30, 2020 | Official estimate | |
| 193 | 825,118 | 318,580 | 2,413,643 | 2.93 | 7.6 | July 1, 2018 | Official projection | |
| – | 86,504 | 33,399 | 244,118 | 2.82 | 7.3 | July 1, 2013 | Official estimate | |
| – | 252,120 | 97,344 | 567,421 | 2.25 | 5.8 | July 1, 2018 | UN projection | |
| 194 | 1,564,100 | 603,902 | 3,238,479 | 2.07 | 5.4 | December 31, 2018 | Official estimate | |
| – | 47.3 | 18 | 56 | 1.19 | 3.1 | September 20, 2016 | 2013 census result | |
| – | 12,173 | 4,700 | 2,563 | 0.21 | 0.54 | April 15, 2012 | 2012 census result | |
| – | 61,399 | 23,706 | 2,655 | 0.04 | 0.10 | September 1, 2012 | Official estimate | |
| – | 2,166,000 | 836,297 | 55,877 | 0.03 | 0.08 | January 1, 2018 | Official estimate | |
| Rank | Country (or dependent territory) | km2 | mi2 | Population | pop./km2 | pop./mi2 | Date | Population source |
| Area | Density | |||||||
Density of the most populous countries
This list consists of the top 100 most populous countries (see also List of countries and dependencies by population).
| Rank | Country (or dependent territory) | Area | Population | Density | Date | Population source | ||
|---|---|---|---|---|---|---|---|---|
| km2 | mi2 | pop./km2 | pop./mi2 | |||||
| 1 | 143,998 | 55,598 | 168,872,634 | 1,173 | 3,037 | June 30, 2020 | Official population clock | |
| - | 36,197 | 13,976 | 23,604,265 | 652 | 1,689 | January 31, 2020 | Monthly official estimate | |
| 2 | 100,210 | 38,691 | 51,780,579 | 517 | 1,339 | July 1, 2020 | Official Annual projection | |
| 3 | 26,338 | 10,169 | 12,374,397 | 470 | 1,217 | July 1, 2019 | Official projection | |
| 4 | 41,526 | 16,033 | 17,482,181 | 421 | 1,090 | June 30, 2020 | Official population clock | |
| 5 | 22,072 | 8,522 | 9,216,070 | 418 | 1,081 | June 30, 2020 | Official population clock | |
| 6 | 27,065 | 10,450 | 11,263,077 | 416 | 1,077 | July 1, 2019 | UN projection | |
| 7 | 3,287,240 | 1,269,211 | 1,364,120,059 | 415 | 1,075 | June 30, 2020 | Template:NSSO , India | |
| 8 | 27,816 | 10,740 | 11,215,578 | 403 | 1,044 | July 1, 2020 | Official annual projection | |
| 9 | 30,528 | 11,787 | 11,524,454 | 376 | 974 | January 1, 2020 | Official monthly estimate | |
| 10 | 300,000 | 115,831 | 108,829,500 | 363 | 940 | June 30, 2020 | Official population clock | |
| 11 | 377,975 | 145,937 | 126,010,000 | 333 | 862 | February 1, 2020 | Official monthly estimate | |
| 12 | 65,610 | 25,332 | 21,881,913 | 332 | 860 | July 1, 2019 | Official estimate | |
| 13 | 331,212 | 127,882 | 96,208,984 | 290 | 751 | April 1, 2019 | Official annual projection | |
| 14 | 242,495 | 93,628 | 67,886,004 | 280 | 725 | May 11, 2020 | Population Division UN | |
| 15 | 803,940 | 310,403 | 220,127,520 | 274 | 709 | June 30, 2020 | Pakistan Bureau of Statistics | |
| 16 | 357,168 | 137,903 | 83,149,300 | 233 | 603 | September 30, 2019 | Official quarterly estimate | |
| 17 | 923,768 | 356,669 | 200,962,000 | 218 | 565 | July 1, 2019 | UN projection | |
| 18 | 47,875 | 18,485 | 10,358,320 | 216 | 559 | July 1, 2019 | Official projection | |
| 19 | 122,762 | 47,399 | 25,450,000 | 211 | 546 | July 1, 2019 | UN projection | |
| 20 | 41,285 | 15,940 | 8,586,550 | 208 | 539 | September 30, 2019 | Official provisional figure | |
| 21 | 147,181 | 56,827 | 29,609,623 | 201 | 521 | July 1, 2019 | Official annual projection | |
| 22 | 301,308 | 116,336 | 60,252,824 | 200 | 518 | August 31, 2019 | Monthly official estimate | |
| 23 | 241,551 | 93,263 | 40,006,700 | 166 | 430 | July 1, 2019 | Annual official estimate | |
| 24 | 108,889 | 42,042 | 17,679,735 | 162 | 420 | July 1, 2019 | Official annual projection | |
| 25 | 118,484 | 45,747 | 17,563,749 | 148 | 383 | September 3, 2018 | 2018 Census Result | |
| 26 | 9,640,821 | 3,722,342 | 1,403,322,440 | 146 | 377 | June 30, 2020 | Official estimate | |
| 27 | 1,904,569 | 735,358 | 268,074,600 | 141 | 365 | July 1, 2019 | Official annual projection | |
| 28 | 78,867 | 30,451 | 10,681,161 | 135 | 350 | September 30, 2019 | Official quarterly estimate | |
| 29 | 56,600 | 21,853 | 7,538,000 | 133 | 344 | July 1, 2019 | Official estimate | |
| 30 | 513,120 | 198,117 | 66,523,092 | 130 | 336 | June 30, 2020 | Official population clock | |
| 31 | 238,533 | 92,098 | 30,280,811 | 127 | 329 | July 1, 2019 | Official projection | |
| 32 | 543,965 | 210,026 | 67,060,000 | 123 | 319 | December 1, 2019 | Monthly official estimate | |
| 33 | 312,685 | 120,728 | 38,386,000 | 123 | 319 | June 30, 2019 | Official estimate | |
| 34 | 89,342 | 34,495 | 10,713,832 | 120 | 311 | June 30, 2020 | Official population clock | |
| 35 | 83,600 | 32,278 | 9,770,529 | 117 | 303 | July 1, 2019 | UN projection | |
| 36 | 86,600 | 33,436 | 10,067,108 | 116 | 300 | January 1, 2020 | Official publication | |
| 37 | 92,090 | 35,556 | 10,276,617 | 112 | 290 | December 31, 2018 | Official estimate | |
| 38 | 83,879 | 32,386 | 8,902,600 | 106 | 275 | January 1, 2020 | Official quarterly estimate | |
| 39 | 783,562 | 302,535 | 83,154,997 | 106 | 275 | December 31, 2019 | Annual official estimate | |
| 40 | 93,029 | 35,919 | 9,764,000 | 105 | 272 | January 1, 2019 | Annual official estimate | |
| 41 | 109,886 | 42,427 | 11,209,628 | 102 | 264 | December 31, 2018 | Official annual estimate | |
| 42 | 1,063,652 | 410,678 | 107,534,882 | 101 | 262 | July 1, 2018 | UN projection | |
| 43 | 112,622 | 43,484 | 11,362,269 | 101 | 262 | July 1, 2018 | Official projection | |
| 44 | 1,002,450 | 387,048 | 100,554,998 | 100 | 260 | June 30, 2020 | Official population clock | |
| 45 | 330,803 | 127,724 | 32,826,760 | 99 | 257 | June 30, 2020 | Official population clock | |
| 46 | 503,783 | 194,512 | 46,934,632 | 93 | 241 | July 1, 2019 | Official estimate | |
| 47 | 185,180 | 71,498 | 17,070,135 | 92 | 238 | July 1, 2019 | UN estimate | |
| 48 | 181,035 | 69,898 | 16,289,270 | 90 | 233 | July 1, 2019 | Official annual projection | |
| 49 | 438,317 | 169,235 | 39,309,783 | 90 | 233 | July 1, 2019 | UN projection | |
| 50 | 581,834 | 224,647 | 47,564,296 | 82 | 212 | August 31, 2019 | 2019 census result | |
| 51 | 196,722 | 75,955 | 16,209,125 | 82 | 212 | July 1, 2019 | Official estimate | |
| 52 | 238,391 | 92,043 | 19,405,156 | 81 | 210 | January 1, 2019 | Official annual estimate | |
| 53 | 131,957 | 50,949 | 10,724,599 | 81 | 210 | January 1, 2019 | Official estimate | |
| 54 | 112,088 | 43,277 | 9,158,345 | 81 | 210 | July 1, 2019 | Official projection | |
| 55 | 676,577 | 261,228 | 54,339,766 | 80 | 207 | July 1, 2019 | Official annual projection | |
| 56 | 322,921 | 124,680 | 25,823,071 | 80 | 207 | January 1, 2019 | Official projection | |
| 57 | 446,550 | 172,414 | 35,942,525 | 80 | 208 | June 30, 2020 | Official population clock | |
| 58 | 270,764 | 104,543 | 19,632,147 | 73 | 189 | July 1, 2017 | Annual official projection | |
| 59 | 447,400 | 172,742 | 32,653,900 | 73 | 189 | January 1, 2018 | Official estimate | |
| 60 | 163,610 | 63,170 | 11,722,038 | 72 | 186 | July 1, 2019 | Official estimate | |
| 61 | 603,000 | 232,820 | 41,902,416 | 69 | 179 | January 1, 2020 | Official monthly estimate | |
| 62 | 455,000 | 175,676 | 28,915,284 | 64 | 166 | July 1, 2018 | UN projection | |
| 63 | 1,967,138 | 759,516 | 126,577,691 | 64 | 166 | July 1, 2019 | Official estimate | |
| 64 | 143,100 | 55,251 | 9,127,000 | 64 | 166 | January 1, 2019 | Official estimate | |
| 65 | 276,841 | 106,889 | 17,516,888 | 63 | 164 | June 30, 2020 | Official projection | |
| 66 | 945,087 | 364,900 | 55,890,747 | 59 | 153 | July 1, 2019 | Official annual projection | |
| 67 | 466,050 | 179,943 | 24,348,251 | 52 | 135 | July 1, 2019 | Official projection | |
| 68 | 1,648,195 | 636,372 | 83,573,873 | 51 | 131 | June 30, 2020 | Official population clock | |
| 69 | 245,857 | 94,926 | 12,218,357 | 50 | 129 | July 1, 2019 | official projection | |
| 70 | 645,807 | 249,347 | 31,575,018 | 49 | 127 | July 1, 2018 | Official estimate | |
| 71 | 1,220,813 | 471,359 | 58,775,022 | 48 | 124 | July 1, 2019 | Official estimate | |
| 72 | 207,600 | 80,155 | 9,465,300 | 46 | 119 | April 1, 2019 | Quarterly official estimate | |
| 73 | 587,041 | 226,658 | 25,680,342 | 44 | 114 | May 18, 2018 | Official Census | |
| 74 | 1,141,748 | 440,831 | 46,348,400 | 41 | 105 | June 30, 2020 | Official population clock | |
| 75 | 390,757 | 150,872 | 15,159,624 | 39 | 101 | July 1, 2019 | Official annual projection | |
| 76 | 2,345,095 | 905,446 | 86,790,567 | 37 | 96 | July 1, 2019 | UN projection | |
| 77 | 799,380 | 308,642 | 28,571,310 | 36 | 93 | July 1, 2019 | Official projection | |
| 78 | 916,445 | 353,841 | 32,219,521 | 35 | 91 | July 1, 2019 | Official annual projection | |
| 79 | 9,833,517 | 3,796,742 | 329,952,186 | 34 | 87 | June 30, 2020 | Official population clock | |
| 80 | 1,285,216 | 496,225 | 32,162,184 | 25 | 65 | July 1, 2018 | Official estimate | |
| 81 | 8,515,767 | 3,287,956 | 211,729,470 | 25 | 64 | June 30, 2020 | Official population clock | |
| 82 | 637,657 | 246,201 | 15,181,925 | 24 | 62 | July 1, 2018 | UN projection | |
| 83 | 1,246,700 | 481,354 | 29,250,009 | 23 | 60 | January 1, 2018 | Official estimate | |
| 84 | 756,096 | 291,930 | 17,373,831 | 23 | 60 | August 31, 2017 | Preliminary 2017 census result | |
| 85 | 450,295 | 173,860 | 10,396,905 | 23 | 60 | June 30, 2020 | Official population clock | |
| 86 | 752,612 | 290,585 | 16,405,229 | 22 | 57 | July 1, 2017 | Official annual projection | |
| 87 | 1,839,542 | 710,251 | 40,782,742 | 22 | 57 | July 1, 2017 | Official annual projection | |
| 88 | 644,329 | 248,777 | 12,778,250 | 20 | 52 | July 1, 2019 | Official annual projection | |
| 89 | 1,186,408 | 458,075 | 22,314,743 | 19 | 49 | July 1, 2019 | Official annual projection | |
| 90 | 462,840 | 178,704 | 8,935,000 | 19 | 49 | July 1, 2020 | Annual official estimate | |
| 91 | 2,381,741 | 919,595 | 43,000,000 | 18 | 47 | January 1, 2019 | Official projection | |
| 92 | 2,780,400 | 1,073,518 | 44,938,712 | 16 | 41 | July 1, 2019 | Annual official estimate | |
| 93 | 2,149,690 | 830,000 | 34,218,169 | 16 | 41 | January 1, 2019 | Annual official estimate | |
| 94 | 1,248,574 | 482,077 | 19,107,706 | 15 | 39 | July 1, 2018 | UN projection | |
| 95 | 1,284,000 | 495,755 | 15,353,184 | 12 | 31 | July 1, 2018 | UN projection | |
| 96 | 1,098,581 | 424,164 | 11,307,314 | 10 | 26 | July 1, 2018 | Official projection | |
| 97 | 17,125,242 | 6,612,093 | 146,877,088 | 9 | 23 | January 1, 2018 | Official estimate | |
| 98 | 2,724,900 | 1,052,090 | 18,232,000 | 7 | 18 | May 1, 2018 | Official monthly estimate | |
| 99 | 9,984,670 | 3,855,103 | 38,083,197 | 4 | 10 | June 30, 2020 | Official estimate | |
| 100 | 7,692,024 | 2,969,907 | 25,756,880 | 3 | 9 | June 30, 2020 | Official estimate | |
| Rank | Country (or dependent territory) | km2 | mi2 | Population | pop./km2 | pop./mi2 | Date | Population source |
| Area | Density | |||||||
See also
- List of countries and dependencies by area - with also land and water area separately
- List of countries by past and future population density
- List of countries by real population density based on food growing capacity
- Human overpopulation
- By region
- Population density of Asian countries
- List of African countries by population density
- List of sovereign states and dependent territories in North America by population density
- List of sovereign states and dependent territories in South America by population density
- List of the European Union members by density
- Area and population of European countries
- Population density of countries in Oceania
- Cities
- Other
Notes
- The De Agostini Atlas Calendar listed the area of Vatican City as 0.44 km2 in its 1930 edition[2] but corrected it to 0.49 km2 in its 1945–46 edition.[3] The figure of 0.44 km2 is still widely cited by many sources despite its inaccuracy.
In 2019, the total population was 825, consisting of 453 residents and 372 nonresident citizens. For calculating the population density, only residents are considered. - Kosovo is the subject of a territorial dispute between the Republic of Kosovo and the Republic of Serbia. The Republic of Kosovo unilaterally declared independence on 17 February 2008, but Serbia continues to claim it as part of its own sovereign territory. The two governments began to normalise relations in 2013, as part of the 2013 Brussels Agreement. Kosovo is currently recognized as an independent state by 97 out of the 193 United Nations member states. In total, 112 UN member states recognized Kosovo at some point, of which 15 later withdrew their recognition.
- Not recognized by any UN member states
- Recognized only by Turkey
- Excludes Crimea.
- Recognized by only 6 UN member states
- File: "Población por región, sexo y edad simple, 1996-2025". Implied data: 3,003,671 in urban areas; 351,196 in smaller towns; 163,686 rural. Total 2019: 3,518,553
- Not recognized by any UN member states
- Recognized by only 5 UN members states
- Not recognized by any UN member states
- Including the population and area of Autonomous Republic of Crimea and City of Sevastopol, Ukraine's administrative areas on the Crimean Peninsula which are claimed by Russia.
- Administration is split between Morocco and the Sahrawi Arab Democratic Republic, both of which claim the entire territory.
- Excludes Crimea.
- Including the population and area of Autonomous Republic of Crimea and City of Sevastopol, Ukraine's administrative areas on the Crimean Peninsula which are claimed by Russia.
References
- "World Population Prospects". Archived from the original on 2016-09-19. Retrieved 2016-10-26.
- De Agostini Atlas Calendar, 1930, p. 99. (in Italian)
- De Agostini Atlas Calendar, 1945–46, p. 128. (in Italian)
- ""World Population prospects – Population division"". population.un.org. United Nations Department of Economic and Social Affairs, Population Division. Retrieved November 9, 2019.
- ""Overall total population" – World Population Prospects: The 2019 Revision" (xslx). population.un.org (custom data acquired via website). United Nations Department of Economic and Social Affairs, Population Division. Retrieved November 9, 2019.