Demographics of Venezuela
The Demographics of Venezuela are the condition and overview of Venezuela's peoples. Demographic topics include basic education, health, and population statistics as well as identified racial and religious affiliations
The Venezuelan people comprise a combination of heritages. The historically present Amerindians, Spanish colonists, and African slaves have all contributed to varying degrees. Later, waves of European groups (Italians, Spanish, Portuguese and Germans) migrated to Venezuela in the 20th century, influencing many aspects of Venezuelan life, including its culture, language, food, and music.
About 51.6% of the population is mixed (mestizo) white, amerindian and black in Venezuela, while 43.6% are white of recent European and/or Middle Eastern ancestry. Another 3.7% is fully black/African, while 2.7% is of full Amerindian ancestry, and 1.0% other races (mainly Asians).[1][2]
Three Amerindian tribes located in the country are the Wayuu, located in the west, in Zulia State, and the Timoto-cuicas, also in the west, in Mérida State, in the Andes.
About 85% of the population live in urban areas in the northern portion of the country and currently resides in the urban conglomerations (Caracas, Maracay, Maracaibo, Valencia, etc.) that are concentrated in Venezuela's northern coastal mountain strip. Nearly half of Venezuela's geographic area lies south of the Orinoco River; however, this region contains only 5% of the Venezuelan population.
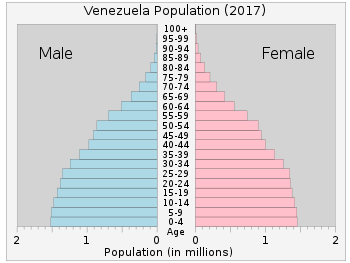
The 2019 revision of the World Population Prospects[3][4] estimate puts Venezuela's total population at 28,887,118 inhabitants.[3][4] Additionally, over the past five years, Venezuelan society's general age structure has been trending towards the homologous structure found in Cuba, Western Europe, Japan, and other healthy and rapidly aging societies. Notably, there has been a significant increase in the proportion and gross numbers of elderly Venezuelans (aged 65 and up), as well as a corresponding drop in the total fertility.
Population
| Census population | ||
|---|---|---|
| Year | Pop. | ±% |
| 1873 | 1,732,411 | — |
| 1881 | 2,005,139 | +15.7% |
| 1891 | 2,221,572 | +10.8% |
| 1920 | 2,479,525 | +11.6% |
| 1926 | 2,814,131 | +13.5% |
| 1936 | 3,364,347 | +19.6% |
| 1941 | 3,850,771 | +14.5% |
| 1950 | 5,034,838 | +30.7% |
| 1961 | 7,523,999 | +49.4% |
| 1971 | 10,721,522 | +42.5% |
| 1981 | 14,516,735 | +35.4% |
| 1990 | 18,105,265 | +24.7% |
| 2001 | 23,232,553 | +28.3% |
| 2011 | 27,722,793 | +19.3% |
According to the 2019 revision of the World Population Prospects[3][4] the total population was 28,887,118 in 2018, compared to only 5,482,000 in 1950. The proportion of children below the age of 15 in 2010 was 29.5%, 64.9% was between 15 and 65 years of age, while 5.6% was 65 years or older .[5]
| Total population | Proportion aged 0–14 (%) |
Proportion aged 15–64 (%) |
Proportion aged 65+ (%) | |
|---|---|---|---|---|
| 1950 | 5 482 000 | 43.5 | 54.6 | 1.9 |
| 1955 | 6 758 000 | 44.8 | 53.1 | 2.0 |
| 1960 | 8 147 000 | 45.6 | 51.9 | 2.4 |
| 1965 | 9 825 000 | 46.4 | 51.0 | 2.6 |
| 1970 | 11 588 000 | 45.7 | 51.5 | 2.8 |
| 1975 | 13 361 000 | 43.3 | 53.6 | 3.0 |
| 1980 | 15 344 000 | 40.7 | 56.2 | 3.2 |
| 1985 | 17 508 000 | 38.8 | 57.8 | 3.4 |
| 1990 | 19 862 000 | 37.9 | 58.4 | 3.7 |
| 1995 | 22 189 000 | 36.3 | 59.8 | 3.9 |
| 2000 | 24 481 000 | 34.1 | 61.6 | 4.3 |
| 2005 | 26 769 000 | 31.6 | 63.5 | 4.9 |
| 2010 | 28 996 000 | 29.6 | 64.9 | 5.5 |
| 2015 | 31 108 000 | 28.1 | 65.7 | 6.2 |
Structure of the population [6]
Structure of the population (01.07.2011) (Data refer to projections based on the 2001 Population Census) :
| Age Group | Male | Female | Total | % |
|---|---|---|---|---|
| Total | 14 673 402 | 14 604 334 | 29 277 736 | 100 |
| 0-4 | 1 489 651 | 1 422 996 | 2 912 647 | 9,95 |
| 5-9 | 1 449 771 | 1 387 490 | 2 837 261 | 9,69 |
| 10-14 | 1 407 049 | 1 348 839 | 2 755 888 | 9,41 |
| 15-19 | 1 381 341 | 1 330 517 | 2 711 858 | 9,26 |
| 20-24 | 1 356 690 | 1 321 939 | 2 678 629 | 9,15 |
| 25-29 | 1 247 545 | 1 233 317 | 2 480 862 | 8,47 |
| 30-34 | 1 125 519 | 1 124 781 | 2 250 300 | 7,69 |
| 35-39 | 975 071 | 981 664 | 1 956 735 | 6,68 |
| 40-44 | 901 661 | 912 835 | 1 814 496 | 6,20 |
| 45-49 | 828 558 | 843 046 | 1 671 604 | 5,71 |
| 50-54 | 689 404 | 706 581 | 1 395 985 | 4,77 |
| 55-59 | 572 058 | 592 013 | 1 164 071 | 3,98 |
| 60-64 | 450 502 | 471 913 | 922 415 | 3,15 |
| 65-69 | 319 897 | 346 672 | 666 569 | 2,28 |
| 70-74 | 215 081 | 246 972 | 462 053 | 1,58 |
| 75+ | 263 604 | 332 759 | 596 363 | 2,04 |
| Age group | Male | Female | Total | Percent |
|---|---|---|---|---|
| 0-14 | 4 346 471 | 4 159 325 | 8 505 796 | 29,05 |
| 15-64 | 9 528 349 | 9 518 606 | 19 046 955 | 65,06 |
| 65+ | 798 582 | 926 403 | 1 724 985 | 5,89 |
Structure of the population (01.07.2013) (Data refer to projections based on the 2001 Population Census) :
| Age Group | Male | Female | Total | % |
|---|---|---|---|---|
| Total | 15 102 533 | 15 052 819 | 30 155 352 | 100 |
| 0-4 | 1 491 898 | 1 424 743 | 2 916 641 | 9,67 |
| 5-9 | 1 464 151 | 1 400 914 | 2 865 065 | 9,50 |
| 10-14 | 1 423 817 | 1 364 178 | 2 787 995 | 9,25 |
| 15-19 | 1 386 506 | 1 334 874 | 2 721 380 | 9,02 |
| 20-24 | 1 359 923 | 1 323 716 | 2 683 639 | 8,90 |
| 25-29 | 1 291 849 | 1 275 387 | 2 567 236 | 8,51 |
| 30-34 | 1 167 219 | 1 166 307 | 2 333 526 | 7,74 |
| 35-39 | 1 032 504 | 1 040 183 | 2 072 687 | 6,87 |
| 40-44 | 917 077 | 929 479 | 1 846 556 | 6,12 |
| 45-49 | 852 761 | 869 313 | 1 722 074 | 5,71 |
| 50-54 | 742 176 | 762 161 | 1 504 337 | 4,99 |
| 55-59 | 604 508 | 627 863 | 1 232 371 | 4,09 |
| 60-64 | 486 985 | 513 029 | 1 000 014 | 3,32 |
| 65-69 | 357 333 | 386 715 | 744 048 | 2,47 |
| 70-74 | 238 848 | 273 230 | 512 078 | 1,70 |
| 75-79 | 157 083 | 191 869 | 348 952 | 1,16 |
| 80+ | 127 895 | 168 858 | 296 753 | 0,98 |
| Age group | Male | Female | Total | Percent |
|---|---|---|---|---|
| 0-14 | 4 379 866 | 4 189 835 | 8 569 701 | 28,42 |
| 15-64 | 9 841 508 | 9 842 312 | 19 683 820 | 65,27 |
| 65+ | 881 159 | 1 020 672 | 1 901 831 | 6,31 |
Vital statistics
Registration of vital events is in Venezuela not complete. The Population Departement of the United Nations prepared the following estimates. [5]
| Period | Live births per year |
Deaths per year |
Natural change per year |
CBR* | CDR* | NC* | TFR* | IMR* | Life expectancy total |
Life expectancy males |
Life expectancy females |
|---|---|---|---|---|---|---|---|---|---|---|---|
| 1950–1955 | 263,000 | 69,000 | 193,000 | 46.5 | 12.6 | 34.1 | 6.46 | 107 | 54.3 | 52.9 | 55.8 |
| 1955–1960 | 309,000 | 73,000 | 236,000 | 44.9 | 10.9 | 34.2 | 6.46 | 89 | 57.1 | 55.6 | 58.7 |
| 1960–1965 | 375,000 | 77,000 | 298,000 | 45.1 | 9.5 | 35.7 | 6.66 | 73 | 59.9 | 58.2 | 61.7 |
| 1965–1970 | 397,000 | 76,000 | 320,000 | 40.1 | 8.0 | 32.4 | 5.90 | 60 | 62.6 | 60.5 | 64.9 |
| 1970–1975 | 411,000 | 76,000 | 334,000 | 35.1 | 6.7 | 28.6 | 4.94 | 49 | 65.0 | 62.4 | 67.7 |
| 1975–1980 | 476,000 | 81,000 | 395,000 | 34.2 | 5.8 | 28.4 | 4.47 | 39 | 67.3 | 64.6 | 70.4 |
| 1980–1985 | 519,000 | 89,000 | 430,000 | 32.0 | 5.3 | 26.5 | 3.96 | 34 | 68.9 | 66.0 | 72.0 |
| 1985–1990 | 561,000 | 92,000 | 468,000 | 30.3 | 4.9 | 25.3 | 3.65 | 27 | 70.5 | 67.7 | 73.5 |
| 1990–1995 | 563,000 | 101,000 | 461,000 | 26.9 | 4.8 | 22.1 | 3.25 | 23 | 71.5 | 68.7 | 74.5 |
| 1995–2000 | 569,000 | 114,000 | 455,000 | 24.5 | 4.9 | 19.7 | 2.94 | 21 | 72.1 | 69.3 | 75.1 |
| 2000–2005 | 585,000 | 129,000 | 456,000 | 22.9 | 5.0 | 17.9 | 2.72 | 19 | 72.7 | 69.9 | 75.8 |
| 2005–2010 | 598,000 | 142,000 | 456,000 | 21.4 | 5.1 | 16.3 | 2.55 | 17 | 73.7 | 70.8 | 76.8 |
| 2010–2015 | 601,000 | 159,000 | 442,000 | 19.9 | 5.3 | 14.6 | 2.40 | 15 | 74.5 | 71.7 | 77.6 |
| 2015–2020 | 595,000 | 178,000 | 417,000 | 18.4 | 5.5 | 12.9 | 2.28 | 13 | 75.3 | 72.5 | 78.4 |
| * CBR = crude birth rate (per 1000); CDR = crude death rate (per 1000); NC = natural change (per 1000); IMR = infant mortality rate per 1000 births; TFR = total fertility rate (number of children per woman) | |||||||||||
Births and deaths
| Year | Population | Live births | Deaths | Natural increase | Crude birth rate | Crude death rate | Rate of natural increase | TFR |
|---|---|---|---|---|---|---|---|---|
| 1996 | 497,975 | 93,839 | 404,136 | 22.3 | 4.2 | 18.1 | ||
| 1997 | 516,616 | 94,334 | 422,282 | 22.7 | 4.1 | 18.6 | ||
| 1998 | 501,808 | 98,624 | 403,184 | 21.6 | 4.2 | 17.4 | ||
| 1999 | 527,888 | 101,907 | 425,981 | 22.1 | 4.3 | 17.8 | ||
| 2000 | 544,416 | 103,255 | 441,161 | 22.4 | 4.2 | 18.2 | ||
| 2001 | 529,552 | 107,867 | 421,685 | 21.4 | 4.4 | 17.0 | ||
| 2002 | 492,678 | 105,388 | 387,290 | 19.5 | 4.2 | 15.3 | ||
| 2003 | 555,614 | 118,562 | 437,052 | 21.6 | 4.6 | 17.0 | ||
| 2004 | 637,799 | 114,480 | 523,319 | 24.4 | 4.4 | 20.0 | ||
| 2005 | 665,997 | 110,301 | 555,696 | 25.1 | 4.2 | 20.9 | ||
| 2006 | 646,225 | 115,348 | 530,877 | 23.9 | 4.3 | 19.6 | ||
| 2007 | 615,371 | 118,594 | 496,777 | 22.4 | 4.3 | 18.1 | ||
| 2008 | 581,480 | 124,062 | 457,418 | 20.8 | 4.4 | 16.4 | ||
| 2009 | 593,845 | 123,530 | 470,315 | 20.9 | 4.4 | 16.6 | ||
| 2010 | 591,303 | 130,597 | 460,706 | 20.7 | 4.6 | 16.1 | ||
| 2011 | 615,132 | 136,803 | 478,329 | 21.3 | 4.7 | 16.5 | 2.466 | |
| 2012 | 619,530 | 142,988 | 476,542 | 21.1 | 4.9 | 16.2 | 2.446 | |
| 2013 | 597,902 | 147,901 | 450,001 | 20.1 | 5.0 | 15.1 | 2.427 | |
| 2014 | 30,070,000 | 597,773 | 159,239 | 438,534 | 19.9 | 5.3 | 14.6 | 2.410 |
| 2015 | 30,489,000 | 600,860 | 163,367 | 437,493 | 19.6 | 5.3 | 14.3 | |
| 2016 | 30,883,000 | 642,664 | 185,697 | 456,967 | 20.8 | 6.0 | 14.8 | |
| 2017 | 31,277,000 | 579,349 | 190,236 | 389,113 | 18.5 | 6.1 | 12.4 | |
| 2018 | 31,689,176 | 18.5 | 5.3 | 13.2 | 2.3 | |||
| 2020 | 28,644,603 | 17.9 | 7.5 | 10.4 | 2.26 | |||
Other demographic statistics
Demographic statistics according to the World Population Review in 2019.[8]
- One birth every 53 seconds
- One death every 3 minutes
- One net migrant every 45 minutes
- Net gain of one person every 1 minute
Demographic statistics according to the CIA World Factbook, unless otherwise indicated.[9]
- Total population
- 28,644,603 (July 2020 est.)
- Ethnic groups
unspecified Spanish, Italian (5–6%), Portuguese (1.4%), Arab (5%), German (<0.1%), African (3.4%), indigenous peoples (2.7%)
- Age structure
- 0-14 years: 25.66% (male 3,759,280/female 3,591,897)
- 15-24 years: 16.14% (male 2,348,073/female 2,275,912)
- 25-54 years: 41.26% (male 5,869,736/female 5,949,082)
- 55-64 years: 8.76% (male 1,203,430/female 1,305,285)
- 65 years and over: 8.18% (male 1,069,262/female 1,272,646) (2020 est.)
- Median age
- total: 30 years. Country comparison to the world: 124th
- male: 29.4 years
- female: 30.7 years (2020 est.)
- Birth rate
- 17.9 births/1,000 population (2020 est.) Country comparison to the world: 92th
- Death rate
- 7.5 deaths/1,000 population (2020 est.) Country comparison to the world: 106th
- Total fertility rate
- 2.26 children born/woman (2020 est.) Country comparison to the world: 87th
- Net migration rate
- -3.4 migrant(s)/1,000 population (2020 est.) Country comparison to the world: 184th
- Population growth rate
- -0.18% (2020 est.) Country comparison to the world: 207th
- 1.51% (2009 est.).
- Contraceptive prevalence rate
- 75% (2010)
- Dependency ratios
- total dependency ratio: 52.6 (2015 est.)
- youth dependency ratio: 43 (2015 est.)
- elderly dependency ratio: 9.5 (2015 est.)
- potential support ratio: 10.5 (2015 est.)
- Life expectancy at birth
- total population: 76.2 years
- male: 73.2 years
- female: 79.3 years (2018 est.)
- Urbanization
- urban population: 88.2% of total population (2018)
- rate of urbanization: 1.28% annual rate of change (2015-20 est.)
- Languages
Spanish (official), numerous indigenous dialects
- Literacy
definition: age 15 and over can read and write (2016 est.)
- total population: 97.1%
- male: 97%
- female: 97.2% (2016 est.)
- School life expectancy (primary to tertiary education)
- total: 14 years
- Unemployment, youth ages 15-24
- total: 14.6%. Country comparison to the world: 92nd
Sex ratio
| Age | Ratio (males/females) |
|---|---|
| Total: | 1.02 |
| At birth: | 1.07 |
| Under 15: | 1.07 |
| 15–64: | 1.01 |
| Over 65: | 0.83 |
Ethnicity
According to an autosomal DNA genetic study conducted in 2008 by the University of Brasilia (UNB) the composition of Venezuela's population is: 60.60% of European contribution, 23% of Amerindian contribution and 16.30% of African contribution. 3.6% of Venezuelans are fully black, but Mulattos (black mixed with white) are a much larger proportion. With many Venezuelans having African ancestry. [10]
Religious affiliation
The overwhelming majority of Venezuelans denote themselves as adherents of Catholicism; this is true nominally if not in practice.
| Affiliation | % of Venezuela population | |
|---|---|---|
| Christian | 88.3 | |
| Catholic | 71 | |
| Protestant | 17 | |
| Mormon | 0.3 | |
| Non-Christian faiths | 2.7 | |
| Jewish | 0.05 | |
| Muslim | 0.4 | |
| Santería | 1 | |
| Other Non-Christian faiths | 1.25 | |
| Unaffiliated | 9 | |
| Agnostic/indifferent | 6 | |
| Atheist | 2 | |
| Don't know/refused answer | 1 | |
| Total | 100 | |
According to the 2011 census, 88.3 percent of the population is Christian, primarily Roman Catholic (71%), 17 percent Protestant, and the remaining 0.03 percent Mormons (LDS Church).[13] The Venezuelans without religion are 9% (atheist 2%, agnostic or indifferent 6% and doesn't know/doesn't respond 1% ), almost 3% of the population follow other religions (1% of them are of Santería).[11][12]
References
- "Resultado Básico del XIV Censo Nacional de Población y —×Vivienda 2011 (Mayo 2014)" (PDF). Ine.gov.ve. p. 29. Retrieved 8 September 2014.
- "Censos de población y vivienda". Ine.gob.ve. Retrieved 3 October 2017.
- ""World Population prospects – Population division"". population.un.org. United Nations Department of Economic and Social Affairs, Population Division. Retrieved 9 November 2019.
- ""Overall total population" – World Population Prospects: The 2019 Revision" (xslx). population.un.org (custom data acquired via website). United Nations Department of Economic and Social Affairs, Population Division. Retrieved 9 November 2019.
- Population Division of the Department of Economic and Social Affairs of the United Nations Secretariat, World Population Prospects: The 2010 Revision Archived 6 May 2011 at the Wayback Machine
- "United Nations Statistics Division - Demographic and Social Statistics". unstats.un.org.
- "3. Live births, deaths, and infant deaths, latest available year (2002 - 2016)" (PDF). Unstats.un.org. Retrieved 3 October 2017.
- "Venezuela Population 2019", World Population Review
- "World Factbook SOUTH AMERICA : VENEZUELA", The World Factbook, 12 July 2018
- Godinho, Neide Maria de Oliveira (2008). "O impacto das migrações na constituição genética de populações latino-americanas" (PDF). Universidade de Brasília. Archived from the original on 6 July 2011. Retrieved 1 August 2012.
- Aguire, Jesus Maria (June 2012). "Informe Sociográfico sobre la religión en Venezuela" (PDF) (in Spanish). El Centro Gumilla. Retrieved 5 April 2015.
- "Venezuela". State.gov. Retrieved 3 October 2017.
- "LDS Starics". Mormon Newsroom. Retrieved 3 October 2017.

- Acosta, Maruja. "Urbanizacion y clases sociales en Venezuela." Revista Interamericana de Planificacion Bogota, 7, No. 26, June 1973, 22–44.
- The article contains a statistical reference from the Wikipedia public domain Mestizos (2006).
External links
| Wikimedia Commons has media related to Demographics of Venezuela. |
| History |
|  | ||||
|---|---|---|---|---|---|---|
| Geography |
| |||||
| Politics | ||||||
| Economy | ||||||
| Society |
| |||||
| Indigenous | |
|---|---|
| Africa |
|
| Americas |
|
| Asia | |
| Europe | |
| Others | |
| Related topics | |