Demographics of Haiti
Although Haiti averages approximately 402 people per square kilometer (1041 per sq. mi.), its population is concentrated most heavily in urban areas, coastal plains, and valleys. The majority of Haitians, 95%, are of predominantly African descent.[1] The remaining of the population is primarily mulattoes, Europeans, Asians and Arabs. Hispanic residents in Haiti are mostly Cuban and Dominican. About two thirds of the Haitian population live in rural areas.
Although there was a national census taken in Haiti in 2003, much of that data has not been released to the public. Several demographic studies, including those by social work researcher Athena Kolbe, have shed light on the current status of urban residents. In 2006, households averaged 4.5 members. The median age was 25 years with a mean average age of 27 years. People aged 15 and younger counted for roughly a third of the population. Overall, 52.7 percent of the population was female.[2][3]
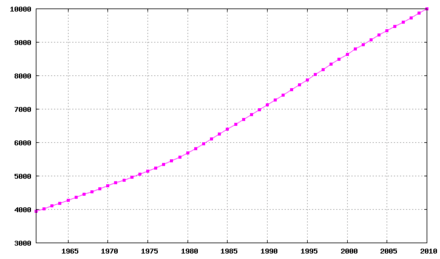
Population in Haiti
According to the 2019 revision of the World Population Prospects[4][5] the total population was 11,123,178 in 2018, compared to 3,221,000 in 1950. The proportion of children below the age of 15 in 2010 was 36.2%, 59.7% was between 15 and 65 years of age, while 4.5% was 65 years or older .[6] According to the World Bank, Haiti's dependency rate is 7.51 dependents per 100 working age persons.[3]
| Total population | Proportion aged 0–14 (%) |
Proportion aged 15–64 (%) |
Proportion aged 65+ (%) | |
|---|---|---|---|---|
| 1950 | 3 221 000 | 39.6 | 56.7 | 3.7 |
| 1955 | 3 516 000 | 39.7 | 56.9 | 3.4 |
| 1960 | 3 869 000 | 40.3 | 56.5 | 3.2 |
| 1965 | 4 275 000 | 41.7 | 54.9 | 3.4 |
| 1970 | 4 713 000 | 41.8 | 54.5 | 3.7 |
| 1975 | 5 144 000 | 41.3 | 54.8 | 3.9 |
| 1980 | 5 692 000 | 41.1 | 54.9 | 4.0 |
| 1985 | 6 389 000 | 42.2 | 53.8 | 4.0 |
| 1990 | 7 110 000 | 43.1 | 52.9 | 4.0 |
| 1995 | 7 838 000 | 42.6 | 53.5 | 3.9 |
| 2000 | 8 578 000 | 40.3 | 55.7 | 4.0 |
| 2005 | 9 261 000 | 38.1 | 57.8 | 4.2 |
| 2010 | 9 896 000 | 36.2 | 59.7 | 4.5 |
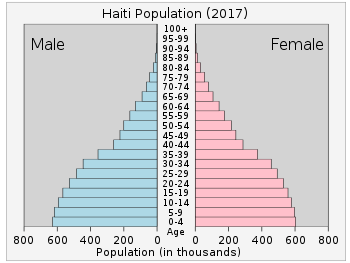
Structure of the population [7]
Structure of the population (01.07.2010) (Estimates) :
| Age Group | Male | Female | Total | % |
|---|---|---|---|---|
| Total | 4 993 731 | 5 091 483 | 10 085 214 | 100% |
| 0-4 | 644 550 | 618 772 | 1 263 322 | 12.53% |
| 5-9 | 608 495 | 586 984 | 1 195 479 | 11.85% |
| 10-14 | 588 618 | 569 860 | 1 158 478 | 11.49% |
| 15-19 | 551 467 | 540 897 | 1 092 364 | 10.83% |
| 20-24 | 509 042 | 510 547 | 1 019 589 | 10.11% |
| 25-29 | 454 123 | 465 513 | 919 636 | 9.12% |
| 30-34 | 340 518 | 362 078 | 702 596 | 6.97% |
| 35-39 | 261 157 | 286 847 | 548 004 | 5.43% |
| 40-44 | 235 182 | 253 300 | 488 482 | 4.84% |
| 45-49 | 204 077 | 219 300 | 423 377 | 4.20% |
| 50-54 | 166 418 | 176 495 | 342 913 | 3.40% |
| 55-59 | 136 034 | 148 697 | 284 731 | 2.82% |
| 60-64 | 95 939 | 110 896 | 206 835 | 2.05% |
| 65-69 | 81 854 | 94 044 | 175 898 | 1.74% |
| 70-74 | 58 181 | 71 255 | 129 436 | 1.28% |
| 75-79 | 35 538 | 45 360 | 80 898 | 0.80% |
| 80+ | 22 538 | 30 638 | 53 176 | 0.53% |
| Age group | Male | Female | Total | Percent |
|---|---|---|---|---|
| 0-14 | 1 841 663 | 1 775 999
66 |
3 617 229 | 35.87% |
| 15-64 | 2 953 957 | 3 074 620 | 6 028 577 | 59.78% |
| 65+ | 198 111 | 241 297 | 439 408 | 4.36% |
Structure of the population (01.07.2011) (Estimates) :
| Age Group | Male | Female | Total | % |
|---|---|---|---|---|
| Total | 5 075 517 | 5 172 789 | 10 248 306 | 100 |
| 0-4 | 647 465 | 621 432 | 1 268 897 | 12.38% |
| 5-9 | 611 472 | 589 690 | 1 201 161 | 11.72% |
| 10-14 | 591 018 | 572 066 | 1 163 085 | 11.35% |
| 15-19 | 556 085 | 544 798 | 1 100 883 | 10.74% |
| 20-24 | 514 235 | 514 898 | 1 029 132 | 10.04% |
| 25-29 | 465 396 | 475 451 | 940 847 | 9.18% |
| 30-34 | 358 927 | 379 066 | 737 993 | 7.20% |
| 35-39 | 270 574 | 296 362 | 566 936 | 5.53% |
| 40-44 | 237 754 | 257 273 | 495 026 | 4.83% |
| 45-49 | 208 671 | 224 746 | 433 416 | 4.23% |
| 50-54 | 171 468 | 182 332 | 353 800 | 3.45% |
| 55-59 | 140 392 | 152 742 | 293 134 | 2.86% |
| 60-64 | 99 846 | 114 973 | 214 819 | 2.10% |
| 65-69 | 82 201 | 94 868 | 177 069 | 1.73% |
| 70-74 | 59 833 | 72 957 | 132 790 | 1.30% |
| 75-79 | 36 751 | 47 083 | 83 834 | 0.82% |
| 80+ | 23 431 | 32 053 | 55 484 | 0.54% |
| Age group | Male | Female | Total | Percent |
|---|---|---|---|---|
| 0-14 | 1 849 955 | 1 783 188 | 3 633 143 | 35.45% |
| 15-64 | 3 023 346 | 3 142 640 | 6 165 986 | 60.17% |
| 65+ | 202 216 | 246 961 | 449 177 | 4.38% |
Structure of the population (DHS 2012) (Males 28 122, Females 29 844 = 57 966) :
| Age Group | Male (%) | Female (%) | Total (%) |
|---|---|---|---|
| 0-4 | 12.9% | 11.7% | 12.3% |
| 5-9 | 12.1% | 10.9% | 11.5% |
| 10-14 | 12.9% | 11.7% | 12.3% |
| 15-19 | 11.6% | 11.7% | 11.6% |
| 20-24 | 9.5% | 10.0% | 9.8% |
| 25-29 | 7.7% | 8.4% | 8.1% |
| 30-34 | 6.0% | 6.3% | 6.2% |
| 35-39 | 5.2% | 5.2% | 5.2% |
| 40-44 | 4.3% | 4.2% | 4.3% |
| 45-49 | 3.6% | 4.0% | 3.8% |
| 50-54 | 3.3% | 4.1% | 3.7% |
| 55-59 | 2.8% | 3.4% | 3.1% |
| 60-64 | 2.5% | 2.6% | 2.5% |
| 65-69 | 2.0% | 1.8% | 1.9% |
| 70-74 | 1.6% | 1.4% | 1.5% |
| 75-79 | 0.8% | 0.9% | 0.9% |
| 80+ | 1.1% | 1.5% | 1.3% |
| Age group | Male (%) | Female (%) | Total (%) |
|---|---|---|---|
| 0-14 | 37.9% | 34.3% | 36.1% |
| 15-64 | 56.6% | 60.1% | 58.3% |
| 65+ | 5.5% | 5.6% | 5.6% |
Vital statistics
Registration of vital events in Haiti is not complete. The Population Department of the United Nations prepared the following estimates. [6]
| Period | Live births per year |
Deaths per year |
Natural change per year |
CBR* | CDR* | NC* | TFR* | IMR* | Life expectancy total |
Life expectancy males |
Life expectancy females |
|---|---|---|---|---|---|---|---|---|---|---|---|
| 1950–1955 | 154 000 | 89 000 | 65 000 | 45.7 | 26.5 | 19.2 | 6.30 | 220 | 37.6 | 36.3 | 38.9 |
| 1955–1960 | 165 000 | 87 000 | 78 000 | 44.6 | 23.6 | 21.0 | 6.30 | 194 | 40.7 | 39.4 | 42.0 |
| 1960–1965 | 177 000 | 86 000 | 91 000 | 43.5 | 21.1 | 22.4 | 6.30 | 171 | 43.6 | 42.3 | 44.9 |
| 1965–1970 | 183 000 | 84 000 | 99 000 | 40.7 | 18.6 | 22.1 | 6.00 | 150 | 46.3 | 44.9 | 57.6 |
| 1970–1975 | 188 000 | 85 000 | 104 000 | 38.2 | 17.2 | 21.1 | 5.60 | 135 | 48.0 | 46.8 | 49.3 |
| 1975–1980 | 217 000 | 87 000 | 129 000 | 40.0 | 16.1 | 23.9 | 5.80 | 131 | 50.0 | 48.5 | 51.5 |
| 1980–1985 | 259 000 | 94 000 | 164 000 | 42.8 | 15.6 | 27.2 | 6.21 | 122 | 51.5 | 50.2 | 52.9 |
| 1985–1990 | 264 000 | 94 000 | 170 000 | 39.1 | 13.9 | 25.3 | 5.70 | 100 | 53.6 | 52.2 | 55.0 |
| 1990–1995 | 265 000 | 93 000 | 172 000 | 35.5 | 12.5 | 23.1 | 5.15 | 85 | 55.3 | 53.7 | 56.8 |
| 1995–2000 | 268 000 | 93 000 | 175 000 | 32.7 | 11.3 | 21.3 | 4.62 | 70 | 56.9 | 55.2 | 58.7 |
| 2000–2005 | 265 000 | 95 000 | 171 000 | 29.7 | 10.6 | 19.1 | 4.00 | 56 | 58.1 | 56.4 | 59.9 |
| 2005–2010 | 265 000 | 90 000 | 175 000 | 27.7 | 9.4 | 18.3 | 3.55 | 49 | 60.7 | 59.0 | 62.4 |
| * CBR = crude birth rate (per 1000); CDR = crude death rate (per 1000); NC = natural change (per 1000); IMR = infant mortality rate per 1000 births; TFR = total fertility rate (number of children per woman) | |||||||||||
While limited, evidence suggests that disasters can cause human populations to increase in the long term, rather than decrease. Documented fertility spikes followed the Khmer Rouge conflict and 2004 Indian Ocean tsunami - potential causes may include reduced access to contraception and families desiring more children following child death.[8] In Haiti's case, the fertility rate nearly tripled after the quake, and is likely to remain elevated (above pre-quake levels) for long after.[9]
Births and deaths
| Year | Population | Live births | Deaths | Natural increase | Crude birth rate | Crude death rate | Rate of natural increase | TFR |
|---|---|---|---|---|---|---|---|---|
| 2005 | 9,292,282 | ~258,325 | ~87,347 | ~170,978 | 27.8 | 9.4 | 18.4 | 3.5 |
| 2006 | 9,445,412 | ~258,804 | ~87,842 | ~170,962 | 27.4 | 9.3 | 18.2 | 3.4 |
| 2007 | 9,602,305 | ~260,222 | ~87,381 | ~172,841 | 27.1 | 9.1 | 18.0 | 3.4 |
| 2008 | 9,761,929 | ~260,644 | ~87,857 | ~172,787 | 26.7 | 9.0 | 17.7 | 3.3 |
| 2009 | 9,923,243 | ~261,874 | ~87,325 | ~174,549 | 26.4 | 8.8 | 17.6 | 3.3 |
| 2010 | 10,085,216 | ~262,216 | ~87,741 | ~174,475 | 26.0 | 8.7 | 17.3 | 3.2 |
| 2011 | 10,248,306 | ~265,431 | ~88,135 | ~177,296 | 25.9 | 8.6 | 17.3 | |
| 2012 | 10,413,211 | ~267,620 | ~88,512 | ~179,108 | 25.7 | 8.5 | 17.2 | 3.2 |
| 2013 | 10,579,230 | ~247,025 | ~84,634 | ~162,391 | 23.35 | 8 | 15.35 | 2.88 |
Number of births and deaths are calculated - based on Crude Birth and Death Rates.
Fertility and births
The Total Fertility Rate (TFR) (Wanted Fertility Rate) and Crude Birth Rate (CBR):[11]
| Year | CBR (Total) | TFR (Total) | CBR (Urban) | TFR (Urban) | CBR (Rural) | TFR (Rural) |
|---|---|---|---|---|---|---|
| 1994–95 | 34 | 4.8 (3.0) | 31 | 3.3 (2.2) | 35 | 5.9 (3.7) |
| 2000 | 32.6 | 4.7 (2.7) | 29.4 | 3.3 (2.0) | 34.0 | 5.8 (3.4) |
| 2005–2006 | 28.7 | 4.0 (2.4) | 26.2 | 2.8 (1.8) | 30.1 | 5.0 (2.9) |
| 2012 | 27.8 | 3.5 (2.2) | 24.4 | 2.6 (1.9) | 29.4 | 4.4 (2.6) |
| 2016-17 | 24.3 | 3.0 (1.9) | 21.1 | 2.1 (1.5) | 26.3 | 3.9 (2.3) |
Other demographic statistics
Demographic statistics according to the World Population Review in 2019.[12]
- One birth every 2 minutes
- One death every 6 minutes
- One net migrant every 15 minutes
- Net gain of one person every 4 minutes
Demographic statistics according to the CIA World Factbook, unless otherwise indicated.[1]
- Population
- 10,788,440 (July 2018 est.)
- Ethnic groups
- black 95%, mixed and white 5%
- Age structure
- 0-14 years: 32.27% (male 1,733,920 /female 1,747,387)
- 15-24 years: 21.11% (male 1,139,188 /female 1,137,754)
- 25-54 years: 37.32% (male 1,997,816 /female 2,028,495)
- 55-64 years: 5.1% (male 262,494 /female 287,515)
- 65 years and over: 4.21% (male 199,617 /female 254,254) (2018 est.)
- Median age
- total: 23.3 years. Country comparison to the world: 172nd
- male: 23.1 years
- female: 23.6 years (2018 est.)
- Birth rate
- 22.6 births/1,000 population (2018 est.) Country comparison to the world: 65th
- Death rate
- 7.5 deaths/1,000 population (2018 est.) Country comparison to the world: 111st
- Total fertility rate
- 2.66 children born/woman (2018 est.) Country comparison to the world: 65th
- Net migration rate
- -2 migrant(s)/1,000 population (2018 est.) Country comparison to the world: 163th
- Population growth rate
- 1.31% (2018 est.) Country comparison to the world: 84th
- Mother's mean age at first birth
- 22.8 years (2016/7 est.)
- note: median age at first birth among women 25-29
- Contraceptive prevalence rate
- 34.3% (2016/17)
- Dependency ratios
- total dependency ratio: 62.3 (2015 est.)
- youth dependency ratio: 54.8 (2015 est.)
- elderly dependency ratio: 7.5 (2015 est.)
- potential support ratio: 13.3 (2015 est.)
- Life expectancy at birth
- total population: 64.6 years
- male: 61.9 years
- female: 67.2 years (2018 est.)
- Urbanization
- urban population: 55.3% of total population (2018)
- rate of urbanization: 2.9% annual rate of change (2015-20 est.)
- Religions
- Roman Catholic 58.7%, Protestant 33.5% (Baptist 15.4%, Pentecostal 14.9%, Adventist 3%, Methodist 1.5%, other 0.7%), vodou 2.1%, other 4.6%, none 1.2% (2018 est.)
- note: many Haitians practice elements of vodou in addition to another religion, most often Roman Catholicism; vodou was recognized as an official religion in 2003
- Education expenditures
- 2.4% of GDP (2016) Country comparison to the world: 162nd
- Literacy
definition: age 15 and over can read and write (2015 est.)
- total population: 60.7%
- male: 64.3%
- female: 57.3% (2015 est.)
- Languages
- French (official)
- Haitian Creole (official)
- Nationality
- noun:Haitian(s)
- adjective: Haitian
Languages
Taíno was the major pre-Columbian language in the region of what is Haiti (or Ayti), a name rooted in the language to refer to the entire island of Hispaniola[13][14] to mean, "land of high mountains."[15]
Today, the Republic of Haiti has two official languages. They are French and Haitian Creole; the latter, a French-based creole where 90% of its vocabulary is derived from, with influences from Portuguese, Spanish, Taíno, and West African languages.[16] French is the principal written and administratively authorized language (as well as the main language of the press) and is spoken by 42% of Haitians.[17][18] It is spoken by most educated Haitians, is the medium of instruction in most schools, and is used in the business sector. It is also used in ceremonial events such as weddings, graduations and church masses.
Haiti is one of two independent nations in the Americas (along with Canada) to designate French as an official language; the other French-speaking areas are all overseas départements, or collectivités, of France. Haitian Creole,[19] which has recently undergone a standardization, is spoken by virtually the entire population of Haiti.[20] It is related to the other French creoles, but most closely to Antillean Creole and Louisiana Creole variants.
Spanish, though not official, is spoken by a growing amount of the population, and is spoken more frequently near the border with the Dominican Republic. English is increasingly spoken among the young and in the business sector.[21]
Religion
The state religion is Roman Catholicism which 55–60% of the population professes. 30–35% of Haitians practice Protestantism(mostly Pentecostalism.An important percentage of the population practice Vodou, mostly along with another religion.[1] The main religions practiced in Haiti are Roman Catholicism, Pentecostalism, Islam, and Judaism. In addition, the protestant population is continuing to grow, along with Islam and Judaism. Almost 99% of Haitians claim at least one religion, with a part of them practicing some part of voodoo. [22]
Voodoo is rare among the urban elite and is often compared to Cuban Santeria due to the large Cuban population in Haiti. [23] The practice of voodoo revolves around family spirits called Loua that protect children. To repay the spirits, children perform two ceremonies where the Loua are given gifts like food and drinks. That does depend of the monetary status of these families, poorer families wait until there is a need to perform the rituals. [24]
Voodoo in relation to Christianity came along two different paths, the path with the Catholics and the path with the protestants. For the Catholic path; under the French the slaves were not allowed to practice Voodoo, but they were allowed to occasionally have dances on the weekend. These dances turned out to be Voodoo services, until they were liberated in 1804. Most Haitians see practicing Voodoo and Christianity as normal due to the many components they share. The catholic church wasn't always as accepting of Voodoo as it is now, in 1941-1942 a holy war was waged against Voodoo killing many of the higher ups in the Voodoo religion. This war ended around 1950 when the Catholics decided give up the prosecution of those who practiced Voodoo and to have a relative peace. The path with the protestants was less peaceful. The Protestants came to Haiti in 1970 and since then they have been bitter enemies of Voodoo, most often calling it devil worship. [25]
Education
Although public education at the primary level is now free, private and parochial schools provide around 75% of educational programs offered.
In recent years, several annual literacy campaigns launched in by the Martelly administration has increased overall literacy among adults in Haiti.[26] UNESCO projects an overall literacy rate of 61.1% in Haiti by 2015.[27] As of December 2014, World Bank has reported that school enrollment has increased from 78% to 90% in Haiti, very close to the goal of universal child enrollment.[28]
Labor
In 2004, 300,000 children were restavecs, the practice of which is comparable to indentured service of minors.[29]
Emigration
Large-scale emigration, principally to the Dominican Republic, United States, and Canada (predominantly to Quebec, with other areas of the country) – but also to Cuba, other areas of Europe and the Americas (like Argentina) such as France (with French Guiana), Spain, Belgium, the United Kingdom and Ireland; and Venezuela, Brazil, Chile, the Bahamas and other Caribbean neighbors – has created what Haitians refer to as the Eleventh Department or the Diaspora. About one of every six Haitians live abroad.
Immigration
45,000 Westerners from the United States live in Haiti. They represent 0.4% of its total population.[30]
References
- "World Factbook CENTRAL AMERICA : HAITI", The World Factbook, July 12, 2018

- Kolbe, Athena R.; Royce A. Hutson (August 31, 2006). "Human rights abuse and other criminal violations in Port-au-Prince, Haiti: a random survey of households" (PDF). The Lancet. 368: 864–873. doi:10.1016/S0140-6736(06)69211-8. PMID 16950364. Retrieved 20 June 2011.
- "Population ages 15-64 (% of total) - Data". Data.worldbank.org. Retrieved 3 October 2017.
- ""World Population prospects – Population division"". population.un.org. United Nations Department of Economic and Social Affairs, Population Division. Retrieved November 9, 2019.
- ""Overall total population" – World Population Prospects: The 2019 Revision" (xslx). population.un.org (custom data acquired via website). United Nations Department of Economic and Social Affairs, Population Division. Retrieved November 9, 2019.
- "Population Division of the Department of Economic and Social Affairs of the United Nations Secretariat, World Population Prospects: The 2012 Revision". Esa.unorg. Archived from the original on 6 May 2011. Retrieved 3 October 2017.
- "United Nations Statistics Division - Demographic and Social Statistics". unstats.un.org. Retrieved 3 October 2017.
- Frankenberg, Laurito & Thomas, Duke University, 2014, The Demography of Disasters
- "Haiti's rate of fertility tripled - report". jamaica-gleaner.com. Retrieved 3 October 2017.
- "DEMOGRAPHIC PROFILE: HAITI" (PDF). Caricomstats.org. Archived from the original (PDF) on 3 October 2017. Retrieved 3 October 2017.
- "MEASURE DHS: Demographic and Health Surveys". microdata.worldbank.org. Retrieved 3 October 2017.
- "Haiti Population 2019", World Population Review
- Guitar, Lynne; Ferbel-Azcárate, Pedro; Estevez, Jorge (2006). "iii: Ocama-Daca Taíno (Hear me, I am Taíno)". Indigenous Resurgence in the Contemporary Caribbean. New York: Peter Lang Publishing. p. 41. ISBN 0-8204-7488-6. LCCN 2005012816. Retrieved 10 July 2015.
- Senauth, Frank (2011). The Making and Destruction of Haiti. Bloomington, Indiana, USA: AuthorHouse. p. 1. ISBN 978-1-4567-5384-9. LCCN 2011907203.
- Haydn, Joseph; Vincent, Benjamin (1860). "A Dictionary of Dates Relating to All Ages and Nations: For Universal Reference Comprehending Remarkable Occurrences, Ancient and Modern, The Foundation, Laws, and Governments of Countries-Their Progress In Civilization, Industry, Arts and Science-Their Achievements In Arms-And Their Civil, Military, And Religious Institutions, And Particularly of the British Empire". p. 321. Retrieved 12 September 2015.
- Bonenfant, Jacques L. (December 1989). Haggerty, Richard A. (ed.). "History of Haitian-Creole: From Pidgin to Lingua Franca and English Influence on the Language" (PDF). Library of Congress Federal Research Division.
- La langue française dans le monde 2014 (PDF). Nathan. 2014. ISBN 978-2-09-882654-0. Archived from the original (PDF) on 12 April 2015. Retrieved 20 May 2015.
- À ce propos, voir l'essai Prétendus Créolismes : le couteau dans l'igname, Jean-Robert Léonidas, Cidihca, Montréal 1995
- Valdman, Albert. "Creole: The National Language of Haiti". Footsteps. Indiana University Creole Institute. 2 (4): 36–39.
- "creolenationallanguageofhaiti". Indiana University. Retrieved 11 January 2014.
- "What Languages Are Spoken in Haiti?". WorldAtlas. Retrieved 2019-09-23.
- "Religious Beliefs In Haiti". WorldAtlas. Retrieved 2018-03-27.
- "Religious Beliefs In Haiti". WorldAtlas. Retrieved 2018-03-27.
- "Haiti - RELIGION". countrystudies.us. Retrieved 2018-03-27.
- "Haiti: Introduction to Voodoo". faculty.webster.edu. Retrieved 2018-04-09.
- "Haiti – Social : The fight against illiteracy, one of the Government's priorities". Haitilibre.com. September 9, 2014.
- ""Literacy Statistics trends 1985–2015"" (PDF). Uis.unesco.org. Retrieved 3 October 2017.
- "Extreme poverty drops in Haiti. Is it sustainable?". Worldbank.org. 4 December 2014. Retrieved 14 April 2015.
- Cohen, Gigi (2004-03-24). "Haiti's Dark secret:The Restavecs". National Public Radio.
- https://www.nytimes.com/2010/01/18/world/americas/18americans.html?_r=0
Demographics of the Americas | ||
|---|---|---|
| ||
| Sovereign states |
| .svg.png) |
| ||
| By geography |
| ||||||||||||||||||||||
|---|---|---|---|---|---|---|---|---|---|---|---|---|---|---|---|---|---|---|---|---|---|---|---|
| Secondary Afro-American diaspora |
| ||||||||||||||||||||||
| Wider issues | |||||||||||||||||||||||
| |||||||||||||||||||||||