Demographics of Singapore
The demographics of Singapore include the population statistics of Singapore such as population density, ethnicity, education level, health of the populace, economic status, religious affiliations and other demographic data of the population.
 Life in Singapore |
|---|
As of June 2019, Singapore's population stood at 5.70 million.[1] A large percentage of its population are non-residents; of its total population of 5.70 million in 2019, 4.03 million were residents (citizens & permanent residents), and 1.68 million non-residents (after rounding). It is the second-densest sovereign state in the world, after the microstate Monaco. Singapore is a multiracial and multicultural country with ethnic Chinese (76.2% of the citizen population), Malays (15.0%), and ethnic Indians (7.4%). Chinese Singaporeans make up the majority of the population.[2] There are also Eurasians in Singapore. The Malays are recognised as the indigenous community.[3][4][5][6] Since independence, the demographics of Singapore have been broadly organised under the CMIO (Chinese-Malay-Indian-Other) system of categorisation.
There are four official languages in Singapore: Malay, English, Mandarin and Tamil. Malay is the national language;[7] while English is the main working language. Education in Singapore is bilingual whereby English is the main medium of instruction and students are also taught a second language which may be Malay, Mandarin, or Tamil.[8][9] Religions include Buddhism, Christianity, Islam, Taoism, Hinduism, amongst others. The annual total population growth rate for the year 2019 was 1.2%.[10][11] Singapore’s resident total fertility rate (TFR) was 1.14 in 2018; the Singaporean Chinese, Malay and Indian fertility rates were 0.98, 1.85 and 1.0 respectively.[12] In 2018 the Singaporean Malay fertility rate was about 85% higher than that of Singaporean Chinese and Singaporean Indians, while approximately 70% higher in 2010.[13]
In 2018, Singapore was ranked the most infertile country in the world by CIA World Factbook with a fertility rate of 0.84. According to the fertility rate statistics for 2019 this is no longer the case. Taiwan, Moldova and Portugal all have lower fertility rates than Singapore.[14]
Demographics trends and key rates
Population size and growth by residential status
Source: Singapore Department of Statistics[15]
| Year | Number ('000) | Growth (year on year) | Land area (km2)[16] | Population density (persons per km2) | ||||||||
|---|---|---|---|---|---|---|---|---|---|---|---|---|
| Total population | Total residents | Singapore citizens | Permanent residents | Non-residents | Total population | Total residents | Singapore citizens | Permanent residents | Non-residents | |||
| 1950 | 1,022.1 | na | na | na | na | 4.4% | na | na | na | na | na | na |
| 1955 | 1,305.5 | na | na | na | na | 4.6% | na | na | na | na | na | na |
| 1960 | 1,646.4 | na | na | na | na | 3.7% | na | na | na | na | 581.5 | 2,831 |
| 1965 | 1,886.9 | na | na | na | na | 2.5% | na | na | na | na | 581.5 | 3,245 |
| 1970 | 2,074.5 | 2,013.6 | 1,874.8 | 138.8 | 60.9 | 2.8% | na | na | na | na | 586.4 | 3,538 |
| 1975 | 2,262.6 | na | na | na | na | 1.5% | na | na | na | na | 596.8 | 3,791 |
| 1980 | 2,413.9 | 2,282.1 | 2,194.3 | 87.8 | 131.8 | 1.5% | 1.3% | na | na | na | 617.8 | 3,907 |
| 1985 | 2,736 | 2,482.6 | na | na | 253.3 | 0.1% | 1.6% | na | na | na | 620.5 | 4,409 |
| 1990 | 3,047.1 | 2,735.9 | 2,623.7 | 112.1 | 311.3 | 2.3% | 1.7% | 1.7% | 2.3% | 9.0% | 633 | 4,706 |
| 1995 | 3,524.5 | 3,013.5 | 2,823.7 | 189.8 | 511 | 3.1% | 1.8% | 1.4% | 8.3% | 11.2% | 647.5 | 5,443 |
| 2000 | 4,027.9 | 3,273.4 | 2,985.9 | 287.5 | 754.5 | 2.8% | 1.8% | 1.3% | 9.9% | 9.3% | 682.7 | 5,900 |
| 2005 | 4,265.8 | 3,467.8 | 3,081 | 386.8 | 797.9 | 2.4% | 1.6% | 0.8% | 8.6% | 5.9% | 697.9 | 6,121 |
| 2010 | 5,076.7 | 3,771.7 | 3,230.7 | 541.0 | 1,305.0 | 1.8% | 1.0% | 0.9% | 1.5% | 4.1% | 712.4 | 7,126 |
| 2015 | 5,535.0 | 3,902.7 | 3,375.0 | 527.7 | 1,632.3 | 1.2% | 0.8% | 1.0% | 0% | 2.1% | 719.1 | 7,697 |
| 2018 | 5,638.7 | 3,994.3 | 3,471.9 | 522.3 | 1,644.4 | 0.5% | 0.7% | 1.0% | -0.8% | -0.1% | 724.2 | 7,804 |
Gender composition of resident population
Source: Singapore Department of Statistics[15][18]
| Year | 1960 | 1965 | 1970 | 1975 | 1980 | 1985 | 1990 | 1995 | 2000 | 2005 | 2010 | 2015 | 2018 |
|---|---|---|---|---|---|---|---|---|---|---|---|---|---|
| Total | 1,646.4 | 1,886.9 | 2,013.6 | 2,262.6 | 2,282.1 | 2,482.6 | 2,735.9 | 3,013.5 | 3,273.4 | 3,467.8 | 3,771.7 | 3,902.7 | 3,994.3 |
| Males | 859.6 | 973.8 | 1,030.8 | 1,156.1 | 1,159.0 | 1,258.5 | 1,386.3 | 1,514.0 | 1,634.7 | 1,721.1 | 1,861.1 | 1,916.6 | 1,955.8 |
| Females | 786.8 | 913.1 | 982.8 | 1,106.5 | 1,123.1 | 1,224.2 | 1,349.6 | 1,499.5 | 1,638.7 | 1,746.7 | 1,910.6 | 1,986.1 | 2,038.4 |
| Sex Ratio (Males per 1,000 females) | 1,093 | 1,066 | 1,049 | 1,045 | 1,032 | 1,028 | 1,027 | 1,010 | 998 | 985 | 974 | 965 | 959 |
Age distribution of resident population
Source: Singapore Department of Statistics[19]
| Age group (years) | 1990 | 2000 | 2010 | 2011 | 2012 | 2013 | 2014 |
|---|---|---|---|---|---|---|---|
| Below 15 | 23.0% | 21.9% | 17.4% | 16.8% | 16.4% | 16.0% | 15.7% |
| 15–24 | 16.9% | 12.9% | 13.5% | 13.6% | 13.7% | 13.6% | 13.2% |
| 25–34 | 21.5% | 17.0% | 15.1% | 14.8% | 14.4% | 14.4% | 14.4% |
| 35–44 | 16.9% | 19.4% | 16.7% | 16.4% | 16.3% | 16.1% | 16.0% |
| 45–54 | 9.0% | 14.3% | 16.6% | 16.7% | 16.5% | 16.4% | 16.1% |
| 55–64 | 6.7% | 7.2% | 11.7% | 12.4% | 12.7% | 13.1% | 13.4% |
| 65 and over | 6.0% | 7.2% | 9.0% | 9.3% | 9.9% | 10.5% | 11.2% |
| Median age (years) | 29.8 | 34.0 | 37.4 | 38.0 | 38.4 | 38.9[20] | 39.3[20] |
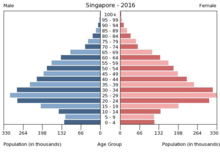
Population pyramid[21]
Estimates (13/06/2013) :
| Age group | Male | Female | Total | % |
|---|---|---|---|---|
| Total | 1 891 500 | 1 953 200 | 3 844 800 | 100 |
| 0–4 | 93 500 | 89 800 | 183 300 | 4.77 |
| 5–9 | 104 600 | 101 100 | 205 700 | 5.35 |
| 10–14 | 116 000 | 110 200 | 226 200 | 5.88 |
| 15–19 | 130 000 | 125 100 | 255 100 | 6.63 |
| 20–24 | 134 000 | 132 900 | 266 900 | 6.94 |
| 25–29 | 124 000 | 131 600 | 255 600 | 6.65 |
| 30–34 | 141 300 | 155 600 | 296 900 | 7.72 |
| 35–39 | 147 400 | 158 100 | 305 500 | 7.95 |
| 40–44 | 152 700 | 159 900 | 312 600 | 8.13 |
| 45–49 | 158 300 | 158 000 | 316 300 | 8.23 |
| 50–54 | 157 800 | 155 200 | 313 000 | 8.14 |
| 55–59 | 140 800 | 140 300 | 281 100 | 7.31 |
| 60–64 | 110 200 | 111 900 | 222 200 | 5.78 |
| 65–69 | 70 500 | 75 300 | 145 800 | 3.79 |
| 70–74 | 48 700 | 57 100 | 105 700 | 2.75 |
| 75–79 | 31 200 | 39 500 | 70 600 | 1.84 |
| 80–84 | 18 600 | 27 600 | 46 200 | 1.20 |
| 85+ | 11 900 | 24 100 | 36 100 | 0.94 |
| Age group | Male | Female | Total | Percent |
|---|---|---|---|---|
| 0–14 | 314 100 | 301 100 | 615 200 | 16.00 |
| 15–64 | 1 396 500 | 1 428 500 | 2 825 000 | 73.48 |
| 65+ | 180 900 | 223 600 | 404 500 | 10.52 |
Population growth
| Period | Population increase | Natural Increase | Net Immigration |
|---|---|---|---|
| 1881–1891 | 43,857 | −30,932A | 74,798 |
| 1901–1911 | 75,729 | −59,978A | 135,707 |
| 1921–1931 | 139,387 | 18,176 | 212,211 |
| 1947–1957 | 507,800 | 395,600 | 112,200 |
| 1970–1980 | 339,400 | 315,400 | 24,000 |
| 1990–2000 | 970,601 | 330,030 | 640,571 |
| |||
The growth of population in Singapore was for a long period fueled by immigration, starting soon after Stamford Raffles landed in Singapore in 1819, when the population of the island was estimated to be around 1,000.[23] The first official census taken in January 1824 showed that the resident population of Singapore had grown to 10,683: 4,580 Malays, 3,317 Chinese, 1,925 Bugis, 756 natives of India, 74 Europeans, 16 Armenians, and 15 Arabs.[24] Chinese males greatly outnumbered the females; in the 1826 population figures there were 5,747 Chinese males but only 341 Chinese females, in contrast to 2,501 Malay males and 2,289 Malay females. The figures for around a thousand Indians in 1826 are also similarly skewed towards male – 209 male and 35 female Bengalis, 772 males and 5 females from the Coromandel Coast.[25] By 1836, the population figure had risen to 29,980, and marked a change in demographics as the Malays were outnumbered for the first time; 45.9% of the population were Chinese versus 41.9% for Malays (including Javanese and Bugis).[26][27] Women from China were discouraged from emigrating, and most of the Chinese females in this early period of Singapore were likely nyonyas from Malacca; it was noted in 1837 that there were no Chinese women in Singapore who had emigrated directly from China.[27]
The imbalance of the sexes continued for a long period, for example, the 1901 census figures show that there were 130,367 Chinese males compared to 33,674 Chinese females.[28] Such imbalance also meant that fewer people were born in early Singapore, and in the first hundred years, most of the Chinese population in Singapore were immigrants. By the late 1890s, only around 10% of the Chinese population in Singapore were born there.[29] Many of the early migrant workers from China and India did not intend to settle permanently to raise their families in Singapore; they worked to send back remittance to their families back home, and would return to China or India after they had earned enough money. Later an increasing number of Chinese chose to settle permanently in Singapore, especially in the 1920s when it became more favourable to stay in Singapore rather than returning to China. Change in social attitude in the modern era also meant that Chinese women were freer to emigrate from China, and the sex ratio began to normalise.[27] This gradual normalisation of sex ratio led to an increase in the number of native births. Immigration continued to be the main reason for the Chinese population increase in Singapore until the 1931–1947 period when the natural increase in population surpassed the net immigration figure.[29][30]
After World War II, in the period from 1947 to 1957, Singapore saw a massive population increase mostly due to increased number of native births.[31] The birth rate rose and the death rate fell; the average annual growth rate was 4.4%, of which 1% was due to immigration; Singapore experienced its highest birth rate in 1957 at 42.7 per thousand individuals. (This was also the same year the United States saw its peak birth rate.)
| Year | 1950 | 1955 | 1960 | 1965 | 1970 | 1975 | 1980 | 1985 | 1990 | 1995 | 2000 | 2005 | 2006 | 2007 | 2008 | 2009 | 2010 | 2011 | 2012 | 2013 | 2014 | 2015 |
|---|---|---|---|---|---|---|---|---|---|---|---|---|---|---|---|---|---|---|---|---|---|---|
| Total Live-Births | 45,934 | 41,217 | 51,142 | 46,997 | 39,826 | 39,570 | 37,967 | 39,654 | 42,663 | 39,720 | 42,232 | 42,185 | ||||||||||
| Resident Live-Births | N.A. | 40,100 | 49,787 | 44,765 | 35,129 | 36,178 | ||||||||||||||||
| Crude Birth Rate (Per 1,000 residents) | 45.4 | 44.3 | 37.5 | 29.5 | 22.1 | 17.7 | 17.6 | 16.6 | 18.2 | 15.6 | 13.7 | 10.2 | 10.3 | 10.3 | 10.2 | 9.9 | 9.3 | 9.5 | 10.1 | 9.3 | 9.8 | |
| Total Fertility Rate (Per female) | N.A. | N.A. | 5.76 | 4.66 | 3.07 | 2.07 | 1.82 | 1.61 | 1.83 | 1.67 | 1.60 | 1.26 | 1.28 | 1.29 | 1.28 | 1.22 | 1.15 | 1.20 | 1.29 | 1.19 | 1.25 | 1.24 |
| Gross Reproduction Rate (Per female) | N.A. | N.A. | 2.78 | 2.27 | 1.49 | 1.00 | 0.88 | 0.78 | 0.88 | 0.80 | 0.76 | 0.61 | 0.62 | 0.62 | 0.62 | 0.59 | 0.56 | 0.58 | 0.62 | 0.57 | 0.61 | |
| Net Reproduction Rate (Per female) | N.A. | N.A. | 2.54 | 2.08 | 1.42 | 0.97 | 0.86 | 0.76 | 0.87 | 0.80 | 0.77 | 0.61 | 0.61 | 0.62 | 0.62 | 0.59 | 0.55 | 0.58 | 0.60 | 0.57 | 0.60 | |
| Total Deaths | 10,717 | 12,505 | 13,891 | 15,693 | 17,222 | 17,101 | 17,610 | 18,027 | 18,481 | 18,938 | 19,393 | 19,862 | ||||||||||
| Crude Death Rate (Per 1,000 residents) | 12.0 | 8.1 | 6.2 | 5.4 | 5.2 | 5.1 | 4.9 | 4.9 | 4.7 | 4.8 | 4.5 | 4.4 | 4.4 | 4.5 | 4.4 | 4.3 | 4.4 | 4.5 | 4.5 | 4.6 | 4.7 | |
| Infant Mortality Rate (Per 1,000 resident live-births) | 82.2 | 49.5 | 34.9 | 26.3 | 20.5 | 13.9 | 8.0 | 7.6 | 6.6 | 3.8 | 2.5 | 2.1 | 2.6 | 2.1 | 2.1 | 2.2 | 2.0 | 2.0 | 1.8 | 2.0 | 1.8 | |
| Life Expectancy at Birth (Years) | 65.8 | 72.1 | 75.3 | 78.0 | 81.7 | 82.0 | 82.1 | 82.4 | 82.8 | |||||||||||||
| Life Expectancy at Birth for Males (Years) | 64.1 | 69.8 | 73.1 | 76.0 | 79.2 | 79.5 | 79.8 | 80.1 | 80.5 | |||||||||||||
| Life Expectancy at Birth for Females (Years) | 67.8 | 74.7 | 77.6 | 80.0 | 84.0 | 84.1 | 84.3 | 84.5 | 84.9 | |||||||||||||
Immigration to Singapore also fell sharply after Singapore independence due to tighter control of immigration from Malaysia and other countries. The population increase became dominated by native births with 315,400 in the 1970–1980 period due to natural increase compared to 24,000 from net migration. However, a lower rate of natural growth in population and the need for low-skill labour resulted in a deliberate shift in policy by the Singapore government to allow more foreigners to live and work in the country, and net migration increased in the 1980–1990 period to nearly 200,000. By the decade of 1990–2000, the net migrant number of over 600,000 had surpassed the natural growth of the population, and accounted for nearly two-third of the population increase. The same high level of immigration is also seen in the next decade with 664,083 net migration recorded.[22]
| Net migration rate | 9.12 migrants/1,000 population (2006 est.) |
|---|
Due to the continued low birth rate, amongst other reasons, the Singapore government has varied its immigration policy over the years. As the demand for labour grew with industrialisation, foreign talent with professional qualifications as well as less-skilled foreign workers has made up a significant and increasing proportion of Singapore's total population since the 2000s and 2010s. Curbs on immigration, however, began to be implemented in the 2010s to ease increasing social issues arising from the high level of immigration.[32]
Population by area
The population of Singapore are generally housed within new towns, which are large scale satellite housing developments designed to be self contained. It includes public housing units, private housing, a town centre and other amenities.[33] Since the 1950s, Singapore had a city centre surrounded by slums and squatter colonies. By 1959 when Singapore attained self government, the problem of housing shortage had grown. Combined with a fast population growth, it led to congestion and squalor.[34] The new towns planning concept was introduced in July 1952 by the country's public housing authority, Housing and Development Board (HDB), to counter the housing shortage problem and to relocate most of the population crammed within the city centre to other parts of the island.[35][36] Today, there are 23 new towns and 3 estates within the country, with Bedok being the largest by area and population.[37]
Population policies
Population planning
| Period | Growth rate |
|---|---|
| 1947—1957 | 84.7% |
| 1957—1970 | 90.8% |
| 1970—1980 | 13.3% |
| 1980—1990 | 18.5% |
| 1990— 2000 | 20.6% |
The post-war boom in births led to an interest in family planning, and by 1960, the government publicly funded and supported family planning programmes. After independence in 1965, the birth rate had fallen to 29.5 per thousand individuals, and the natural growth rate had fallen to 2.5%. Birth rates in the 1960s were still perceived as high by the government; on average, a baby was born every 11 minutes in 1965. Kandang Kerbau Hospital (KKH)—which specialised in women's health and was the most popular hospital to have children—saw over 100 deliveries per day in 1962. In 1966, KKH delivered 39835 babies, earning it a place in the Guinness Book of World Records for "largest number of births in a single maternity facility" for ten years. Because there was generally a massive shortage of beds in that era, mothers with routine deliveries were discharged from hospitals within 24 hours.[38]
In September 1965 the Minister for Health, Yong Nyuk Lin, submitted a white paper to Parliament, recommending a "Five-year Mass Family Planning programme" that would reduce the birth rate to 20.0 per thousand individuals by 1970. In 1966, the Family Planning and Population Board (FPPB) had been established based on the findings of the white paper, providing clinical services and public education on family planning.[39]
By 1970, the Stop at Two campaign was firmly established, implementing incentives, disincentives and public exhortation to discourage families from having more than two children. After 1975, the fertility rate declined below replacement level, in a sign that Singapore was undergoing the demographic transition. In 1983, the Graduate Mothers' Scheme was implemented in an attempt to get educated women, especially women with a university degree, to marry and procreate, while the government encouraged women without an O-level degree to get sterilised. This was done out of the Lee Kuan Yew government's belief that for the nation to best develop and avoid hardship, the educated classes should be encouraged to contribute to the nation's breeding pool, while the uneducated should not, sparking the Great Marriage Debate.[39]
In 1986, the government reversed its population policy—except its stance on low-income, lowly-educated women—and initiated the Have Three or More (if you can afford it) campaign, offering cash and public administration incentives to have children. In 2001, the Singapore government started its Baby Bonus scheme.
As of 2012, Singapore total fertility rate (TFR) is 1.20 children born per woman, which represents a sub-replacement fertility rate and is one of the lowest in the world. Ethnic Chinese had a ferlility of 1.07 in 2004 (1.65 in 1990), while Malays had a TFR of 2.10 (2.69 in 1990). Both figures declined further in 2006. TFR for Indians was 1.30 in 2004 and 1.89 in 1990.[40] The Singapore government has launched several highly publicised attempts to raise the fertility rate and increase awareness of the negative effects of an ageing population, the elderly (65 and above) had constituted 9.9% of its population in 2012; this proportion is still significantly lower than that of many other developed nations, such as the United States and Japan..
2013 Population White Paper
In early 2013, the Singapore parliament debated over the policies recommended by the Population White Paper entitled A Sustainable Population for a Dynamic Singapore. Citing that Singapore's 900,000 Baby Boomers would comprise a quarter of the citizen population by 2030 and that its workforce would shrink "from 2020 onwards", the White Paper projected that by 2030, Singapore's "total population could range between 6.5 and 6.9 million", with resident population between 4.2 and 4.4 million and citizen population between 3.6 and 3.8 million. The White Paper called for an increase in the number of foreign workers so as to provide balance between the number of skilled and less-skilled workers, as well as provide healthcare and domestic services. It also claimed that foreign workers help businesses thrive when the economy is good.[41] The motion was passed[42] albeit after amendments made to leave out "population policy" and add focus on infrastructure and transport development.
The White Paper was heavily criticised and panned by opposition parties and government critics.[43] Member of Parliament Low Thia Khiang of the Workers' Party of Singapore had criticised current measures of increasing the fertility rate, claiming that the high cost of living and lack of family and social support discouraged young couples from having babies. As for current immigration policies, he had noted that immigrants were a source of friction for Singaporeans and that an increased population would put more stress on the already strained urban infrastructure.[44] On February 16, 2013, nearly 3,000 people rallied to protest against the White Paper and raise concerns that the increased population would lead to the deterioration of public service and the increase of the cost of living in the future.[45]
Ethnic groups
The ethnic groups of Singapore may be categorised using the CMIO system: the Chinese, Malays, Indians, and Others. The CMIO system is a framework of multiracialism developed to manage the diversity and differences in Singapore and integrate them into a single culture.[47] The Chinese form the largest ethnic group in Singapore.
Early census figures
Singapore, following its founding by Stamford Raffles in the 19th century, did not have a sizeable native population in the true sense of the word as the population became dominated numerically by three main groups of immigrants soon after Singapore was established as a free port by the British.[27][48][49] It was estimated that when Raffles arrived in Singapore in January 1819, Singapore had about 120 Malays, 30 Chinese and some native tribes (the Orang Laut) under the rule of the Temenggung.[50] Around 100 of the Malays had originally moved to Singapore from the mainland (Johor) in 1811 led by the Temenggung. Another estimate put the total population of the whole of Singapore at 1,000, mostly of various local tribes.[23] Early census figures of Singapore show a long period of influx of migrant workers into the country, initially mostly Malays, quickly followed by the Chinese. By 1821, the population was estimated to have increased to 4,724 Malays and 1,150 Chinese.[50] In the first census of 1824, 6,505 out of the 10,683 total were Malays and Bugis, constituting over 60% of the population. Large number of Chinese migrants started to enter Singapore just months after it became a British settlement, and they were predominantly male. In 1826, official census figures give a total population of 13,750, with 6,088 Chinese, 4,790 Malays, 1,242 Bugis, 1,021 Indians from Bengal (244) and the Coromandel Coast (777), smaller number of Javanese (267), Europeans (87) and other peoples.[25] The population total of Singapore increased to 16,000 in 1829, 26,000 five years later. By 1836, the Chinese at 13,749 had become the most populous ethnic group, overtaking the broad Malay grouping (12,538, including other groups such as the Bugis, Javanese, and Balinese from the Dutch East Indies).[51] By 1849, the population had reached 59,043, 24,790 of them Chinese.[52]
Many of the migrants from China in the 19th century came to work on the pepper and gambier plantations, with 11,000 Chinese immigrants recorded in one year.[53] Singapore became one of the entry and dispersal points for large number of Chinese and Indian migrants who came to work in the plantations and mines of the Straits Settlements, many of whom then settled in Singapore after their contract ended. By 1860, the total population had reached around 90,000, of these 50,000 were Chinese, and 2,445 Europeans and Eurasians. The first thorough census in Singapore was undertaken in 1871, and the people were grouped into 33 racial, ethnic or national categories, with Chinese forming the largest group at 57.6%.[54] Censuses were then conducted at 10 year intervals afterwards. The 1881 census grouped the people into 6 main categories, and further subdivided into 47 sub-categories. The 6 broad groups were given as Europeans, Eurasians, Malays, Chinese, Indians and Others in 1921.[47] The Malays group included other natives of the Malay archipelago, the Europeans included Americans, the Indians would be people from the Indian subcontinent including what are now Pakistan and Bangladesh. In 1901, the total population of Singapore was 228,555,[53] with 15.8% Malays, 71.8% Chinese, 7.8% Indians, and 3.5% Europeans and Eurasians. The Chinese population figure of Singapore has stayed at over 70% of the total since, reaching 77.8% in 1947. After dropping from a peak of 60% in the early years of Singapore, the Malay population settled within the range of 11 and 16% in the first half of the 20th century, while Indians hovered between 7 and just over 9% in the same period.[51]
| Ethnic Group | PopulationA | ||||||
|---|---|---|---|---|---|---|---|
| 1824[55] | 1826[25] | 1836[26] | 1871[56] | 1901[56] | 1931[56][57] | 1957[58] | |
| Europeans | 74 | 87 | 141 | 1,946 | 3,824 | 8,082 | 10,826 |
| Eurasians | 117 | 2,164 | 4,120 | 6,903 | 11,382 | ||
| Native ChristiansB | 188 | 421 | |||||
| Armenians | 16 | 19 | 34 | (81) | |||
| Arabs | 15 | 26 | 41 | ||||
| MalaysC | 4,580 | 4,790 | 9,632 | 26,148 | 36,080 | 65,014 | 197,059 |
| Bugis | 1,925 | 1,242 | 1,962D | ||||
| Javanese | 267 | 903 | |||||
| Chinese | 3,317 | 6,088 | 13,749 | 54,572 | 164,041 | 418,640 | 1,090,596 |
| Indians | 756 | 1,021 | 2,930 | 11,610 | 17,824 | 50,811 | 124,084 |
| OthersE | 12 | 50 | 671 | 2,667 | 8,275 | 11,982 | |
| Total | 10,683 | 13,750 | 29,980 | 97,111 | 228,555 | 557,745 | 1,445,929 |
- ^A Population figures do not include transient populations of military personnel and convicts
- ^B Mostly of Portuguese descent
- ^C Include other peoples of the Malay Archipelago if figures not given separately
- ^D Include Balinese
- ^E Include Cafres, Siamese, Parsis, Jews, and other groupings if figures not given separately.
| Ethnic group | 1824–1830 | 1849–1860 | 1881–1891 | 1901–1911 | 1931–1947 |
|---|---|---|---|---|---|
| Chinese | 12.0% | 5.4% | 3.5% | 3.0% | 3.5% |
| Malays | 2.9% | 5.2% | 0.1% | 1.5% | 3.6% |
| Indians | 6.7% | 6.8% | 2.9% | 5.0% | 1.9% |
Post-independence census figures
In the post independence period, the population of Singapore became categorised into four main groups: Chinese, Malays, Indians, and Others (the CMIO system). It was first proposed in 1956 to organise the education system of Singapore in the four national languages, and the proposal can be seen as the first manifestation of this multiracial approach.[47]
Although population growth in Singapore was driven by immigration for a long period during the colonial period, the population increase in Singapore became dominated by native births in Singapore around the middle of the 20th century, which boomed after the Second World War. After Singapore became independent in 1965, the free movement of people between Malaysia and Singapore ended, and net immigration dropped to a low level of 24,000 in the decade of 1970–80 due to tighter control on immigration.[22] However, the fertility of the Chinese population declined sharply after the post-war boom, while that of the Malays remained high. There was therefore a corresponding percentage increase of the Malay population, which rose to 14.5% in 1967 after a long period of continual decline.[27]
From the 1980s onwards, the policy on immigration changed; the number of immigrants increased sharply and became again an important factor in the growth of population in Singapore. By the 1990–2000 period, the number of migrants had overtaken the natural population increase, constituting nearly two-third of the decadal population increase with 640,571 net migrants including non-residents.[22] While the racial composition of its citizens has been fairly constant in recent years, it shows a shift in the figures for its residents (citizens plus permanent residents).[2] Fewer of the immigrants were Malays, therefore the percentage resident population of the Malays began to fall. Indian residents, however, rose to 9.2% in 2010 due to an increase in the number of Indians migrant workers (compared to 7.4% Indians in the figures for citizens).[59]
| Ethnic group | 1970[60] | 1980[60] | 1990[19] | 2000[19] | 2010[19] | 2011[19] | 2012[19] | 2013[19] | 2015[61] | 2018[62] |
|---|---|---|---|---|---|---|---|---|---|---|
| Chinese | 77.0% | 78.3% | 77.8% | 76.8% | 74.1% | 74.1% | 74.2% | 74.2% | 74.3% | 74.3% |
| Malays | 14.8% | 14.4% | 14.0% | 13.9% | 13.4% | 13.4% | 13.3% | 13.3% | 13.3% | 13.4% |
| Indians | 7.0% | 6.3% | 7.1% | 7.9% | 9.2% | 9.2% | 9.2% | 9.1% | 9.1% | 9.0% |
| Others | 1.2% | 1.0% | 1.1% | 1.4% | 3.3% | 3.3% | 3.3% | 3.3% | 3.2% | 3.2% |
| Year | 1980 | 1990 | 2000 | 2007 | 2008 | 2009 | 2010 | 2011 | 2012 | 2013 | 2014 | 2015 | 2016 | 2017 | 2018 |
|---|---|---|---|---|---|---|---|---|---|---|---|---|---|---|---|
| Chinese | 1.73 | 1.65 | 1.43 | 1.14 | 1.14 | 1.08 | 1.02 | 1.08 | 1.18 | 1.05 | 1.13 | 1.10 | 1.07 | 1.01 | 0.98 |
| Malays | 2.20 | 2.69 | 2.54 | 1.94 | 1.91 | 1.82 | 1.65 | 1.64 | 1.69 | 1.66 | 1.73 | 1.79 | 1.80 | 1.82 | 1.85 |
| Indians | 2.03 | 1.89 | 1.59 | 1.25 | 1.19 | 1.14 | 1.13 | 1.09 | 1.15 | 1.11 | 1.13 | 1.15 | 1.04 | 1.00 | 1.00 |
| Total | 1.82 | 1.83 | 1.60 | 1.29 | 1.28 | 1.22 | 1.15 | 1.20 | 1.29 | 1.19 | 1.25 | 1.24 | 1.20 | 1.16 | 1.14 |
| Age groups | 0–14 | 15–64 | 65-over |
|---|---|---|---|
| Chinese | 14.0% | 72.7% | 13.3% |
| Malays | 19.3% | 72.9% | 7.8% |
| Indians | 19.4% | 73.0% | 7.6% |
The population profile of the country change dramatically after the relaxation of immigration policy, with a huge increase in the number of transient migrant workers. Official figures show that the number of foreigners on short-term permits (termed 'non-residents') has grown from 30,900 in 1970 to 797,900 in 2005, which translate roughly to a 24-fold increase in 35 years, or from 1% of the population in 1970 to 18.3% in 2005. Despite this huge increase, no further breakdown is given by Singstat. By 2010, the population of non-residents had increased to 25.7%. It was estimated in the mid-2010s that around 40% of Singapore's population were of foreign origin (permanent residents plus non-residents such as foreign students and workers including dependents).[64]
| 1970 | 1980 | 1990 | 2000 | 2009 | 2014 | |
|---|---|---|---|---|---|---|
| Non-residents (Residents = Citizens + PRs) | 2.9% | 5.5% | 10.2% | 18.7% | 25.3% | 29.3% |
While the Singapore Department of Statistics reports overall population figures for Singapore (4.48 million in 2006), as a matter of policy, it only provides more detailed demographic breakdown analysis for the approximately 80% of the population (in 2006) who are Singapore citizens and Permanent Residents (collectively termed 'residents'). Of this group of about 3.6 million people in 2006, Chinese form 75.2%, Malays form 13.6%, Indians form 8.8%, while Eurasians and other groups form 2.4%. No breakdown by ethnicity is released for the non-resident population. Currently around 60,000[65] Europeans and 16,900 Eurasians live in Singapore, over 1% of its total population.
Languages
.jpg)
There are four official languages: English, Malay, Mandarin and Tamil.
Malay is the national language of the country, although English is the official language used. English serves as the link between the different ethnic groups and is the language of the educational system and the administration. The colloquial English-based creole used in everyday life is often referred to as Singlish.
The government of Singapore has been promoting the use of Mandarin, the official form of Chinese in Singapore as well as mainland China and Taiwan, with its Speak Mandarin Campaign among the Chinese population. The use of other Chinese varieties, like Hokkien, Teochew, Cantonese, Hainanese and Hakka, has been declining over the last two decades, although they are still being used especially by the older generations of the Chinese population.
About 50% of Singaporean Indians speaks Tamil as their native language.[67] Other widely spoken Indian languages are Punjabi, Malayalam, Hindi and Telugu, but none of them alone is spoken by more than 10% of the Indian Singaporeans.[68]
Around 5,000 Peranakans, the early Chinese population of the region, still use the Hokkien-influenced Malay dialect called Baba Malay.
Religion
The main religions of Singapore are Buddhism, Taoism, Islam, Christianity, and Hinduism, with a significant number who profess no religion.[69][70]
Singapore generally allows religious freedom, although the authorities restrict or ban some religious sects (such as Jehovah's Witnesses, due to their opposition to National Service). The majority of Malays are Muslim, while the plurality of Chinese practise Buddhism and syncretic Chinese folk traditions. Christianity is growing among the Chinese, having overtaken Taoism as second-most important religion in the 2000 census among this ethnic group as more Chinese increasingly described themselves as Buddhists rather than Taoist.[70] Indians are mostly Hindus though many are Muslims, Sikhs, and Christians. People who practise no religion form the third-largest group in Singapore.[71]
Marriage and divorce
| 2008 | 2009 | 2010 | 2011 | 2012 | 2013 | 2014 | 2015 | 2016 | 2017 | |
|---|---|---|---|---|---|---|---|---|---|---|
| Number of marriages (excluding previously married) | 24,596 | 26,081 | 24,363 | 27,258 | 27,936 | 26,254 | 28,407 | |||
| Number of divorces (not including divorces under Muslim law) | 5,170 | 5,416 | 5,433 | 5,696 | 5,306 | 5,471 | 5,172 | 5,450 | 5,505 | 5,570 |
| Median age of first marriage (years) | ||||||||||
| …Grooms | 29.8 | 29.8 | 30.0 | 30.1 | 30.1 | 30.1 | 30.2 | |||
| …Brides | 27.3 | 27.5 | 27.7 | 28.0 | 28.0 | 28.1 | 28.2 | |||
| General marriage rate | ||||||||||
| …Males (per 1,000 unmarried resident males aged 15 to 49) | 43.5 | 43.4 | 39.3 | 43.5 | 43.8 | 40.5 | 44.4 | |||
| …Females (per 1,000 unmarried resident females aged 15 to 49) | 39.6 | 38.9 | 35.3 | 39.2 | 39.4 | 36.9 | 40.8 | |||
| Median Age at Divorce (Years) | ||||||||||
| …Grooms | 39.9 | 40.5 | 41.0 | 41.3 | 41.6 | 42.4 | 42.6 | |||
| …Brides | 36.3 | 36.9 | 37.4 | 37.7 | 38.0 | 38.2 | 38.4 | |||
| General divorce rate | ||||||||||
| …Males (Per 1,000 married resident males aged 20 years and over) | 7.5 | 7.5 | 7.5 | 7.6 | 7.1 | 7.3 | 7.0 | |||
| …Females (Per 1,000 married resident females aged 20 years and over) | 7.3 | 7.1 | 7.2 | 7.2 | 6.7 | 6.9 | 6.5 | |||
| Crude marriage rate (per 1,000 resident population) | 6.7 | |||||||||
| Crude rate of marital dissolution (per 1,000 resident population) | 2.0 | |||||||||
The divorce rate has doubled over the last decade, and as of 2003, for every ten marriages registered in Singapore, almost three ended in divorce. The Women's Charter protects the women's financial interests during a divorce, often requiring the husband to contribute to the support of his divorced wife and their children.
Literacy and education
| Year | 1960 | 1970 | 1980 | 1990 | 2000 | 2010 | 2011 | 2012 | 2013 | 2014 | 2015 | 2016 | 2017 | 2018 | 2019 |
|---|---|---|---|---|---|---|---|---|---|---|---|---|---|---|---|
| Total | 52.6% | 68.9% | 82.3% | 89.1% | 92.5% | 95.9% | 96.2% | 96.4% | 96.6% | 96.7% | 96.8% | 97.0% | 97.2% | 97.3% | 97.5% |
| Male | 70.3% | 83.0% | 91.4% | 95.1% | 96.6% | 98.0% | 98.4% | 98.5% | 98.5% | 98.6% | 98.6% | 98.7% | 98.8% | 98.9% | 98.9% |
| Female | 32.8% | 54.3% | 73.1% | 83.0% | 88.6% | 93.8% | 94.1% | 94.4% | 94.7% | 94.9% | 95.2% | 95.4% | 95.7% | 95.9% | 96.1% |
| Highest qualification attained | 2001 | 2011 |
|---|---|---|
| Below secondary | 46.9% | 33.4% |
| Secondary | 24.1% | 19.6% |
| Post-secondary (non tertiary) | 6.6% | 8.9% |
| Diploma or professional qualification | 8.9% | 13.6% |
| University | 13.6% | 24.5% |
Among residents aged 25–39 years, the percentage of university graduates increased from 23.7% in 2001 to 45.9% in 2011 while that who had attained a diploma or professional qualification increased from 15.9% to 22.9% over the same period.[19]
Employment
In 2005, the unemployment rate for persons aged 15 years and over was 2.5%, the lowest in the last four years, with a labour force of 2.3 million people.[74][75][76]
| Year | Employment change | Employment in December 2012 | ||||||||||
|---|---|---|---|---|---|---|---|---|---|---|---|---|
| 2002 | 2003 | 2004 | 2005 | 2006 | 2007 | 2008 | 2009 | 2010 | 2011 | 2012 | ||
| Total | −22.9 | −12.9 | 71.4 | 113.3 | 176.0 | 234.9 | 221.6 | 37.6 | 115.9 | 122.6 | 129.1 | 3,357.6 |
| Total (excluding foreign domestic workers) | −23.6 | −11.7 | 66.4 | 105.5 | 168.0 | 223.5 | 213.4 | 32.9 | 110.6 | 117.7 | 125.8 | 3,148.0 |
| Locals | 19.4 | 14.9 | 49.9 | 63.5 | 90.9 | 90.4 | 64.7 | 41.8 | 56.2 | 37.9 | 58.7 | 2,089.3 |
| Foreigners | −42.3 | −27.9 | 21.5 | 49.8 | 85.1 | 144.5 | 156.9 | −4.2 | 59.7 | 84.8 | 70.4 | 1,268.3 |
| Foreigners (excluding foreign domestic workers) | −43.0 | −26.6 | 16.5 | 42.0 | 77.1 | 133.1 | 148.7 | −8.9 | 54.4 | 79.8 | 67.1 | 1,058.7 |
| Year | 2002 | 2003 | 2004 | 2005 | 2006 | 2007 | 2008 | 2009 | 2010 | 2011 | 2012 | 2013 | 2014 |
|---|---|---|---|---|---|---|---|---|---|---|---|---|---|
| Overall | 3.6 | 4.0 | 3.4 | 3.1 | 2.7 | 2.1 | 2.2 | 3.0 | 2.2 | 2.0 | 2.0 | 2.0 | 2.0 |
| Residents | 4.8 | 5.2 | 4.4 | 4.1 | 3.6 | 3.0 | 3.2 | 4.3 | 3.1 | 2.9 | 2.8 | ||
| Singapore Citizens | 5.1 | 5.4 | 4.8 | 4.4 | 3.7 | 3.1 | 3.4 | 4.5 | 3.4 | 3.0 | 3.0 |
Household income
Average household monthly income
The average household monthly income was SGD 4,943 in 2000, which was an increase of $3,080 in 1990 at an average annual rate of 4.9%. The average household income experienced a drop of 2.7% in 1999 due to economic slowdown. Measured in 1990 dollars, the average household monthly income rose from SGD$3,080 in 1990 to SGD$4,170 in 2000 at an average annual rate of 2.8%.[79]
| Year | 1990 | 1995 | 1997 | 1998 | 1999 | 2000 | 2010 | 2011 | 2017 |
|---|---|---|---|---|---|---|---|---|---|
| Average income | 3,076 | 4,107 | 4,745 | 4,822 | 4,691 | 4,943 | 8,726 | 9,618 | 11,589 |
| Median income | 2,296 | 3,135 | 3,617 | 3,692 | 3,500 | 3,607 | 5,600 | 6,307 | 8,846 |
| Ethnic group | Average household income |
Median household income | ||||
|---|---|---|---|---|---|---|
| 1990 | 2000 | 2010[81] | 1990 | 2000 | 2010[81] | |
| Total | 3,076 | 4,943 | 7,214 | 2,296 | 3,607 | 5,000 |
| Chinese | 3,213 | 5,219 | 7,326 | 2,400 | 3,848 | 5,100 |
| Malays | 2,246 | 3,148 | 4,575 | 1,880 | 2,708 | 3,844 |
| Indians | 2,859 | 4,556 | 7,664 | 2,174 | 3,387 | 5,370 |
| Others | 3,885 | 7,250 | 2,782 | 4,775 | ||
Household income distribution
| Year | 2000 | 2001 | 2002 | 2003 | 2004 | 2005 | 2006 | 2007 | 2008 | 2009 | 2010 | 2011 | 2012 | 2013 | 2014 | 2015 | 2016 | 2017 | 2018 | 2019 |
|---|---|---|---|---|---|---|---|---|---|---|---|---|---|---|---|---|---|---|---|---|
| No working person | 8.6 | 6.9 | 9 | 9.7 | 9.8 | 10 | 9 | 8.6 | 8.6 | 9.6 | 10.5 | 9.3 | 9.2 | 9.4 | 10.4 | 9.7 | 10.8 | 11.8 | 12.1 | 13.2 |
| Retiree households | 2.6 | 2.3 | 3 | 3.6 | 3.7 | 3.5 | 4.1 | 4.1 | 3.8 | 4 | 4.1 | 4.5 | 4.7 | 4.9 | 5.7 | 5.3 | 6.1 | 6.9 | 7.1 | 7.9 |
| Below $1,000 | 3.3 | 3.9 | 4 | 4.6 | 4.3 | 4.3 | 4.4 | 4.3 | 3.8 | 4.1 | 3.5 | 3.2 | 3 | 2.7 | 2.3 | 2 | 2 | 1.9 | 1.9 | 1.8 |
| $1,000–$1,999 | 12.2 | 11.1 | 11.5 | 11.1 | 11.4 | 10.9 | 10.5 | 9.8 | 8.3 | 7.8 | 7 | 6.5 | 6.2 | 6.2 | 5.9 | 5.7 | 5.5 | 5.4 | 5.3 | 5.1 |
| $2,000–$2,999 | 13.2 | 12.7 | 12.5 | 11.9 | 12.2 | 11.4 | 11.2 | 10 | 8.6 | 8.6 | 8.2 | 7.1 | 6.3 | 6.3 | 5.8 | 5.8 | 5.4 | 5.1 | 5.2 | 4.9 |
| $3,000–$3,999 | 12.6 | 11.5 | 11.6 | 11.7 | 11.4 | 10.7 | 10.8 | 9.7 | 8.5 | 8.9 | 8.3 | 7.6 | 6.6 | 6.7 | 6 | 5.5 | 5.3 | 5.5 | 5.2 | 5.2 |
| $4,000–$4,999 | 10.2 | 9.8 | 9.5 | 9.4 | 9.6 | 9.1 | 8.9 | 8.8 | 8.4 | 8.1 | 7.9 | 7.2 | 7 | 6.3 | 5.9 | 5.9 | 5.4 | 5.2 | 5.3 | 5.4 |
| $5,000–$5,999 | 8.3 | 8.3 | 8.1 | 7.9 | 7.9 | 7.9 | 8.1 | 7.7 | 7.3 | 7.5 | 7.4 | 7 | 6.8 | 6.4 | 6.1 | 5.7 | 5.9 | 5.4 | 5.4 | 4.9 |
| $6,000–$6,999 | 6.7 | 6.7 | 6.4 | 6.9 | 6.3 | 6.4 | 6.9 | 6.8 | 6.4 | 6.9 | 6.7 | 6.5 | 6.1 | 5.8 | 5.8 | 5.8 | 5.8 | 5.2 | 5.2 | 4.9 |
| $7,000–$7,999 | 5.1 | 5.3 | 5.1 | 4.9 | 5.3 | 5.4 | 5.3 | 5.7 | 5.9 | 5.7 | 5.7 | 6 | 5.8 | 5.6 | 5.4 | 5.3 | 5.1 | 5.2 | 4.6 | 4.6 |
| $8,000–$8,999 | 4 | 4.3 | 4.3 | 4 | 4.1 | 4.5 | 4.4 | 4.7 | 5.1 | 4.7 | 5.1 | 5.4 | 5.4 | 5.1 | 5.1 | 5.3 | 4.9 | 5 | 4.7 | 4.6 |
| $9,000–$9,999 | 3.1 | 3.5 | 3.3 | 3.4 | 3.3 | 3.4 | 3.5 | 3.8 | 4.1 | 4.1 | 4.2 | 4.7 | 4.7 | 4.6 | 4.7 | 4.8 | 4.6 | 4.6 | 4.4 | 4.1 |
| $10,000–$10,999 | 2.4 | 2.9 | 2.8 | 2.7 | 2.7 | 2.8 | 2.9 | 3.3 | 3.8 | 3.7 | 3.8 | 4.1 | 4.1 | 4.4 | 4.7 | 4.3 | 4.6 | 4.3 | 4.3 | 4.2 |
| $11,000–$11,999 | 1.8 | 2.1 | 2.1 | 1.9 | 1.9 | 2.1 | 2.3 | 2.6 | 3.2 | 2.9 | 3 | 3.3 | 3.8 | 3.7 | 3.6 | 3.8 | 3.8 | 3.6 | 3.8 | 3.8 |
| $12,000–$12,999 | 1.5 | 1.8 | 1.5 | 1.5 | 1.5 | 1.8 | 1.9 | 1.9 | 2.4 | 2.4 | 2.6 | 2.7 | 3.3 | 3.4 | 3.3 | 3.6 | 3.5 | 3.2 | 3.2 | 3.4 |
| $13,000–$13,999 | 1.1 | 1.4 | 1.2 | 1.4 | 1.3 | 1.4 | 1.5 | 1.9 | 2 | 2.2 | 2.1 | 2.4 | 2.6 | 2.8 | 3 | 3 | 3 | 3 | 3.2 | 3 |
| $14,000–$14,999 | 0.9 | 1.1 | 1.1 | 1.1 | 1 | 1.1 | 1.2 | 1.4 | 1.7 | 1.8 | 1.8 | 2.1 | 2.2 | 2.6 | 2.6 | 2.7 | 2.6 | 2.7 | 2.6 | 2.8 |
| $15,000–$17,499 | 1.6 | 2 | 1.8 | 1.9 | 1.8 | 2.1 | 2 | 2.6 | 3.2 | 3.2 | 3.5 | 4.2 | 4.6 | 4.7 | 4.9 | 5.2 | 5.5 | 5.6 | 5.8 | 5.4 |
| $17,500–$19,999 | 1 | 1.4 | 1.2 | 1.1 | 1.2 | 1.3 | 1.4 | 1.7 | 2.2 | 2.1 | 2.2 | 2.8 | 3.1 | 3.3 | 3.5 | 3.8 | 4 | 4.1 | 4.2 | 4.1 |
| $20,000 and over | 2.4 | 3.2 | 2.8 | 3 | 2.9 | 3.4 | 3.8 | 4.7 | 6.4 | 5.7 | 6.6 | 8 | 9.2 | 9.9 | 11 | 12.1 | 12.4 | 13.3 | 13.5 | 14.4 |
| Year | 2000 | 2001 | 2002 | 2003 | 2004 | 2005 | 2006 | 2007 | 2008 | 2009 | 2010 | 2011 | 2012 | 2013 | 2014 | 2015 | 2016 | 2017 | 2018 | 2019 |
|---|---|---|---|---|---|---|---|---|---|---|---|---|---|---|---|---|---|---|---|---|
| No working person | 8.6 | 6.9 | 9 | 9.7 | 9.8 | 10 | 9 | 8.6 | 8.6 | 9.6 | 10.5 | 9.3 | 9.2 | 9.4 | 10.4 | 9.7 | 10.8 | 11.8 | 12.1 | 13.2 |
| Retiree households | 2.6 | 2.3 | 3 | 3.6 | 3.7 | 3.5 | 4.1 | 4.1 | 3.8 | 4 | 4.1 | 4.5 | 4.7 | 4.9 | 5.7 | 5.3 | 6.1 | 6.9 | 7.1 | 7.9 |
| Below $1,000 | 3.9 | 4.4 | 4.6 | 5.2 | 4.8 | 4.8 | 4.9 | 4.7 | 4 | 4.3 | 3.7 | 3.4 | 3.2 | 2.9 | 2.4 | 2.2 | 2.1 | 2.1 | 2 | 2 |
| $1,000–$1,999 | 13.8 | 13.3 | 13.6 | 13 | 12.9 | 12.3 | 11.9 | 10.9 | 9.5 | 9 | 8.2 | 7.5 | 7 | 7.2 | 6.7 | 6.6 | 6.4 | 6.2 | 6.1 | 5.9 |
| $2,000–$2,999 | 14.7 | 14.2 | 14.1 | 13.9 | 13.6 | 12.7 | 12.4 | 11.2 | 9.8 | 9.9 | 9.3 | 8.3 | 7.3 | 7.2 | 6.7 | 6.5 | 6 | 6 | 6 | 5.5 |
| $3,000–$3,999 | 13.1 | 12.6 | 12.4 | 12.2 | 12.2 | 11.5 | 11.3 | 10.6 | 9.7 | 9.9 | 9.3 | 8.3 | 7.7 | 7.4 | 7 | 6.7 | 6.4 | 6.2 | 6 | 6.2 |
| $4,000–$4,999 | 10.3 | 10 | 9.8 | 9.7 | 9.8 | 9.4 | 9.5 | 9.2 | 8.9 | 8.5 | 8.6 | 8.2 | 8 | 7.4 | 6.8 | 6.5 | 6.5 | 6.1 | 6.3 | 5.8 |
| $5,000–$5,999 | 8.2 | 8.3 | 7.9 | 8.2 | 7.8 | 7.9 | 8.2 | 7.9 | 7.6 | 8.2 | 7.8 | 7.5 | 7.3 | 6.9 | 6.7 | 6.7 | 6.7 | 6.3 | 6 | 6 |
| $6,000–$6,999 | 6.3 | 6.3 | 6.1 | 6 | 6 | 6.3 | 6.4 | 6.7 | 6.4 | 6.7 | 6.6 | 6.7 | 6.4 | 6.3 | 6.1 | 6.1 | 6 | 5.8 | 5.5 | 5.4 |
| $7,000–$7,999 | 4.6 | 4.7 | 4.8 | 4.6 | 4.8 | 5 | 4.9 | 5.3 | 5.9 | 5.2 | 5.6 | 6 | 5.9 | 5.8 | 5.7 | 5.9 | 5.6 | 5.7 | 5 | 5 |
| $8,000–$8,999 | 3.5 | 3.9 | 3.6 | 3.6 | 3.8 | 3.9 | 3.9 | 4.2 | 4.6 | 4.6 | 4.8 | 5.2 | 5.3 | 5 | 5.2 | 5 | 5.3 | 5 | 5.2 | 4.6 |
| $9,000–$9,999 | 2.6 | 3 | 2.9 | 2.6 | 2.7 | 2.8 | 3 | 3.4 | 3.9 | 3.7 | 3.9 | 4.2 | 4.2 | 4.6 | 4.7 | 4.5 | 4.5 | 4.5 | 4.4 | 4.5 |
| $10,000–$10,999 | 2.1 | 2.2 | 2.3 | 2.2 | 2.1 | 2.4 | 2.6 | 3 | 3.4 | 3.4 | 3.4 | 3.7 | 4.2 | 4.3 | 4 | 4.3 | 4.3 | 3.9 | 4.2 | 4.2 |
| $11,000–$11,999 | 1.5 | 1.7 | 1.3 | 1.5 | 1.6 | 1.8 | 1.9 | 1.9 | 2.5 | 2.4 | 2.6 | 2.7 | 3.2 | 3.3 | 3.3 | 3.5 | 3.5 | 3.4 | 3.6 | 3.5 |
| $12,000–$12,999 | 1.2 | 1.4 | 1.3 | 1.3 | 1.4 | 1.5 | 1.6 | 2 | 2 | 2.3 | 2.2 | 2.5 | 2.6 | 3 | 3.1 | 3.2 | 3 | 3 | 3.1 | 3.2 |
| $13,000–$13,999 | 0.9 | 1.1 | 1 | 1.1 | 1 | 1.2 | 1.2 | 1.5 | 1.6 | 1.8 | 1.8 | 2.1 | 2.3 | 2.5 | 2.5 | 2.7 | 2.8 | 2.7 | 2.7 | 2.6 |
| $14,000–$14,999 | 0.7 | 0.8 | 0.7 | 0.7 | 0.7 | 0.9 | 0.9 | 1.1 | 1.4 | 1.4 | 1.5 | 1.8 | 1.9 | 2.1 | 2.3 | 2.2 | 2.3 | 2.4 | 2.4 | 2.4 |
| $15,000–$17,499 | 1.3 | 1.6 | 1.5 | 1.4 | 1.5 | 1.7 | 1.6 | 2.1 | 2.7 | 2.6 | 2.8 | 3.6 | 3.8 | 4 | 4.1 | 4.4 | 4.6 | 4.9 | 5.1 | 4.8 |
| $17,500–$19,999 | 0.8 | 1.1 | 1 | 0.9 | 0.9 | 1 | 1.3 | 1.5 | 1.8 | 1.6 | 1.8 | 2.2 | 2.6 | 2.6 | 2.9 | 3.2 | 3.3 | 3.4 | 3.2 | 3.5 |
| $20,000 and over | 2 | 2.5 | 2.2 | 2.3 | 2.5 | 2.9 | 3.4 | 4.2 | 5.5 | 4.9 | 5.7 | 6.8 | 7.7 | 8.3 | 9.2 | 10.1 | 9.9 | 10.7 | 11.1 | 11.7 |
Growth in household income by decile
With the recovery from the 1998 economic slowdown, household income growth had resumed for the majority of households in 2000. However, for the lowest two deciles, the average household income in 2000 had declined compared with 1999. This was mainly due to the increase in the proportion of households with no income earner from 75% in 1999 to 87% in 2000 for the lowest 10%. Households with no income earner include those with retired elderly persons as well as unemployed members.[83]
| Decile | Average monthly household income (SGD) | Nominal annual change (%) | |||||||||||||||||||||||||||
|---|---|---|---|---|---|---|---|---|---|---|---|---|---|---|---|---|---|---|---|---|---|---|---|---|---|---|---|---|---|
| 2000 | 2001 | 2002 | 2003 | 2004 | 2005 | 2006 | 2007 | 2008 | 2009 | 2010 | 2011 | 2012 | 2013 | 2014 | 2001 | 2002 | 2003 | 2004 | 2005 | 2006 | 2007 | 2008 | 2009 | 2010 | 2011 | 2012 | 2013 | 2014 | |
| Total | 5,947 | 6,417 | 6,229 | 6,276 | 6,285 | 6,593 | 6,792 | 7,431 | 8,414 | 8,195 | 8,726 | 9,618 | 10,348 | 10,469 | 11,143 | 7.9 | −2.9 | 0.8 | 0.1 | 4.9 | 3.0 | 9.4 | 13.2 | −2.6 | 6.5 | 10.2 | 7.6 | 1.2 | 6.4 |
| 1st – 10th | 1,382 | 1,331 | 1,266 | 1,223 | 1,232 | 1,257 | 1,258 | 1,321 | 1,399 | 1,361 | 1,497 | 1,581 | 1,644 | 1,711 | 1,775 | −3.7 | −4.9 | −3.4 | 0.7 | 2.0 | 0.1 | 5.0 | 5.9 | −2.7 | 10.0 | 5.6 | 4.0 | 4.1 | 3.7 |
| 11th – 20th | 2,241 | 2,275 | 2,180 | 2,164 | 2,199 | 2,257 | 2,305 | 2,418 | 2,700 | 2,696 | 2,940 | 3,135 | 3,302 | 3,372 | 3,641 | 1.5 | −4.2 | −0.7 | 1.6 | 2.6 | 2.1 | 4.9 | 11.7 | −0.1 | 9.1 | 6.6 | 5.3 | 2.1 | 8.0 |
| 21st – 30th | 2,986 | 3,043 | 2,944 | 2,984 | 2,988 | 3,116 | 3,182 | 3,379 | 3,831 | 3,787 | 4,158 | 4,421 | 4,782 | 4,993 | 5,226 | 1.9 | −3.3 | 1.4 | 0.1 | 4.3 | 2.1 | 6.2 | 13.4 | −1.1 | 9.8 | 6.3 | 8.2 | 4.4 | 4.7 |
| 31st – 40th | 3,683 | 3,867 | 3,722 | 3,746 | 3,786 | 4,020 | 4,038 | 4,335 | 4,906 | 4,978 | 5,418 | 5,794 | 6,183 | 6,376 | 6,863 | 5.0 | −3.7 | 0.6 | 1.1 | 6.2 | 0.4 | 7.4 | 13.2 | 1.5 | 8.8 | 6.9 | 6.7 | 3.1 | 7.6 |
| 41st – 50th | 4,505 | 4,680 | 4,572 | 4,637 | 4,648 | 4,859 | 4,971 | 5,358 | 6,055 | 5,980 | 6,603 | 7,032 | 7,608 | 7,993 | 8,303 | 3.9 | −2.3 | 1.4 | 0.2 | 4.5 | 2.3 | 7.8 | 13.0 | −1.2 | 10.4 | 6.5 | 8.2 | 5.1 | 3.9 |
| 51st – 60th | 5,304 | 5,677 | 5,522 | 5,638 | 5,504 | 5,865 | 6,027 | 6,561 | 7,492 | 7,319 | 7,840 | 8,436 | 9,133 | 9,469 | 10,108 | 7.0 | −2.7 | 2.1 | −2.4 | 6.6 | 2.8 | 8.9 | 14.2 | −2.3 | 7.1 | 7.6 | 8.3 | 3.7 | 6.7 |
| 61st – 70th | 6,354 | 6,751 | 6,664 | 6,725 | 6,633 | 7,136 | 7,180 | 7,928 | 8,957 | 8,798 | 9,310 | 10,101 | 10,894 | 11,293 | 11,861 | 6.2 | −1.3 | 0.9 | −1.4 | 7.6 | 0.6 | 10.4 | 13.0 | −1.8 | 5.8 | 8.5 | 7.9 | 3.7 | 5.0 |
| 71st – 80th | 7,608 | 8,322 | 8,132 | 8,229 | 8,012 | 8,641 | 8,809 | 9,479 | 10,820 | 10,694 | 11,105 | 12,306 | 13,186 | 13,807 | 14,496 | 9.4 | −2.3 | 1.2 | −2.6 | 7.9 | 1.9 | 7.6 | 14.1 | −1.2 | 3.8 | 10.8 | 7.2 | 4.7 | 5.0 |
| 81st – 90th | 9,461 | 10,755 | 10,294 | 10,271 | 10,350 | 10,701 | 11,048 | 12,386 | 14,013 | 13,423 | 13,943 | 15,509 | 16,366 | 16,984 | 18,017 | 13.7 | −4.3 | −0.2 | 0.8 | 3.4 | 3.2 | 12.1 | 13.1 | −4.2 | 3.9 | 11.2 | 5.5 | 3.8 | 6.1 |
| 91st – 100th | 15,946 | 17,467 | 16,998 | 17,146 | 17,493 | 18,076 | 19,100 | 21,146 | 23,968 | 22,909 | 24,442 | 27,867 | 30,379 | 28,688 | 31,142 | 9.5 | −2.7 | 0.9 | 2.0 | 3.3 | 5.7 | 10.7 | 13.3 | −4.4 | 6.7 | 14.0 | 9.0 | −5.6 | 8.6 |
| Decile | Average monthly household income (SGD) | Nominal annual change (%) | |||||||||||||||||||||||
|---|---|---|---|---|---|---|---|---|---|---|---|---|---|---|---|---|---|---|---|---|---|---|---|---|---|
| 2000 | 2001 | 2002 | 2003 | 2004 | 2005 | 2006 | 2007 | 2008 | 2009 | 2010 | 2011 | 2012 | 2001 | 2002 | 2003 | 2004 | 2005 | 2006 | 2007 | 2008 | 2009 | 2010 | 2011 | 2012 | |
| Total | 5,456 | 5,736 | 5,572 | 5,618 | 5,761 | 6,052 | 6,280 | 6,889 | 7,752 | 7,549 | 8,058 | 8,864 | 9,515 | 5.1 | −2.9 | 0.8 | 2.5 | 5.1 | 3.8 | 9.7 | 12.5 | −2.6 | 6.7 | 10.0 | 7.3 |
| 1st – 10th | 1,285 | 1,209 | 1,151 | 1,112 | 1,140 | 1,162 | 1,165 | 1,223 | 1,300 | 1,264 | 1,385 | 1,460 | 1,518 | −5.9 | −4.8 | −3.4 | 2.5 | 1.9 | 0.3 | 5.0 | 6.3 | −2.8 | 9.6 | 5.4 | 4.0 |
| 11th – 20th | 2,062 | 2,040 | 1,956 | 1,942 | 2,009 | 2,064 | 2,114 | 2,218 | 2,464 | 2,462 | 2,679 | 2,834 | 2,985 | −1.1 | −4.1 | −0.7 | 3.5 | 2.7 | 2.4 | 4.9 | 11.1 | −0.1 | 8.8 | 5.8 | 5.3 |
| 21st – 30th | 2,737 | 2,717 | 2,627 | 2,668 | 2,721 | 2,833 | 2,903 | 3,078 | 3,464 | 3,436 | 3,759 | 3,988 | 4,290 | −0.7 | −3.3 | 1.6 | 2.0 | 4.1 | 2.5 | 6.0 | 12.5 | −0.8 | 9.4 | 6.1 | 7.6 |
| 31st – 40th | 3,367 | 3,434 | 3,312 | 3,330 | 3,431 | 3,645 | 3,673 | 3,950 | 4,420 | 4,495 | 4,887 | 5,200 | 5,529 | 2.0 | −3.6 | 0.5 | 3.0 | 6.2 | 0.8 | 7.5 | 11.9 | 1.7 | 8.7 | 6.4 | 6.3 |
| 41st – 50th | 4,097 | 4,149 | 4,043 | 4,103 | 4,200 | 4,390 | 4,514 | 4,870 | 5,455 | 5,391 | 5,959 | 6,303 | 6,800 | 1.3 | −2.6 | 1.5 | 2.4 | 4.5 | 2.8 | 7.9 | 12.0 | −1.2 | 10.5 | 5.8 | 7.9 |
| 51st – 60th | 4,830 | 5,015 | 4,884 | 4,981 | 4,978 | 5,301 | 5,477 | 5,962 | 6,753 | 6,601 | 7,090 | 7,587 | 8,196 | 3.8 | −2.6 | 2.0 | −0.1 | 6.5 | 3.3 | 8.9 | 13.3 | −2.3 | 7.4 | 7.0 | 8.0 |
| 61st – 70th | 5,773 | 5,971 | 5,891 | 5,936 | 6,005 | 6,458 | 6,535 | 7,234 | 8,107 | 7,972 | 8,450 | 9,147 | 9,806 | 3.4 | −1.3 | 0.8 | 1.2 | 7.5 | 1.2 | 10.7 | 12.1 | −1.7 | 6.0 | 8.2 | 7.2 |
| 71st – 80th | 6,919 | 7,365 | 7,187 | 7,273 | 7,256 | 7,846 | 8,046 | 8,694 | 9,849 | 9,733 | 10,142 | 11,193 | 11,973 | 6.4 | −2.4 | 1.2 | −0.2 | 8.1 | 2.5 | 8.1 | 13.3 | −1.2 | 4.2 | 10.4 | 7.0 |
| 81st – 90th | 8,631 | 9,557 | 9,144 | 9,142 | 9,443 | 9,797 | 10,203 | 11,491 | 12,916 | 12,354 | 12,887 | 14,307 | 15,038 | 10.7 | −4.3 | 0.0 | 3.3 | 3.7 | 4.1 | 12.6 | 12.4 | −4.4 | 4.3 | 11.0 | 5.1 |
| 91st – 100th | 14,862 | 15,905 | 15,524 | 15,688 | 16,425 | 17,021 | 18,170 | 20,174 | 22,797 | 21,784 | 23,345 | 26,622 | 29,012 | 7.0 | −2.4 | 1.1 | 4.7 | 3.6 | 6.8 | 11.0 | 13.0 | −4.4 | 7.2 | 14.0 | 9.0 |
Household income disparity
The disparity in household income had widened in 2000, reflecting the faster income growth for the higher-income households. The Gini coefficient, a measure of income inequality, rose from 0.446 in 1998 to 0.481 in 2000. Other measures of income inequality also indicated similar trend of increasing disparity in household income.[79] In the United Nations Development Programme Report 2004,[86] Singapore's Gini coefficient based on income is 0.425 in 1998, which is ranked 78 among 127 countries in income equality (see list of countries by income equality).
| Year | 2000 | 2001 | 2002 | 2003 | 2004 | 2005 | 2006 | 2007 | 2008 | 2009 | 2010 | 2011 | 2012 |
|---|---|---|---|---|---|---|---|---|---|---|---|---|---|
| Household income from work excluding employer CPF contributions per household member | 0.444 | 0.456 | 0.457 | 0.460 | 0.464 | 0.470 | 0.476 | 0.489 | 0.481 | 0.478 | 0.480 | 0.482 | 0.488 |
| Household income from work including employer CPF contributions per household member | 0.442 | 0.454 | 0.454 | 0.457 | 0.460 | 0.465 | 0.470 | 0.482 | 0.474 | 0.471 | 0.472 | 0.473 | 0.478 |
| Household income from work including employer CPF contributions per household member after accounting for government transfers and taxes | 0.434 | 0.437 | 0.433 | 0.446 | 0.446 | 0.449 | 0.444 | 0.467 | 0.449 | 0.448 | 0.452 | 0.448 | 0.459 |
| Year | 2000 | 2001 | 2002 | 2003 | 2004 | 2005 | 2006 | 2007 | 2008 | 2009 | 2010 | 2011 | 2012 |
|---|---|---|---|---|---|---|---|---|---|---|---|---|---|
| Household income from work excluding employer CPF contributions per household member | 7.74 | 8.68 | 8.49 | 8.51 | 8.81 | 9.26 | 9.3 | 9.52 | 9.61 | 9.25 | 9.43 | 9.12 | 9.18 |
| Household income from work including employer CPF contributions per household member | 7.75 | 8.58 | 8.82 | 8.81 | 8.87 | 9.06 | 9.23 | 9.38 | 9.64 | 9.43 | 9.35 | 9.19 | 9.14 |
| Household income from work including employer CPF contributions per household member after accounting for government transfers and taxes | 7.68 | 7.82 | 7.71 | 8.28 | 8.24 | 8.3 | 7.68 | 8.68 | 7.94 | 8.00 | 8.1 | 7.54 | 7.87 |
International rankings
| International rankings of Singapore | ||||||
|---|---|---|---|---|---|---|
| Social Rankings | ||||||
| United Nations | Population density | 3rd out of 239 (2014)[87] | ||||
| United Nations | Number of immigrants | 7th out of 192 (42.6% of Singapore's population are foreigners) ()[88] | ||||
| United Nations | Fertility rate | 197th out of 200 (2015)[89] | ||||
See also
References
- "Statistics Singapore - Population". Department of Statistics Singapore. Retrieved 21 December 2019.
- "2014 Population in Brief" (PDF). Archived from the original (PDF) on 13 May 2015.
- "World Directory of Minorities and Indigenous Peoples – Singapore : Malays". Archived from the original on 19 October 2012.
- Vasil, R K (2000). Governing Singapore: democracy and national development. Allen & Unwin. p. 96. ISBN 978-1-86508-211-0.
- "Constitution of the Republic of Singapore". Attorney-General's Chambers of Singapore website. Part XIII Section 152(2). Archived from the original on 17 June 2011. Retrieved 11 August 2011.
- "Assessment for Malays in Singapore". Archived from the original on 28 March 2016. Retrieved 28 March 2016.
- Kishore Mahbubani (14 June 2014). "Big Idea No. 5: Speak the National Language". The Straits Times. Archived from the original on 1 April 2018.
- "English Language Syllabus 2010" (PDF). Ministry of Education. Archived (PDF) from the original on 1 April 2018.
- "Eyeing China, Singapore sees Mandarin as its future". Asiaone. Archived from the original on 4 November 2010.
- Population Trends 2015 Archived 24 November 2015 at the Wayback Machine Department of Statistics, Singapore.
- "Statistics Singapore - Population". Department of Statistics Singapore. Retrieved 21 December 2019.
- "Total Fertility Rates". www.tablebuilder.singstat.gov.sg. Retrieved 19 September 2019.
- Lee Kuan Yew (22 June 2010). "Singapore releases 2010 population in Brief Report". Govmonitor. Archived from the original on 24 June 2010. Retrieved 23 June 2010.
- "Worldwide total fertility rates". worldpopulationreview.com. Retrieved 18 September 2019.
- "M810001 - Indicators On Population, Annual". Statistics Singapore.
- "M890151 - Land Area (As At December), Annual". Statistics Singapore.
- "Singapore Residents By Age Group, Ethnic Group And Gender, End June, Annual-Data.gov.sg". data.gov.sg. Retrieved 30 April 2018.
- "M810011 - Singapore Residents By Age Group, Ethnic Group And Sex, End June, Annual". Singapore Department of Statistics.
- Population Trends 2012 Archived 13 November 2012 at the Wayback Machine Department of Statistics, Singapore.
- topic3 Archived 11 September 2015 at the Wayback Machine (Population). Retrieved from Singapore – Yearbook of Statistics Singapore, 2015, Department of Statistics, Singapore. Retrieved on 28 August 2015.
- "Demographic Yearbook". UN Data. United Nations. Archived from the original on 27 December 2016. Retrieved 4 December 2015.
- Saw Swee-Hock (30 June 2012). The Population of Singapore (3rd ed.). ISEAS Publishing. pp. 11–18. ISBN 978-9814380980.
- Lily Zubaidah Rahim, Lily Zubaidah Rahim (9 November 2010). Singapore in the Malay World: Building and Breaching Regional Bridges. Taylor & Francis. p. 24. ISBN 9781134013975.CS1 maint: uses authors parameter (link)
- Bernard, F. J. (15 November 1884). "An Anecdotal History of Old Times in Singapore". The Straits Times. Archived from the original on 30 January 2018. Retrieved 20 January 2016.
- Wright, Arnold; Cartwright, H.A., eds. (1907). Twentieth century impressions of British Malaya: its history, people, commerce, industries, and resources. p. 37.
- The Penny Cyclopædia of the Society for the Diffusion of Useful Knowledge, Volume 22. Charles Knight. 30 March 2009. p. 41. ISBN 978-0824833541.
- Saw Swee-Hock (March 1969). "Population Trends in Singapore, 1819–1967". Journal of Southeast Asian History. 10 (1): 36–49. doi:10.1017/S0217781100004270. JSTOR 20067730.
- Census of the British empire. 1901. Great Britain Census Office. 1906. p. 123.
- James Francis Warren (30 June 2003). Rickshaw Coolie: A People's History of Singapore, 1880–1940. NUS Press. p. 19. ISBN 978-9971692667.
- Saw Swee-Hock (30 June 2012). The Population of Singapore (3rd ed.). ISEAS Publishing. p. 12. ISBN 978-9814380980.
- Wong, Theresa; Brenda Yeoh (2003). "Fertility and the Family: An Overview of Pro-natalist Population Policies in Singapore" (PDF). Asian Metacentre Research Paper Series (12). Archived from the original (PDF) on 27 July 2011. Retrieved 12 August 2011.
- Rachel Chang (3 August 2015). "No easy choices on foreign worker, immigrant policies: PM Lee". The Straits Times. Archived from the original on 16 January 2017.
- Wong, Maisy (July 2014). "Estimating the distortionary effects of ethnic quotas in Singapore using housing transactions". Journal of Public Economics. 115: 131–145. doi:10.1016/j.jpubeco.2014.04.006.
- Field, Brian (1 January 1992). "Singapore's New Town prototype: a textbook prescription?". Habitat International. 16 (3): 89–101. doi:10.1016/0197-3975(92)90066-8.
- "History of HDB". Housing & Development Board. Retrieved 20 January 2017.
- Tuan Seik, Foo (1 February 2001). "Planning and design of Tampines, an award-winning high-rise, high-density township in Singapore". Cities. 18 (1): 33–42. doi:10.1016/S0264-2751(00)00052-4.
- "[[Urban Redevelopment Authority|URA]] Planning Area Brochure – Bedok". Archived from the original on 16 February 2015. Retrieved 5 October 2014.
- "Family Planning". National Archives. Government of Singapore. Archived from the original on 12 August 2011. Retrieved 12 August 2011.
- "Singapore: Population Control Policies". Library of Congress Country Studies (1989). Library of Congress. Archived from the original on 11 April 2011. Retrieved 11 August 2011.
- Webb, Sara (26 April 2006). "Pushing for babies: S'pore fights fertility decline". Singapore Windows. Reuters. Archived from the original on 16 March 2007.
- A Sustainable Population for a Dynamic Singapore.
- Amended motion on white paper adopted; 6.9 million is not a target. Archived 4 March 2013 at the Wayback Machine The Straits Times. February 9, 2013.
- "Archived copy". Archived from the original on 1 March 2013. Retrieved 9 March 2013.CS1 maint: archived copy as title (link) The Workers’ Party’s Population Policy Paper: “A Dynamic Population for a Sustainable Singapore” The Workers' Party.
- A Sustainable Singapore with a Dynamic Singaporean majority – MP Low Thia Khiang Archived 15 March 2013 at the Wayback Machine The Workers' Party.
- "Rare Singapore protest against population plan". 17 February 2013. Archived from the original on 18 February 2013.
- "Population trend" (PDF). Singstat. Department of Statistics Singapore. Archived from the original (PDF) on 7 November 2017. Retrieved 5 November 2017.
- Zarine L. Rocha (2011). "Multiplicity within Singularity: Racial Categorization and Recognizing "Mixed Race" in Singapore". Journal of Current South East Asian Affairs. 30 (3). Archived from the original on 10 January 2017.
- Saw Swee-Hock (2007). The Population of Singapore. SEAS Publishing. p. 28. ISBN 978-9812307385.
- Swee-Hock Saw (1970). =Singapore population in transition. ISBN 9780812275889.
- Saw Swee-Hock (30 June 2012). The Population of Singapore (3rd ed.). ISEAS Publishing. pp. 7–8. ISBN 978-9814380980.
- Saw Swee-Hock (30 June 2012). The Population of Singapore (3rd ed.). ISEAS Publishing. p. 29. ISBN 978-9814380980.
- Pieris, Anoma (2009). Hidden Hands and Divided Landscapes: A Penal History of Singapore's Plural Society. University of Hawai'i Press. p. 238. ISBN 978-0824833541.
- Mrs Reginald Sanderson (1907). Wright, Arnold; Cartwright, H.A. (eds.). Twentieth century impressions of British Malaya: its history, people, commerce, industries, and resources. pp. 220–221.
- James Francis Warren (30 June 2003). Rickshaw Coolie: A People's History of Singapore, 1880–1940. NUS Press. p. 18. ISBN 978-9971692667.
- "First Census of Singapore is Taken". History SG. Archived from the original on 6 January 2017.
- Brenda S. A. Yeoh (30 April 2003). Contesting Space in Colonial Singapore: Power Relations and the Urban Built Environment. NUS Press. p. 317. ISBN 978-9971692681.
- "Armenian". Singapore Infopedia. National Library Board, Singapore. Archived from the original on 3 October 2016.
- Lim Peng Han. "The history of an emerging multilingual public library system and the role of mobile libraries in post colonial Singapore, 1956–1991" (PDF). Malaysian Journal of Library & Information Science. 1 (2): 85–108. Archived from the original (PDF) on 31 January 2017. Retrieved 19 January 2017.
- Saw Swee-Hock (30 June 2012). The Population of Singapore (3rd ed.). ISEAS Publishing. pp. 29–30. ISBN 978-9814380980.
- "Singapore Department of Statistics (DOS)". Department of Statistics Singapore. Archived from the original on 18 March 2018. Retrieved 30 April 2018.
- "Population Trends 2015" (PDF). Statistics Singapore. Archived from the original (PDF) on 10 October 2015. Retrieved 9 April 2016.
- Population Trends 2018
- "M810091 – Births And Fertility Rates, Annual". Department of Statistics Singapore.
- "These Five Countries Have The Highest Percentage Of Expats: Find Out Why". ExpatFocus. 10 December 2015. Archived from the original on 6 June 2017.
- "Speech by Second Minister for Foreign Affairs Ms Grace Fu at the Launch of 50 Years of SingaporeEuro".
- "East & Southeast Asia :: SINGAPORE". CIA The World Factbook. Archived from the original on 28 December 2010.
- "Census of Population 2010]" (table 6)" (PDF). Singapore Department of Statistics. Archived from the original (PDF) on 13 November 2013.
- Census of Population 2010 Statistical Release 1 – Demographic Characteristics, Education, Language and Religion Archived 5 October 2016 at the Wayback Machine
- Census of Population 2010 Statistical Release 1: Demographic Characteristics, Education, Language and Religion (PDF). Department of Statistics, Ministry of Trade & Industry, Republic of Singapore. January 2011. ISBN 978-981-08-7808-5. Archived from the original (PDF) on 3 March 2011. Retrieved 28 August 2011.
- "Census 2000 – Chapter 5: Religion" (PDF). Archived from the original (PDF) on 27 September 2011. Retrieved 29 August 2011.
- "Singapore". state.gov. Retrieved 30 April 2018.
- "Archived copy" (PDF). Archived from the original (PDF) on 24 November 2007. Retrieved 9 January 2008.CS1 maint: archived copy as title (link) Singapore Department of Statistics.
- "Education, Language Spoken and Literacy - Latest Data". Base. Retrieved 5 May 2020.
- "Latest Data (1 February 2006) Archived 11 July 2005 at the Wayback Machine – Singapore Department of Statistics. URL accessed on 2 February 2006.
- "Singapore's employment hits all-time high of 2.3 m in 2005". Channel NewsAsia. 1 February 2006. Archived from the original on 18 February 2006. By May Wong.
- "Archived copy" (PDF). Archived from the original (PDF) on 31 October 2005. Retrieved 16 July 2005.CS1 maint: archived copy as title (link) Department of Statistics, Singapore.
- Labour Market 2012 Archived 19 March 2013 at the Wayback Machine Ministry of Manpower, Singapore.
- topic1 Archived 12 September 2015 at the Wayback Machine (Key Indicators). See Table 1.14 on Education and Literacy and Table 1.11 on Employment. Retrieved from Statistics Singapore – Yearbook of Statistics Singapore, 2015, Department of Statistics, Singapore. Retrieved on 28 August 2015.
- "Archived copy" (PDF). Archived from the original (PDF) on 22 August 2011. Retrieved 29 April 2011.CS1 maint: archived copy as title (link) Department of Statistics, Singapore.
- "Archived copy" (PDF). Archived from the original (PDF) on 13 November 2012. Retrieved 27 November 2012.CS1 maint: archived copy as title (link) Department of Statistics, Singapore.
- "Archived copy" (PDF). Archived from the original (PDF) on 13 January 2014. Retrieved 21 April 2013.CS1 maint: archived copy as title (link)
- "Household Income - Latest Data". Base. Retrieved 5 May 2020.
- "Archived copy" (PDF). Archived from the original (PDF) on 22 August 2011. Retrieved 29 April 2011.CS1 maint: archived copy as title (link)
- Key Household Income Trends 2012 Archived 10 August 2013 at the Wayback Machine Department of Statistics, Singapore.
- "Household Income from work 2000–2014" Archived 5 October 2015 at the Wayback Machine, The Department of Statistics, Singapore. Retrieved on 4 October 2015
- United Nations Development Programme Report 2004 Archived 18 July 2007 at the Wayback Machine See page 50–53.
- List of countries and dependencies by population density
- List of countries by immigrant population
- List of countries and territories by fertility rate
External links
| Library resources about Demographics of Singapore |
| CIMO |
| ||||
|---|---|---|---|---|---|
| Foreign ethnicities |
| ||||
| |||||

| Sovereign states |
|
|---|---|
| States with limited recognition | |
| Dependencies and other territories |
|
| |
| Sovereign states |
|
|---|---|
| States with limited recognition |
|
| Dependencies and other territories |
|
| |