Demographics of Aruba
This article is about the demographic features of the population of Aruba, including population density, ethnicity, education level, health of the populace, economic status, religious affiliations and other aspects of the population.
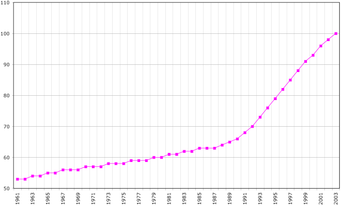
| Census population and average annual growth rate | ||
|---|---|---|
| Year | Pop. | ±% p.a. |
| 1930 | 15,659 | — |
| 1960 | 53,199 | +4.16% |
| 1972 | 57,908 | +0.71% |
| 1981 | 60,312 | +0.45% |
| 1991 | 66,687 | +1.01% |
| 2000 | 90,506 | +3.45% |
| 2010 | 101,484 | +1.15% |
| Source:[1] | ||
Having poor soil and aridity, Aruba was detached from plantation economics and the slave trade. In 1515, the Spanish transported the entire population to Hispaniola to work in the copper mines; most were allowed to return when the mines were tapped out. The Dutch, who took control a century later, left the Arawaks to graze livestock, using the island as a source of meat for other Dutch possessions in the Caribbean. The Arawak heritage is stronger on Aruba than on most Caribbean islands.
The population is estimated to be 75% mixed European/Amerindian/African, 15% Black and 10% other ethnicities. Although no full-blooded Aboriginals remain, the features of half of the islanders clearly indicate their genetic Arawak heritage. The population is descended from Caquetio Indians, Afro-Caribbeans, Dutch, Spanish, Italians and to a lesser extent of Indo-Caribbeans, Portuguese, English, French, and Philippine diaspora. Recently, there has been substantial immigration to the island from neighboring American and Caribbean nations, possibly attracted by the higher paid jobs. In 2007, new immigration laws were introduced to help control the growth of the population by restricting foreign workers to a maximum of three years residency on the island. Demographically, Aruba has felt the impact of its proximity to Venezuela. Many of Aruba's families are descended from Venezuelan immigrants. There is a seasonal increase of Venezuelans living in second homes. As Aruba has a little proximity to Colombia, Colombian residents and their children are found here. Descendants of Indian and Javanese contract workers (Slaves) also live in Aruba.
The two official languages are the Dutch language and the predominant, national language Papiamento, which is classified as a creole language. This creole language is formed primarily from 16th century Portuguese, and several other languages. Spanish and English are also spoken. Islanders can often speak four or more languages.
Many people in the Aruba island culture are multilingual meaning they can speak more than two or three languages. Languages in this culture are known to be mainly Spanish and English, but also include languages such as Dutch, Portuguese and a local language known as Papiamentu. The Leeward islands also known as the (ABC) islands are Aruba, Bonaire, Curaçao. All three islands include the languages listed above.[2]
Children in Aruba are known to start school by the age of four and are commonly known to be multilingual by this time. Although main languages for Aruba are Papiamentu and Dutch, English is taught through education when reaching the sixth grade. One issue that has been known to the ABC islands for a very long period of time now is that of people speaking too many languages. Speaking too many languages has had a major effect on the way students learn, students being taught in different languages not only confuses some but also makes it difficult to decide which language is best for them.[2]
Roman Catholicism is the dominant religion, practiced by about 75% of the population. Various Protestant denominations are also present on the island.[3]
Population
The estimated population of 2018 is 105,845 (the 2019 revision of the World Population Prospects[4][5]).
The population of the island of Aruba is well over 110,000 people. The Aruba culture is one of a mixed ancestry, Caquetio Indian, African, and European among many more all reside within the island of Aruba. Aruba is located within the kingdom of the Netherlands and with the diversity in immigration and is one of the top ten countries with the highest immigration rate.[6] The People of Aruba also an overall very strong national identity, With their healthy economy, strong education system as well as having the highest standards of living within the Caribbean, all of these aspects have helped shape and mold the people of Aruba as well as the culture that surrounds them. The people as a whole are also generally deemed very warm and kind-hearted to not only each other but to guests and visitors as well, some people even claiming that its the people who bring them back every year.[7]
Between 1985 and 1987 the country of Aruba lost many citizens due to emigration. In 1990, Aruba gained more than 20,000 residents which made it one of the fastest growing countries in the world. The oil industry in the country was growing rapidly along with the amount of tourism; this led the population growth rate to be more than 5.3 percent at all times. Aruba as one, became a much more stable country, as it once was.[8]
Vital statistics
| Average population (x 1000) | Live births | Deaths | Natural change | Crude birth rate (per 1000) | Crude death rate (per 1000) | Natural change (per 1000) | TFR | |
|---|---|---|---|---|---|---|---|---|
| 1952 | 39 | 1 958 | 249 | 1 709 | 50.2 | 6.4 | 43.9 | |
| 1953 | 40 | 2 002 | 172 | 1 830 | 49.9 | 4.3 | 45.6 | |
| 1954 | 42 | 2 015 | 205 | 1 810 | 48.2 | 4.9 | 43.3 | |
| 1955 | 44 | 1 916 | 236 | 1 680 | 43.8 | 5.4 | 38.4 | |
| 1956 | 46 | 1 918 | 228 | 1 690 | 41.8 | 5.0 | 36.8 | |
| 1957 | 48 | 2 017 | 233 | 1 784 | 41.8 | 4.8 | 37.0 | |
| 1958 | 51 | 1 968 | 232 | 1 736 | 39.0 | 4.6 | 34.4 | |
| 1959 | 53 | 1 836 | 248 | 1 588 | 34.9 | 4.7 | 30.2 | |
| 1960 | 54 | 1 916 | 254 | 1 662 | 35.3 | 4.7 | 30.7 | |
| 1961 | 55 | 1 838 | 217 | 1 621 | 33.2 | 3.9 | 29.2 | |
| 1962 | 56 | 1 787 | 215 | 1 572 | 31.8 | 3.8 | 28.0 | |
| 1963 | 57 | 1 657 | 208 | 1 449 | 29.2 | 3.7 | 25.6 | |
| 1964 | 57 | 1 556 | 224 | 1 332 | 27.3 | 3.9 | 23.4 | |
| 1965 | 57 | 1 420 | 225 | 1 195 | 24.8 | 3.9 | 20.8 | |
| 1966 | 58 | 1 230 | 219 | 1 011 | 21.3 | 3.8 | 17.5 | |
| 1967 | 58 | 1 151 | 226 | 925 | 19.8 | 3.9 | 15.9 | |
| 1968 | 58 | 1 143 | 258 | 885 | 19.6 | 4.4 | 15.2 | |
| 1969 | 59 | 1 188 | 318 | 870 | 20.2 | 5.4 | 14.8 | |
| 1970 | 59 | 1 234 | 289 | 945 | 20.9 | 4.9 | 16.0 | |
| 1971 | 59 | 1 232 | 292 | 940 | 20.7 | 4.9 | 15.8 | |
| 1972 | 60 | 1 201 | 275 | 926 | 20.1 | 4.6 | 15.5 | |
| 1973 | 58 | 1 003 | 287 | 716 | 17.2 | 4.9 | 12.3 | |
| 1974 | 58 | 962 | 298 | 664 | 16.5 | 5.1 | 11.4 | |
| 1975 | 58 | 968 | 286 | 682 | 16.6 | 4.9 | 11.7 | |
| 1976 | 58 | 941 | 300 | 641 | 16.1 | 5.1 | 11.0 | |
| 1977 | 59 | 993 | 320 | 673 | 17.0 | 5.5 | 11.5 | |
| 1978 | 59 | 1 058 | 284 | 774 | 18.0 | 4.8 | 13.2 | |
| 1979 | 59 | 1 065 | 318 | 747 | 18.0 | 5.4 | 12.6 | |
| 1980 | 60 | 1 125 | 288 | 837 | 18.8 | 4.8 | 14.0 | |
| 1981 | 61 | 1 051 | 317 | 734 | 17.4 | 5.2 | 12.1 | |
| 1982 | 61 | 1 036 | 313 | 723 | 16.9 | 5.1 | 11.8 | |
| 1983 | 62 | 1 133 | 339 | 794 | 18.2 | 5.4 | 12.8 | |
| 1984 | 63 | 1 169 | 323 | 846 | 18.6 | 5.1 | 13.4 | |
| 1985 | 62 | 1 109 | 334 | 775 | 18.0 | 5.4 | 12.6 | |
| 1986 | 60 | 1 014 | 377 | 637 | 16.9 | 6.3 | 10.6 | |
| 1987 | 59 | 992 | 370 | 622 | 16.8 | 6.3 | 10.5 | |
| 1988 | 59 | 949 | 335 | 614 | 16.0 | 5.6 | 10.3 | |
| 1989 | 60 | 1 141 | 372 | 769 | 18.9 | 6.2 | 12.7 | |
| 1990 | 63 | 1 140 | 419 | 721 | 18.2 | 6.7 | 11.5 | |
| 1991 | 66 | 1 157 | 429 | 728 | 17.6 | 6.5 | 11.0 | |
| 1992 | 69 | 1 292 | 424 | 868 | 18.7 | 6.1 | 12.6 | |
| 1993 | 74 | 1 337 | 402 | 935 | 18.1 | 5.5 | 12.7 | |
| 1994 | 78 | 1 315 | 431 | 884 | 16.9 | 5.6 | 11.4 | |
| 1995 | 80 | 1 419 | 504 | 915 | 17.8 | 6.3 | 11.5 | |
| 1996 | 83 | 1 452 | 469 | 983 | 17.5 | 5.6 | 11.8 | |
| 1997 | 86 | 1 457 | 497 | 960 | 16.9 | 5.8 | 11.1 | |
| 1998 | 88 | 1 315 | 505 | 810 | 14.9 | 5.7 | 9.2 | |
| 1999 | 90 | 1 251 | 561 | 690 | 14.0 | 6.3 | 7.7 | |
| 2000 | 91 | 1 294 | 531 | 763 | 14.3 | 5.9 | 8.4 | 1.98 |
| 2001 | 91 | 1 263 | 435 | 828 | 13.8 | 4.8 | 9.1 | 1.95 |
| 2002 | 92 | 1 228 | 492 | 736 | 13.3 | 5.3 | 8.0 | 1.93 |
| 2003 | 93 | 1 244 | 501 | 743 | 13.4 | 5.4 | 8.0 | 1.94 |
| 2004 | 95 | 1 193 | 502 | 691 | 12.5 | 5.3 | 7.3 | 1.89 |
| 2005 | 98 | 1 263 | 482 | 781 | 12.9 | 4.9 | 8.0 | 1.91 |
| 2006 | 99 | 1 359 | 539 | 820 | 13.7 | 5.4 | 8.2 | 2.01 |
| 2007 | 100 | 1 339 | 533 | 806 | 13.4 | 5.3 | 8.0 | 1.99 |
| 2008 | 101 | 1 319 | 554 | 765 | 13.1 | 5.5 | 7.6 | 1.97 |
| 2009 | 102 | 1 253 | 629 | 624 | 12.3 | 6.2 | 6.1 | 1.92 |
| 2010 | 102 | 1 197 | 619 | 578 | 11.8 | 6.1 | 5.7 | 1.80 |
| 2011 | 103 | 1 092 | 633 | 459 | 10.6 | 6.2 | 4.5 | 1.72 |
| 2012 | 104 | 1 140 | 595 | 545 | 10.9 | 5.7 | 5.2 | 1.75 |
| 2013 | 104 | 1 154 | 560 | 594 | 10.9 | 5.3 | 5.6 | 1.77 |
| 2014 | 106 | 1 376 | 643 | 733 | 12.8 | 6.0 | 6.8 | 1.86 |
| 2015 | 109 | 1 244 | 679 | 565 | 11.4 | 6.2 | 5.2 | 1.79 |
| 2016 | 110 | 1 121 | 781 | 340 | 10.2 | 7.1 | 2.9 | |
| 2017 | 111 | 1 202 | 707 | 495 | 10.8 | 6.4 | 4.4 | |
| 2018 | 112 | 1 028 | 717 | 311 | 9.2 | 6.4 | 2.8 |
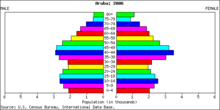
Structure of the population
Structure of the population (01.07.2013) (Estimates) :
| Age Group | Male | Female | Total | % |
|---|---|---|---|---|
| Total | 50 117 | 55 859 | 105 976 | 100 |
| 0-4 | 3 061 | 3 016 | 6 077 | 5,73 |
| 5-9 | 3 619 | 3 387 | 7 006 | 6,61 |
| 10-14 | 3 733 | 3 711 | 7 445 | 7,03 |
| 15-19 | 3 872 | 3 744 | 7 616 | 7,19 |
| 20-24 | 3 145 | 2 941 | 6 086 | 5,74 |
| 25-29 | 2 775 | 2 994 | 5 769 | 5,44 |
| 30-34 | 3 011 | 3 578 | 6 589 | 6,22 |
| 35-39 | 3 249 | 3 860 | 7 109 | 6,71 |
| 40-44 | 3 906 | 4 551 | 8 456 | 7,98 |
| 45-49 | 4 072 | 4 798 | 8 871 | 8,37 |
| 50-54 | 4 275 | 4 873 | 9 148 | 8,63 |
| 55-59 | 3 526 | 4 176 | 7 702 | 7,27 |
| 60-64 | 2 805 | 3 228 | 6 033 | 5,69 |
| 65-69 | 1 942 | 2 456 | 4 397 | 4,15 |
| 70-74 | 1 413 | 1 735 | 3 148 | 2,97 |
| 75-79 | 886 | 1 368 | 2 254 | 2,13 |
| 80-84 | 554 | 842 | 1 396 | 1,32 |
| 85-89 | 195 | 370 | 566 | 0,53 |
| 90-94 | 65 | 160 | 225 | 0,21 |
| 95-99 | 10 | 55 | 66 | 0,06 |
| 100+ | 4 | 16 | 18 | 0,02 |
| Age group | Male | Female | Total | Percent |
|---|---|---|---|---|
| 0-14 | 10 413 | 10 114 | 20 527 | 19,37 |
| 15-64 | 34 635 | 38 743 | 73 378 | 69,24 |
| 65+ | 5 069 | 7 002 | 12 071 | 11,39 |
Ethnic groups
The population is estimated to be 75% mixed European/Amerindian/African, 15% Black and 10% other ethnicities.
Languages
Religions
References
- "Better data. Better lives. – Central Bureau of Statistics – Aruba". Cbs.aw. Retrieved 25 August 2017.
- Dijkhoff, Marta; Pereira, Joyce (2010), "Language and education in Aruba, Bonaire and Curaçao", Creoles in Education, John Benjamins Publishing Company, pp. 237–272, ISBN 978-90-272-5258-6, retrieved 2020-03-10
- "Central America and Caribbean ::ARUBA". CIA The World Factbook.
- ""World Population prospects – Population division"". population.un.org. United Nations Department of Economic and Social Affairs, Population Division. Retrieved November 9, 2019.
- ""Overall total population" – World Population Prospects: The 2019 Revision" (xslx). population.un.org (custom data acquired via website). United Nations Department of Economic and Social Affairs, Population Division. Retrieved November 9, 2019.
- Croes, Haime; Hooimeijer, Pieter (2010). "Gender and chain migration: the case of Aruba". Population, Space and Place. 16 (2): 121–134. doi:10.1002/psp.530. ISSN 1544-8452.
- "Aruba's People - Population Size, Ethnicity & Other Facts | Aruba.com". www.aruba.com. Retrieved 2020-03-23.
- Eelens, Frank. (1994). The population of Aruba : a demographic profile. Netherlands Interdisciplinary Demographic Institute/NIDI. ISBN 90-70990-49-0. OCLC 905474007.
- "United Nations Statistics Division - Demographic and Social Statistics". unstats.un.org. Retrieved 25 August 2017.
- "Central Bureau of Statistics". Unstate.un.org. Retrieved 25 August 2017.
- "3. Live births, deaths, and infant deaths, latest available year (2002 - 2016" (PDF). Unstats.unorg. Retrieved 25 August 2017.
- "United Nations Statistics Division - Demographic and Social Statistics". unstats.un.org. Retrieved 25 August 2017.
| Geography |  | ||||||
|---|---|---|---|---|---|---|---|
| Politics | |||||||
| Economy |
| ||||||
| Culture |
| ||||||
| See also | |||||||
| |||||||