Demographics of the world
The Earth has a population of 7.75 billion, with an overall population density is 50 people per km² (129.28 per sq. mile), excluding Antarctica. Nearly two-thirds of the world's population lives in Asia, with more than 2.5 billion in the countries of China and India combined. The world's literacy rate has increased dramatically in the last 40 years, from 66.7% in 1979 to 86.3% today.[3] This low rate is mostly attributable to poverty. Lower literacy rates are mostly found in South Asia, West Asia and Sub-Saharan Africa.[4] The world's largest ethnic group is Han Chinese, with Mandarin being the world's most spoken language in terms of native speakers.
| Year | million |
|---|---|
| 1500 | 458 |
| 1600 | 580 |
| 1700 | 682 |
| 1750 | 791 |
| 1800 | 978 |
| 1850 | 1,262 |
| 1900 | 1,650 |
| 1950 | 2,521 |
| 1999 | 5,978 |
| 2008 | 6,707 |
| 2011 | 7,000 |
| 2015 | 7,350 |
| 2018 | 7,600 |
| 2020 | 7,750 |
The world's population is predominantly urban and suburban, and there has been significant migration toward cities and urban centres. The urban population jumped from 29% in 1950 to 55.3% in 2018.[5][6] Working backwards from the United Nations prediction that the world will be 51.3 percent urban by 2010, Dr. Ron Wimberley, Dr. Libby Morris and Dr. Gregory Fulkerson estimated 23 May 2007 would have been the first time the urban population outnumbered the rural population in history.[7] China and India are the most populous countries,[8] as the birth rate has consistently dropped in developed countries and until recently remained high in developing countries. Tokyo is the largest urban conglomeration in the world.[6][9]
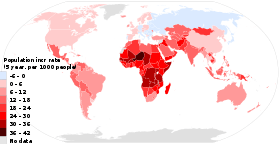
The total fertility rate of the World is estimated at 2.43[10] (2017, world bank) children per woman, which is above the global average for the replacement fertility rate of approximately 2.33 (as of 2003),[11] meaning the world's population is growing. However, world population growth is unevenly distributed, with the total fertility rate going from 0.83 in Singapore, to 6.49 in Niger.[12] The United Nations estimated an annual population increase of 1.14% for the year of 2000.[13] The current world population growth is approximately 1.09%.[6] People under 18 years of age made up over a quarter of the world population (29.3%), and people age 65 and over made up less than one-tenth (7.9%) in 2011.[6]
The world population more than tripled during the 20th century from about 1.65 billion in 1900 to 5.97 billion in 1999.[14][15][16] It reached the 2 billion mark in 1927, the 3 billion mark in 1960, 4 billion in 1974, and 5 billion in 1987.[17] The overall population of the world is approximately 7.7 billion as of December 2018. Currently, population growth is fastest among low wealth, Least Developed Countries.[18] The UN projects a world population of 9.15 billion in 2050, which is a 32.69% increase from 2010 (6.89 billion).[14]
History
Historical migration of human populations begins with the movement of Homo erectus out of Africa across Eurasia about a million years ago. Homo sapiens appear to have occupied all of Africa about 300,000 years ago, moved out of Africa 50,000 – 60,000 years ago, and had spread across Australia, Asia and Europe by 30,000 years BC. Migration to the Americas took place 20,000 to 15,000 years ago, and by 2,000 years ago, most of the Pacific Islands were colonized.
Until c. 10,000 years ago, humans lived as hunter-gatherers. They generally lived in small nomadic groups known as band societies. The advent of agriculture prompted the Neolithic Revolution, when access to food surplus led to the formation of permanent human settlements. About 6,000 years ago, the first proto-states developed in Mesopotamia, Egypt's Nile Valley and the Indus Valley. Early human settlements were dependent on proximity to water and, depending on the lifestyle, other natural resources used for subsistence. But humans have a great capacity for altering their habitats by means of technology.
Since 1800, the human population has increased from one billion[19] to over seven billion,[20] In 2004, some 2.5 billion out of 6.3 billion people (39.7%) lived in urban areas. In February 2008, the U.N. estimated that half the world's population would live in urban areas by the end of the year.[21] Problems for humans living in cities include various forms of pollution and crime,[22] especially in inner city and suburban slums. Both overall population numbers and the proportion residing in cities are expected to increase significantly in the coming decades.[23]
World Population, 0–1998 AD (in thousands)
Source: Maddison and others. (University of Groningen).[24]
| Year | 0 | 1000 | 1500 | 1600 | 1700 | 1820 | 1870 | 1913 | 1950 | 1973 | 1998 |
|---|---|---|---|---|---|---|---|---|---|---|---|
| Western Europe | 24 700 | 25 413 | 57 268 | 73 778 | 81 460 | 132 888 | 187 532 | 261 007 | 305 060 | 358 390 | 388 399 |
| Eastern Europe (excluding USSR countries) |
4 750 | 6 500 | 13 500 | 16 950 | 18 800 | 36 415 | 52 182 | 79 604 | 87 289 | 110 490 | 121 006 |
| Former USSR | 3 900 | 7 100 | 16 950 | 20 700 | 26 550 | 54 765 | 88 672 | 156 192 | 180 050 | 249 748 | 290 866 |
| Total Europe (including USSR countries) |
33 350 | 39 013 | 87 718 | 111 428 | 126 810 | 224 068 | 328 386 | 496 803 | 572 399 | 718 628 | 800 271 |
| United States | 680 | 1 300 | 2 000 | 1 500 | 1 000 | 9 981 | 40 241 | 97 606 | 152 271 | 212 909 | 270 561 |
| Other Western Offshoots | 490 | 660 | 800 | 800 | 750 | 1 249 | 5 892 | 13 795 | 23 823 | 39 036 | 52 859 |
| Total Western Offshoots | 1 170 | 1 960 | 2 800 | 2 300 | 1 750 | 11 230 | 46 133 | 111 401 | 176 094 | 250 945 | 323 420 |
| Mexico | 2 200 | 4 500 | 7 500 | 2 500 | 4 500 | 6 587 | 9 219 | 14 970 | 28 485 | 57 643 | 98 553 |
| Other Latin America | 3 400 | 6 900 | 10 000 | 6 100 | 7 550 | 14 633 | 30 754 | 65 545 | 137 352 | 250 807 | 409 070 |
| Total Latin America | 5 600 | 11 400 | 17 500 | 8 600 | 12 050 | 21 220 | 39 973 | 80 515 | 165 837 | 308 450 | 507 623 |
| Japan | 3 000 | 7 500 | 15 400 | 18 500 | 27 000 | 31 000 | 34 437 | 51 672 | 83 563 | 108 660 | 126 469 |
| China | 59 600 | 59 000 | 103 000 | 160 000 | 138 000 | 381 000 | 358 000 | 437 140 | 546 815 | 881 940 | 1 242 700 |
| India | 75 000 | 75 000 | 110 000 | 135 000 | 165 000 | 209 000 | 253 000 | 303 700 | 359 000 | 580 000 | 975 000 |
| Other Asia | 36 600 | 41 400 | 55 400 | 65 000 | 71 800 | 89 366 | 119 619 | 185 092 | 392 481 | 677 214 | 1 172 243 |
| Total Asia (excluding Japan) | 171 200 | 175 400 | 268 400 | 360 000 | 374 800 | 679 366 | 730 619 | 925 932 | 1 298 296 | 2 139 154 | 3 389 943 |
| Africa | 16 500 | 33 000 | 46 000 | 55 000 | 61 000 | 74 208 | 90 466 | 124 697 | 228 342 | 387 645 | 759 954 |
| World | 230 820 | 268 273 | 437 818 | 555 828 | 603 410 | 1 041 092 | 1 270 014 | 1 791 020 | 2 524 531 | 3 913 482 | 5 907 680 |
Shares of world population, 0–1998 A.D. (% of world total)
Source: Maddison and others. (University of Groningen).[24]
| Year | 0 | 1000 | 1500 | 1600 | 1700 | 1820 | 1870 | 1913 | 1950 | 1973 | 1998 |
|---|---|---|---|---|---|---|---|---|---|---|---|
| Western Europe | 10.7 | 9.5 | 13.1 | 13.3 | 13.5 | 12.8 | 14.8 | 14.6 | 12.1 | 9.2 | 6.6 |
| Eastern Europe (excluding USSR countries) |
2.1 | 2.4 | 3.1 | 3.0 | 3.1 | 3.5 | 4.1 | 4.4 | 3.5 | 2.8 | 2.0 |
| Former USSR | 1.7 | 2.6 | 3.9 | 3.7 | 4.4 | 5.3 | 7.0 | 8.7 | 7.1 | 6.4 | 4.9 |
| Total Europe (including USSR countries) |
14.5 | 14.5 | 20.1 | 20.0 | 21.0 | 21.6 | 25.9 | 27.7 | 22.7 | 18.4 | 13.5 |
| United States | 0.3 | 0.5 | 0.5 | 0.3 | 0.2 | 1.0 | 3.2 | 5.4 | 6.0 | 5.4 | 4.6 |
| Other Western Offshoots | 0.2 | 0.2 | 0.2 | 0.1 | 0.1 | 0.1 | 0.5 | 0.8 | 0.9 | 1.0 | 0.9 |
| Total Western Offshoots | 0.5 | 0.7 | 0.6 | 0.4 | 0.3 | 1.1 | 3.6 | 6.2 | 7.0 | 6.4 | 5.5 |
| Mexico | 1.0 | 1.7 | 1.7 | 0.4 | 0.7 | 0.6 | 0.7 | 0.8 | 1.1 | 1.5 | 1.7 |
| Other Latin America | 1.5 | 2.6 | 2.3 | 1.1 | 1.3 | 1.4 | 2.4 | 3.7 | 5.4 | 6.4 | 6.9 |
| Total Latin America | 2.4 | 4.2 | 4.0 | 1.5 | 2.0 | 2.0 | 3.1 | 4.5 | 6.6 | 7.9 | 8.6 |
| Japan | 1.3 | 2.8 | 3.5 | 3.3 | 4.5 | 3.0 | 2.7 | 2.9 | 3.3 | 2.8 | 2.1 |
| China | 25.8 | 22.0 | 23.5 | 28.8 | 22.9 | 36.6 | 28.2 | 24.4 | 21.7 | 22.5 | 21.0 |
| India | 32.5 | 28.0 | 25.1 | 24.3 | 27.3 | 20.1 | 19.9 | 17.0 | 14.2 | 14.8 | 16.5 |
| Other Asia | 15.9 | 15.4 | 12.7 | 11.7 | 11.9 | 8.6 | 9.4 | 10.3 | 15.5 | 17.3 | 19.8 |
| Total Asia (excluding Japan) | 74.2 | 65.4 | 61.3 | 64.8 | 62.1 | 65.3 | 57.5 | 51.7 | 51.4 | 54.7 | 57.4 |
| Africa | 7.1 | 12.3 | 10.5 | 9.9 | 10.1 | 7.1 | 7.1 | 7.0 | 9.0 | 9.9 | 12.9 |
| World | 100.0 | 100.0 | 100.0 | 100.0 | 100.0 | 100.0 | 100.0 | 100.0 | 100.0 | 100.0 | 100.0 |
2020 population distribution
Population distribution (2020)
| Region (2020) | Number | Percentage[25][26] |
|---|---|---|
| Asia | 4,607,523,595 | 59.54% |
| Africa | 1,313,074,183 | 17.2% |
| Europe | 747,253,261 | 9.59% |
| North America | 565,620,340 | 7.6% |
| South America | 427,751,538 | 5.53% |
| Oceania | 42,213,121 | 0.55% |
| Antarctica | 0 (1,106 estimated non-permanent research personnel) | 0.0% |
| Total | 7,792,204,108 | 100.0% |
Cities
The world has hundreds of major cities spread across 6 continents. Most are in coastal regions.
As of 2005, the world had 62 metropolitan areas with a population of over 3,000,000 people each.[27]
As of 2010, about 3 billion people live in or around urban areas.[6]
The following table shows the populations of the top ten conglomerations.
| Rank | City | Population | Country | Statistical concept[28] | Area (km²)[lower-alpha 1] | Density (p/km²) |
|---|---|---|---|---|---|---|
| 1 | Tokyo | 30,000,000 | Metropolitan area[lower-alpha 2] | 13,500 | 2,716 | |
| 2 | Shanghai | 24,180,000 | Urban agglomeration[lower-alpha 3] | 3,920 | 6,168 | |
| 3 | Mexico City | 22,460,000 | Metropolitan area (zona metropolitana) | 7,815 | 2,490 | |
| 4 | Delhi | 22,157,000 | Urban agglomeration[lower-alpha 4] | 33,578 | 659 | |
| 5 | Lagos | 21,000,000 | Metropolitan area (região metropolitana) | 10,050 | 3,400 | |
| 6 | New York City | 20,153,634 | Metropolitan Statistics Area | 21,483[29] | 938 | |
| 7 | Mumbai | 20,041,000 | Urban agglomeration | 1,097[lower-alpha 5] | 18,268 | |
| 8 | Kolkata | 15,552,000 | Urban agglomeration | 1,026[30] | 15,158 | |
| 9 | Dhaka | 14,648,000 | Metropolitan area (megacity) | 1,600 | 9,155 | |
| 10 | Istanbul | 14,160,467 | Metropolitan Municipality | 5,461 | 2,593 |
Population density
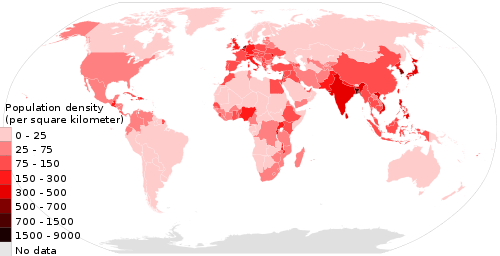
The world's population is 7 billion[31] and Earth's total area (including land and water) is 510 million square kilometres (197 million square miles).[32] Therefore, the worldwide human population density is 7 billion ÷ 510 million km2 (197 million sq mi) = 13.7 people/km2 (35 people/sq mi). If only the Earth's land area of 150 million km2 (58 million sq mi) is taken into account, then human population density increases to 46.7 people/km2 (121 people/sq mi). This calculation includes all continental and island land area, including Antarctica. If Antarctica is also excluded, then population density rises to 50 people/km2 (130 people/sq mi).[33][34] Considering that over half of the Earth's land mass consists of areas inhospitable to human inhabitation, such as deserts and high mountains, and that population tends to cluster around seaports and fresh water sources, this number by itself does not give any meaningful measurement of human population density.
Several of the most densely populated territories in the world are city-states, microstates or dependencies.[35][36] These territories share a relatively small area and a high urbanization level, with an economically specialized city population drawing also on rural resources outside the area, illustrating the difference between high population density and overpopulation.
Ethnicity
Religion
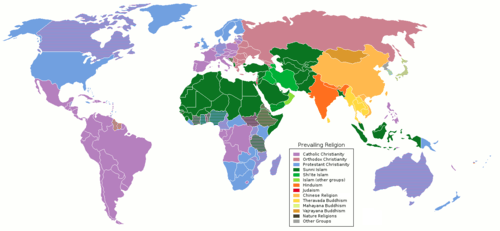
The table below lists religions classified by philosophy; however, religious philosophy is not always the determining factor in local practice. Please note that this table includes heterodox movements as adherents to their larger philosophical category, although this may be disputed by others within that category. For example, Cao Đài is listed because it claims to be a separate category from Buddhism, while Hòa Hảo is not, even though they are similar new religious movements.
The population numbers below are computed by a combination of census reports, random surveys (in countries where religion data is not collected in census, for example United States or France), and self-reported attendance numbers, but results can vary widely depending on the way questions are phrased, the definitions of religion used and the bias of the agencies or organizations conducting the survey. Informal or unorganized religions are especially difficult to count. Some organizations may wildly inflate their numbers.
| Religious category | Number of followers (in millions) | Cultural tradition | Main regions covered | |
|---|---|---|---|---|
| Christianity | 2,300–2,400 | [37] | Abrahamic religions | Predominant in the Western world (Western Europe, the Americas, Oceania), Eastern Europe, Russia, Sub-Saharan Africa, the Philippines, and East Timor in Southeast Asia. Minorities worldwide, see Christianity by country.[38] |
| Islam | 1,600–1,800 | [39][40][41] | Abrahamic religions | West Asia, Northern Africa, Central Asia, South Asia, Western Africa, Maritime Southeast Asia with large population centers existing in Eastern Africa, Balkan Peninsula, Russia and China.[42] |
| No religion | 1,100 | [43] | Secularism, half of those are theistic (but do not fit in with the major religions) | Predominant in the Western world, East Asia. Minorities worldwide, see Irreligion by country. |
| Hinduism | 828–1,000 | [44] | Indian religions | South Asia, Bali, Mauritius, Fiji, Guyana, Trinidad and Tobago, Suriname, and among the overseas Indian communities. |
| Buddhism | 400–600 | [45][46][47] | Indian religions | South Asia, East Asia, Southeast Asia, Australia and some regions of Russia. |
| Folk religions | 600-3,000 | [lower-alpha 6] | Folk religions | Africa, Asia, Americas |
| Chinese folk religions (including Taoism and Confucianism) | 400-1,000 | [48][lower-alpha 6] | Chinese Religions | East Asia, Vietnam, Singapore and Malaysia. |
| Shinto | 27–65 | [49] | Japanese Religions | Japan |
| Sikhism | 24–28 | [50][45] | Indian religions | Indian subcontinent, Australasia, Northern America, Southeast Asia, the United Kingdom and Western Europe. |
| Judaism | 14–18 | [45] | Abrahamic religions | Israel and the worldwide Jewish diaspora (mostly North America, South America, Europe, and Asia). |
| Jainism | 8–12 | [lower-alpha 7] | Indian religions | India, and East Africa. |
| Bahá'í Faith | 7.6–7.9 | [51][52] | Abrahamic religions[lower-alpha 8] | Noted for being dispersed worldwide[53][54] but the top ten populations (amounting to about 60% of the Bahá'í World Faith adherents) are (in order of size of community) India, United States, Vietnam, Kenya, DR of the Congo, Philippines, Zambia, South Africa, Iran, Bolivia[55] |
| Cao Đài | 1–3 | [56] | Vietnamese Religions | Vietnam. |
| Cheondoism | 3 | [57] | Korean religions | North Korea and South Korea |
| Tenrikyo | 2 | [58] | Japanese religions | Japan, Brazil. |
| Wicca | 1 | [59] | New religious movements | United States, Australia, Europe, Canada. |
| Church of World Messianity | 1 | [60] | Japanese Religions | Japan, Brazil |
| Seicho-no-Ie | 0.8 | [58] | Japanese religions | Japan, Brazil. |
| Rastafari movement | 0.7 | [61] | New religious movements, Abrahamic religions | Jamaica, Caribbean, Africa. |
| Unitarian Universalism | 0.63 | [62] | New religious movements | United States, Canada, Europe. |
Since the late 19th century, the demographics of religion have changed a great deal. Some countries with a historically large Christian population have experienced a significant decline in the numbers of professed active Christians: see demographics of atheism. Symptoms of the decline in active participation in Christian religious life include declining recruitment for the priesthood and monastic life, as well as diminishing attendance at church. On the other hand, since the 19th century, large areas of sub-Saharan Africa have been converted to Christianity, and this area of the world has the highest population growth rate. In the realm of Western civilization, there has been an increase in the number of people who identify themselves as secular humanists. In many countries, such as the People's Republic of China, communist governments have discouraged religion, making it difficult to count the actual number of believers. However, after the collapse of communism in numerous countries of Eastern Europe and the former Soviet Union, religious life has been experiencing resurgence there, both in the form of traditional Eastern Christianity and in the forms of Neopaganism. While, Islam however has gained considerably in the Soviet Unions former republics in Central Asia.
Following is some available data based on the work of the World Christian Encyclopedia:[63]
| 1970–1985[64] | 1990–2000[65][66] | 2000–2005[67] |
|---|---|---|
| 2.74%: Islam | 2.13%: Islam | 1.84%: Islam |
| 3.65%: Bahá'í Faith | 2.28%: Bahá'í Faith | 1.70%: Bahá'í Faith |
| 2.34%: Hinduism | 1.69%: Hinduism | 1.57%: Hinduism |
| 1.64%: Christianity | 1.36%: Christianity | 1.32%: Christianity |
| 1.09%: Judaism | 1.87%: Judaism | 1.62%: Judaism |
| 1.67%: Buddhism | 1.09%: Buddhism | |
| 2.65%: Zoroastrianism | ||
| The annual growth in the world population over the same period is 1.41%. |
Studies conducted by the Pew Research Center have found that, generally, poorer nations had a larger proportion of citizens who found religion to be very important than richer nations, with the exceptions of the United States[68] and Kuwait.[69]
Marriage
The average age of marriage varies greatly from country to country and has varied through time. Women tend to marry earlier than men and currently varies from 17.6 for women in Niger, to 32.4 for women in Denmark while men range from 22.6 in Mozambique to 35.1 in Sweden.[70]
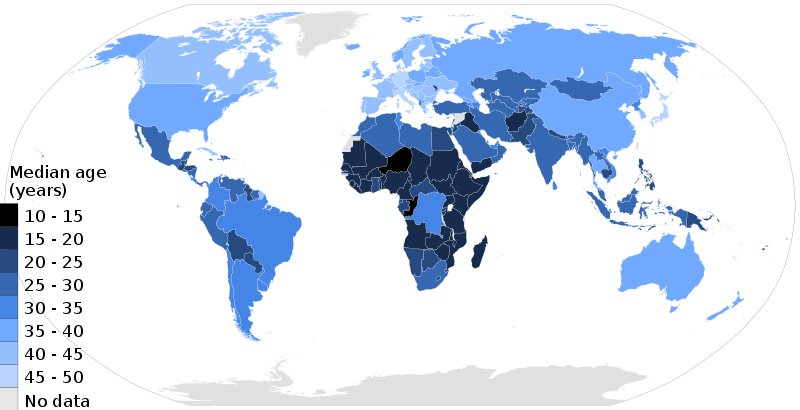
Age structure
According to the 2006 CIA World Factbook, around 27% of the world's population is below 15 years of age.[71]
- 0–14 years: 26.3% (male 944,987,919/female 884,268,378)[6]
- 15–64 years: 65.9% (male 2,234,860,865/female 2,187,838,153)[6]
- 65 years and over: 7.9% (male 227,164,176/female 289,048,221) (2011 est.)[6]
- Median Age – 28.4 years (male: 27.7 years, female: 29 years, 2009 est.)
According to a report by the Global Social Change Research Project, worldwide, the percent of the population age 0–14 declined from 34% in 1950 to 27% in 2010. The elderly population (60+) increased during the same period from 8% to 11%.[72]
| Region | Median age |
|---|---|
| Asia | 31 yo |
| Africa | 18 yo |
| Europe | 42 yo |
| North America | 35 yo |
| South America | 31 yo |
| Oceania | 33 yo |
| Region | Under 15 years (proportion of population) | Over 65 years (proportion of population) |
|---|---|---|
| Asia | 24% | 8% |
| Africa | 41% | 3% |
| Europe | 16% | 18% |
| Latin America-Caribbean | 26% | 8% |
| North America | 19% | 15% |
| Oceania | 23% | 12% |
| World | 26% | 9% |
Population growth rate
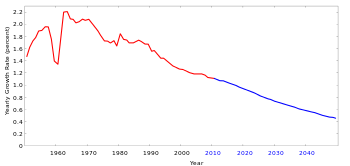
The sharp decline in world population growth in the early 1960s caused primarily by the Great Chinese Famine
Globally, the growth rate of the human population has been declining since peaking in 1962 and 1963 at 2.20% per annum. In 2009, the estimated annual growth rate was 1.1%.[74] The CIA World Factbook gives the world annual birthrate, mortality rate, and growth rate as 1.915%, 0.812%, and 1.092% respectively[75] The last one hundred years have seen a rapid increase in population due to medical advances and massive increase in agricultural productivity[76] made possible by the Green Revolution.[77][78][79]
The actual annual growth in the number of humans fell from its peak of 88.0 million in 1989, to a low of 73.9 million in 2003, after which it rose again to 75.2 million in 2006. Since then, annual growth has declined. In 2009, the human population increased by 74.6 million, which is projected to fall steadily to about 41 million per annum in 2050, at which time the population will have increased to about 9.2 billion.[74] Each region of the globe has seen great reductions in growth rate in recent decades, though growth rates remain above 2% in some countries of the Middle East and Sub-Saharan Africa, and also in South Asia, Southeast Asia, and Latin America.[80]
Some countries experienced negative population growth, especially in Eastern Europe mainly due to low fertility rates, high death rates and emigration. In Southern Africa, growth is slowing due to the high number of HIV-related deaths. Some Western Europe countries might also encounter negative population growth.[81] Japan's population began decreasing in 2005.[82]
Population in the world increased from 1990 to 2008 with 1,423 million and 27% growth. Measured by persons, the increase was highest in India (290 million) and China (192 million). Population growth was highest in Qatar (174%) and United Arab Emirates (140%).[83]
| Rank | Country | Population (thousands) 1990 |
Population (thousands) 2010 |
Growth (%) 1990–2010 |
|---|---|---|---|---|
| World | 5,306,425 | 6,895,889 | 30.0% | |
| 1 | 1,145,195 | 1,341,335 | 17.1% | |
| 2 | 873,785 | 1,224,614 | 40.2% | |
| 3 | 253,339 | 310,384 | 22.5% | |
| 4 | 184,346 | 239,871 | 30.1% | |
| 5 | 149,650 | 194,946 | 30.3% | |
| 6 | 111,845 | 173,593 | 55.2% | |
| 7 | 97,552 | 158,423 | 62.4% | |
| 8 | 105,256 | 148,692 | 41.3% | |
| 9 | 148,244 | 142,958 | −3.6% | |
| 10 | 126,536 | 122,251 | −3.5% |
Birth count
Data required on total number of births per year, and distribution by country.
Birth rate
As of 2009, the average birth rate (unclear whether this is the weighted average rate per country [with each country getting a weight of 1], or the unweighted average of the entire world population) for the whole world is 19.95 per year per 1000 total population, a 0.48% decline from 2003's world birth rate of 20.43 per 1000 total population.
| Years | CBR | Years | CBR |
|---|---|---|---|
| 1950–1955 | 37.2 | 2000–2005 | 21.2 |
| 1955–1960 | 35.3 | 2005–2010 | 20.3 |
| 1960–1965 | 34.9 | 2010–2015 | 19.4 |
| 1965–1970 | 33.4 | 2015–2020 | 18.2 |
| 1970–1975 | 30.8 | 2020–2025 | 16.9 |
| 1975–1980 | 28.4 | 2025–2030 | 15.8 |
| 1980–1985 | 27.9 | 2030–2035 | 15.0 |
| 1985–1990 | 27.3 | 2035–2040 | 14.5 |
| 1990–1995 | 24.7 | 2040–2045 | 14.0 |
| 1995–2000 | 22.5 | 2045–2050 | 13.4 |
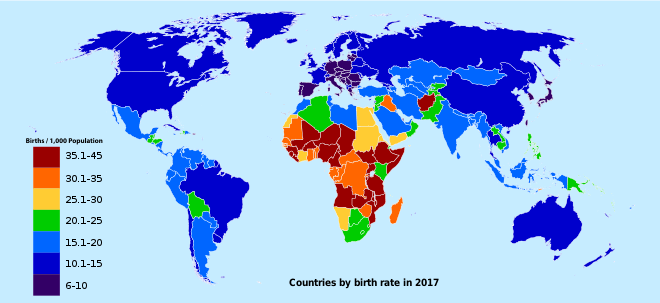
According to the CIA – The World Factbook, the country with the highest birth rate currently is Niger at 51.26 births per 1000 people. The country with the lowest birth rate is Japan at 7.64 births per 1000 people. Hong Kong, a Special Administrative Region of China, is at 7.42 births per 1000 people. As compared to the 1950s, birth rate was at 36 births per 1000 in the 1950s,[85] birth rate has declined by 16 births per 1000 people. In July 2011, the U.S. National Institutes of Health announced that the adolescent birth rate continues to decline.[86]
Birth rates vary even within the same geographic areas. In Europe, as of July 2011, Ireland's birth rate is 16.5 per cent, which is 3.5 per cent higher than the next-ranked country, the UK. France has a birth rate of 12.8 per cent while Sweden is at 12.3 per cent.[87] In July 2011, the UK's Office for National Statistics (ONS) announced a 2.4% increase in live births in the UK in 2010 alone.[88] This is the highest birth rate in the UK in 40 years.[88] By contrast, the birth rate in Germany is only 8.3 per 1,000, which is so low that both the UK and France, which have significantly smaller populations, produced more births in 2010.[89] Birth rates also vary within the same geographic area, based on different demographic groups. For example, in April 2011, the U.S. CDC announced that the birth rate for women over the age of 40 in the U.S. rose between 2007 and 2009, while it fell among every other age group during the same time span.[90] In August 2011, Taiwan's government announced that its birth rate declined in the previous year, despite the fact that it implemented a host of approaches to encourage its citizens to have babies.[91]
Birth rates ranging from 10–20 births per 1000 are considered low, while rates from 40–50 births per 1000 are considered high. There are problems associated with both an extremely high birth rate and an extremely low birth rate. High birth rates can cause stress on the government welfare and family programs to support a youthful population. Additional problems faced by a country with a high birth rate include educating a growing number of children, creating jobs for these children when they enter the workforce, and dealing with the environmental effects that a large population can produce. Low birth rates can put stress on the government to provide adequate senior welfare systems and also the stress on families to support the elders themselves. There will be less children or working age population to support the constantly growing aging population.
The ten countries with the highest and lowest crude birth rate, according to the 2018 CIA World Factbook estimates, are:[92]
|
|
Death rate
The ten countries with the highest and lowest crude death rate, according to the 2018 CIA World Factbook estimates, are:[93]
|
|
| Years | CDR | Years | CDR |
|---|---|---|---|
| 1950–1955 | 19.5 | 2000–2005 | 8.6 |
| 1955–1960 | 17.3 | 2005–2010 | 8.5 |
| 1960–1965 | 15.5 | 2010–2015 | 8.3 |
| 1965–1970 | 13.2 | 2015–2020 | 8.3 |
| 1970–1975 | 11.4 | 2020–2025 | 8.3 |
| 1975–1980 | 10.7 | 2025–2030 | 8.5 |
| 1980–1985 | 10.3 | 2030–2035 | 8.8 |
| 1985–1990 | 9.7 | 2035–2040 | 9.2 |
| 1990–1995 | 9.4 | 2040–2045 | 9.6 |
| 1995–2000 | 8.9 | 2045–2050 | 10 |
See list of countries by death rate for worldwide statistics.
According to the World Health Organization, the 10 leading causes of death in 2002 were:
- 12.6% Ischemic heart disease
- 9.7% Cerebrovascular disease
- 6.8% Lower respiratory infections
- 4.9% HIV/AIDS
- 4.8% Chronic obstructive pulmonary disease
- 3.2% Diarrhoeal diseases
- 2.7% Tuberculosis
- 2.2% Trachea/bronchus/lung cancers
- 2.2% Malaria
- 2.1% Road traffic accidents
Causes of death vary greatly between first and third world countries.
According to Jean Ziegler (the United Nations Special Rapporteur on the Right to Food for 2000 to March 2008), mortality due to malnutrition accounted for 58% of the total mortality in 2006: "In the world, approximately 62 millions people, all causes of death combined, die each year. In 2006, more than 36 millions died of hunger or diseases due to deficiencies in micronutrients".[95]
Of the roughly 150,000 people who died each day across the globe, about two thirds—100,000 per day—died of age-related causes in 2001, according to an article which counts all deaths "due to causes that kill hardly anyone under the age of 40" as age-related.[96] In industrialized nations, the proportion was even higher according to that article, reaching 90%.[96]
Total fertility rate
| Years | TFR | Years | TFR | Years | TFR |
|---|---|---|---|---|---|
| 1950–1955 | 4.95 | 2000–2005 | 2.60 | 2050–2055 | 2.21 |
| 1955–1960 | 4.89 | 2005–2010 | 2.53 | 2055–2060 | 2.18 |
| 1960–1965 | 4.91 | 2010–2015 | 2.50 | 2060–2065 | 2.15 |
| 1965–1970 | 4.85 | 2015–2020 | 2.45 | 2065–2070 | 2.13 |
| 1970–1975 | 4.45 | 2020–2025 | 2.41 | 2070–2075 | 2.10 |
| 1975–1980 | 3.84 | 2025–2030 | 2.37 | 2075–2080 | 2.07 |
| 1980–1985 | 3.59 | 2030–2035 | 2.34 | 2080–2085 | 2.05 |
| 1985–1990 | 3.39 | 2035–2040 | 2.31 | 2085–2090 | 2.03 |
| 1990–1995 | 3.04 | 2040–2045 | 2.27 | 2090–2095 | 2.01 |
| 1995–2000 | 2.73 | 2045–2050 | 2.24 | 2095–2100 | 1.99 |
There is an inverse correlation between income and fertility, wherein developed countries usually have a much lower fertility rate. Various fertility factors may be involved, such as education and urbanization. Mortality rates are low, birth control is understood and easily accessible, and costs are often deemed very high because of education, clothing, feeding, and social amenities. With wealth, contraception becomes affordable. However, in countries like Iran where contraception was made artificially affordable before the economy accelerated, birth rate also rapidly declined. Further, longer periods of time spent getting higher education often mean women have children later in life. Female labor participation rate also has substantial negative impact on fertility. However, this effect is neutralized among Nordic or liberalist countries.[98]
In undeveloped countries on the other hand, families desire children for their labour and as caregivers for their parents in old age. Fertility rates are also higher due to the lack of access to contraceptives, generally lower levels of female education, and lower rates of female employment in industry.
- Total fertility rates by region, 2010–2015
Total fertility rate is the number of children born per woman.
| Total Fertility Rate (2010–2015)[99] | |
|---|---|
| World | 2.5 |
| Africa | 4.7 |
| Sub-Saharan Africa | 5.1 |
| Western Africa | 5.5 |
| Middle Africa | 5.8 |
| Eastern Africa | 4.9 |
| Northern Africa | 3.3 |
| Southern Africa | 2.5 |
| Oceania | 2.4 |
| Asia | 2.2 |
| Europe | 1.6 |
| Latin America-Caribbean | 2.2 |
| North America | 1.9 |
Health
The average number of hospital beds per 1,000 population is 2.94. Compare to Switzerland (18.3) and Mexico (1.1)[101]
96% of the urban population has access to improved drinking water, while only 78% of rural inhabitants have improved drinking water. A total average of 87% of urban and rural have access to improved drinking water.
4% of the urban population does not have access to improved drinking water, leaving 22% of rural people without improved drinking water with a total world population of 13% not having access to drinking water.
76% of the urban population has access to sanitation facilities, while only 45% of the rural population has access. A total world average of 39% do not have access to sanitation facilities.
As of 2009, there are an estimated 33.3 million people living with HIV/AIDS, which is approximately 0.8% of the world population, and there have been an estimated 1.8 million deaths attributed to HIV/AIDS.
As of 2010, 925 million people are undernourished.[102]
Life Expectancy at Birth:
- total population: 71.4 years
- male: 69.1 years
- female: 73.8 years (2015 est.)[100]
Infant Mortality
- total: 41.61 deaths/1,000 live births
- male: 43.52 deaths/1,000 live births
- female: 39.55 deaths/1,000 live births (2011 est.)
| Years | LEB | Years | LEB |
|---|---|---|---|
| 1950–1955 | 47.9 | 2000–2005 | 67.2 |
| 1955–1960 | 49.3 | 2005–2010 | 69.1 |
| 1960–1965 | 51.2 | 2010–2015 | 70.8 |
| 1965–1970 | 55.5 | 2015–2020 | 72.0 |
| 1970–1975 | 58.1 | 2020–2025 | 73.0 |
| 1975–1980 | 60.3 | 2025–2030 | 73.8 |
| 1980–1985 | 62.1 | 2030–2035 | 74.7 |
| 1985–1990 | 63.7 | 2035–2040 | 75.5 |
| 1990–1995 | 64.6 | 2040–2045 | 76.2 |
| 1995–2000 | 65.7 | 2045–2050 | 77.0 |
Sex ratio
|
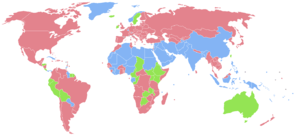
Countries with more females than males.
Countries with similar number of males and females.
Countries with more males than females.
No data |
The Northern Mariana Islands have the highest female ratio with 0.77 males per female. Qatar has the highest male ratio, with 2.87 males/female. For the group aged below 15, Sierra Leone has the highest female ratio with 0.96 males/female, and Georgia and China are tied for the highest male ratio with 1.13 males/female (according to the 2006 CIA World Factbook).
The value for the entire world population is 1.02 males/female,[104] with 1.07 at birth, 1.06 for those under 15, 1.02 for those between 15 and 64, and 0.78 for those over 65.
The "First World" G7 members all have a gender ratio in the range of 0.95–0.98 for the total population, of 1.05–1.07 at birth, of 1.05–1.06 for the group below 15, of 1.00–1.04 for the group aged 15–64, and of 0.70–0.75 for those over 65.
Countries on the Arabian Peninsula tend to have a "natural" ratio of about 1.05 at birth but a very high ratio of males for those over 65 (Saudi Arabia 1.13, United Arab Emirates 2.73, Qatar 2.84), indicating either an above-average mortality rate for females or a below-average mortality for males, or, more likely in this case, a large population of aging male guest workers. Conversely, countries of Eastern Europe (the Baltic states, Belarus, Ukraine, Russia) tend to have a "normal" ratio at birth but a very low ratio of males among those over 65 (Russia 0.46, Latvia 0.48, Ukraine 0.52); similarly, Armenia has a far above average male ratio at birth (1.17), and a below-average male ratio above 65 (0.67). This effect may be caused by emigration and higher male mortality as result of higher post-Soviet era deaths; it may also be related to the enormous (by western standards) rate of alcoholism in the former Soviet states. Another possible contributory factor is an aging population, with a higher than normal proportion of relatively elderly people: we recall that due to higher differential mortality rates the ratio of males to females reduces for each year of age.
Unemployment rate
8.7% (2010 est.) 8.2% (2009 est.) note: 30% combined unemployment and underemployment in many non-industrialized countries; developed countries typically 4%–12% unemployment (2007 est.)
Demonym
The demonym for Earth's inhabitants is Earthling or, as either a noun or an adjective, Terran.
Languages
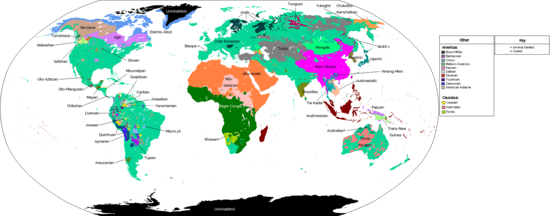
Worldwide, English is used widely as a lingua franca and can be seen to be the dominant language at this time. The world's largest language by native speakers is Mandarin Chinese which is a first language of around 960 million people, or 12.44% of the population, predominantly in Greater China. Spanish is spoken by around 330 to 400 million people, predominantly in the Americas and Spain. Hindi is spoken by about 370 to 420 million speakers, mostly in India and Pakistan. Arabic is spoken by around 280 million people. Bengali is spoken by around 250 million people worldwide, predominantly in Bangladesh and India. Portuguese is spoken by about 230 million speakers in Portugal, Brazil, East Timor, and Southern Africa.
There are numerous other languages, grouped into nine major families:
- Indo-European languages 46% (Europe, Western Asia, South Asia, North Asia, North America, South America, and Oceania)
- Sino-Tibetan languages 21% (East Asia, Mainland Southeast Asia, and South Asia)
- Niger–Congo languages 6.4% (Sub-Saharan Africa)
- Afro-Asiatic languages 6.0% (North Africa to Horn of Africa, and Western Asia)
- Austronesian languages 5.9% (Oceania, Madagascar, and Maritime Southeast Asia)
- Dravidian languages 3.7% (South Asia)
- Altaic languages (controversial combination of Turkic, Mongolic, and Tungusic families) 2.3% (Central Asia, North Asia (Siberia), and Anatolia)[lower-alpha 9]
- Austroasiatic languages 1.7% (Mainland Southeast Asia)
- Tai–Kadai languages 1.3% (Southeast Asia)
There are also hundreds of non-verbal sign languages.
Education
Total population: 83.7% over the age of 15 can read and write, 88.3% male and 79.2% female note: over two-thirds of the world's 793 million illiterate adults are found in only eight countries (Bangladesh, China, Egypt, Ethiopia, India, Indonesia, Nigeria, and Pakistan); of all the illiterate adults in the world, two-thirds are women; extremely low literacy rates are concentrated in three regions, the Arab states, South and West Asia, and Sub-Saharan Africa, where around one-third of the men and half of all women are illiterate (2005–09 est.)
As of 2008, the school life expectancy (primary to tertiary education) for a man or woman is 11 years.
See also
Notes
- The area figures are taken from individual national censuses according to the criteria and statistical concepts noted in the World Urbanization Prospects.
- As defined by the Statistics Bureau of Japan; refers to Kanto major metropolitan area (M.M.A.)
- The population of the city is composed of population in all City Districts meeting the criteria such as “contiguous built-up area,” being the location of the local government, being a Street or Having a Resident Committee.
- Based on a definition of urban agglomeration that is not restricted to state boundaries.
- The Greater Mumbai urban agglomeration is defined by the municipal corporations of Greater Mumbai, Kalyan-Dombivali, Navi Mumbai, Thane and Ulhasnagar, plus the municipal councils of Ambarnath, Badlapur and Mira-Bhayandar. Not to be confused with the Mumbai Metropolitan Region, which includes some additional urban and rural units.
- The number of people who consider themselves party to a "folk tradition" is impossible to determine.
- Figures for the population of Jains differ from just over six million to twelve million due to difficulties of Jain identity, with Jains in some areas counted as a Hindu sect. Many Jains do not return Jainism as their religion on census forms for various reasons such as certain Jain castes considering themselves both Hindu and Jain. Following a major advertising campaign urging Jains to register as such, the 1981 Census of India returned 3.19 million Jains. This was estimated at the time to still be half the true number. The 2001 Census of India had 8.4 million Jains.
- Historically, the Bahá'í Faith arose in 19th century Persia, in the context of Shi'a Islam, and thus may be classed on this basis as a divergent strand of Islam, placing it in the Abrahamic tradition. However, the Bahá'í Faith considers itself an independent religious tradition, which draws from Islam but also other traditions. The Bahá'í Faith may also be classed as a new religious movement, due to its comparatively recent origin, or may be considered sufficiently old and established for such classification to not be applicable.
- Since the Mongolic and Tungusic language families have only a relatively small number of speakers, the majority of the Altaic percentage represents speakers of Turkic languages.
- This list includes only independent countries, not regions.
- This list includes only independent countries, not regions.
References
- Caselli, Graziella; Gillaume Wunsch; Jacques Vallin (20 December 2005). Demography: Analysis and Synthesis, Four Volume Set: A Treatise in Population. Academic Press 1. p. 42. ISBN 978-0-12-765660-1.
- "UN report 2004 data" (PDF). Archived from the original (PDF) on 1 January 2016. Retrieved 1 August 2010.
- "Literacy rate, adult total (% of people ages 15 and above) | Data". data.worldbank.org. Retrieved 26 December 2019.
- "Illiteracy rates by world region 2016". Statista. Retrieved 26 December 2019.
- "Urban population (% of total population) | Data". data.worldbank.org. Retrieved 25 December 2019.
- CIA.gov World Factbook – World Statistics Archived 1 February 2010 at WebCite
- World Population Becomes More Urban That Rural
- "Country Comparison :: Population". U.S. Census Bureau. 2008. Retrieved 28 September 2011.
- "Cities: largest (without surrounding suburban areas)". Geohive. Archived from the original on 5 December 2016.
- "Fertility rate, total (births per woman) | Data". data.worldbank.org. Retrieved 25 December 2019.
- Espenshade TJ, Guzman JC, Westoff CF (2003). "The surprising global variation in replacement fertility". Population Research and Policy Review. 22 (5/6): 575. doi:10.1023/B:POPU.0000020882.29684.8e., Introduction and Table 1, p. 580
- "The World Factbook — Central Intelligence Agency". www.cia.gov. Retrieved 25 December 2019.
- "Census.gov". Census.gov. 7 January 2009. Archived from the original on 23 August 2010. Retrieved 1 August 2010.
- World Population Prospects: The 2008 Revision Population Database Archived 7 April 2006 at WebCite
- "The World at". Un.org. 12 October 1999. Retrieved 1 August 2010.
- "Population Growth over Human History". Globalchange.umich.edu. Archived from the original on 24 July 2011. Retrieved 1 August 2010.
- World Population Milestones
- "United Nations Population Fund". UNFPA. 13 May 1968. Archived from the original on 22 August 2010. Retrieved 6 September 2018.
- "World's population reaches six billion". BBC News. 5 August 1999. Retrieved 5 February 2008.
- "UN population estimates". Population Division, United Nations. Retrieved 4 July 2013.
- Whitehouse, David (19 May 2005). "Half of humanity set to go urban". BBC News.
- Urban, Suburban, and Rural Victimization, 1993–98 U.S. Department of Justice, Bureau of Justice Statistics,. Accessed 29 October 2006
- "World Urbanization Prospects, the 2011 Revision". Population Division, United Nations. Archived from the original on 9 July 2013. Retrieved 4 July 2013.
- Maddison. "Growth of World Population, GDP and GDP Per Capita before 1820" (PDF). University of Groningen.
- "Population: World". worldometers.info.
- "North America Population 2020". World Population Review."Antarctica Population 2020". World Population Review.
- "2005 World City Populations". Mongabay.com.
- "World Urbanization Prospects: The 2009 Revision Population Database". United Nations. Archived from the original on 27 September 2011. Retrieved 11 September 2011.
- Censusreporter.org. Retrieved 26 June 2018.
- Directorate of Census Operations, West Bengal; Kolkata District. Retrieved 3 July 2008.
- "U.S. & World Population Clocks". Archived from the original on 23 February 2011. Retrieved 13 December 2017.
- "Geography / People". The World Factbook. CIA. 22 January 2010. Archived from the original on 1 February 2010.
- Matt Rosenberg (22 July 2016). "Population Density". About.com. Archived from the original on 1 February 2017.
- Matt Rosenberg (2 January 2019). "Population Density Information and Statistics". ThoughtCo. Retrieved 30 April 2019.
- Department of Economic and Social Affairs Population Division (2009). "World Population Prospects, Table A.1" (PDF). 2008 revision. United Nations. Retrieved 12 March 2009. Cite journal requires
|journal=(help) - The Monaco government uses a smaller surface area figure resulting in a population density of 18,078 per km2
- World Christian Database Archived 4 March 2007 at the Wayback Machine Gordon–Conwell Theological Seminary Centre for the Study of Global Christianity
- "Religious Composition by Country, 2010-2050". Pew Research Center. 2 April 2015.
- "The Big Religion Comparison Chart: Compare World Religions". ReligionFacts. Archived from the original on 14 April 2015. Retrieved 2 October 2011.
- Kettani, H. (2014). The World Muslim Population, History & Prospect. Singapore: Research Publishing Service
- "Mapping the Global Muslim Population". 7 October 2009. Retrieved 8 October 2009.
- "World distribution of muslim population". Pew Centre. October 2009. Archived from the original on 28 December 2009. Retrieved 26 December 2009.
- Major Religions of the World Ranked by Number of Adherents, adherents.com. Archived 17 January 2010 at WebCite
- Clarke, Peter B. (editor), The Religions of the World: Understanding the Living Faiths, Marshall Editions Limited: USA (1993); pg. 125
- "World". CIA World Factbook, 2010 Archived 1 February 2010 at WebCite
- Fischer-Schreiber, Ingrid, et al. The Encyclopedia of Eastern Philosophy & Religion: Buddhism, Hinduism, Taoism, Zen. Shambhala: Boston (English: pub. 1994; orig. German: 1986); pg. 50.
- "Tây Tạng một cái nhìn toàn cục" (in Vietnamese). BBC. 23 March 2008.
- Asia Sentinel – How Now Tao?
- Japanese government Archived 25 March 2009 at the Wayback Machine
- Indian Registrar General & Census Commissioner. "Religious Composition". Census of India, 2001
- "World Religions (2005)". QuickLists > The World > Religions. The Association of Religion Data Archives. 2005. Archived from the original on 1 May 2009. Retrieved 4 July 2009.
- "World: People: Religions". CIA World Factbook. 2007. ISSN 1553-8133. Retrieved 6 September 2009.
- Encyclopædia Britannica (2002). "Worldwide Adherents of All Religions by Six Continental Areas, Mid-2002". Encyclopædia Britannica. Encyclopædia Britannica. ISBN 978-0-85229-555-7.
- MacEoin, Denis (2000). "Baha'i Faith". In Hinnells, John R. (ed.). The New Penguin Handbook of Living Religions: Second Edition. Penguin. ISBN 978-0-14-051480-3.
- "Most Baha'i Nations (2005)". QuickLists. The Association of Religion Data Archives. 2005. Archived from the original on 9 December 2015. Retrieved 4 July 2009.
- Sergei Blagov. "Caodaism in Vietnam : Religion vs Restrictions and Persecution Archived 2011-10-09 at the Wayback Machine". IARF World Congress, Vancouver, Canada, 31 July 1999.
- Self-reported figures from 1999; North Korea only (South Korean followers are minimal according to self-reported figures). In The A to Z of New Religious Movements by George D. Chryssides. ISBN 978-0-8108-5588-5
- Self-reported figures printed in Japanese Ministry of Education's 宗教年間 Shuukyou Nenkan, 2003
- Encyclopedia of the Modern Middle East and North Africa (Detroit: Thompson Gale, 2004) p. 82
- Clarke, Peter B. (editor), The Religions of the World: Understanding the Living Faiths, Marshall Editions Limited: USA (1993); pg. 208. "Sekai Kyuseikyo has about one million members, a growing number of them in the west and the third world, especially Brazil and Thailand. "
- Leonard E. Barrett. The Rastafarians: Sounds of Cultural Dissonance. Beacon Press, 1988. p. viii.
- American Religious Identification Survey Archived 16 April 2011 at WebCite
- The results have been studied and found "highly correlated with other sources of data", but "consistently gave a higher estimate for percent Christian in comparison to other cross-national data sets." Hsu, Becky; Reynolds, Amy; Hackett, Conrad; Gibbon, James (9 July 2008). "Estimating the Religious Composition of All Nations" (PDF). Journal for the Scientific Study of Religion. 47 (4): 678–693. doi:10.1111/j.1468-5906.2008.00435.x. Archived from the original (PDF) on 26 March 2010.
- International Community, Bahá'í (1992). "How many Bahá'ís are there?". The Bahá'ís. p. 14.
- Barrett, David A. (2001). World Christian Encyclopedia. p. 4. ISBN 978-0-19-507963-0. Archived from the original on 16 April 2011.
- Barrett, David; Johnson, Todd (2001). "Global adherents of the World's 19 distinct major religions" (PDF). William Carey Library. Archived from the original (PDF) on 28 February 2008. Retrieved 12 October 2006.
- "The List: The World's Fastest-Growing Religions". Foreign Policy. Carnegie Endowment for International Peace. May 2007.
- Pew Research Center (19 December 2002). "Among Wealthy Nations U.S. Stands Alone in its Embrace of Religion". Pew Research Center. Archived from the original on 8 October 2006. Retrieved 12 October 2006.
- Pew Research Center (1 January 2008). "Income and Religiosity". Retrieved 14 September 2009.
- United Nations Economic Commission for Europe "Mean age at first marriage by sex". Accessed 21 May 2011.
- Age structure of the world – 2006 CIA World Factbook
- Shackman, Gene; Wang, Xun; Liu, Yalin. "Brief Review of World Demographic Trends Trends in Age Distributions". The Global Social Change Research Project. Retrieved 23 May 2016.
- Jeff Desjardins (15 February 2019). "Mapped: The Median Age of the Population on Every Continent". Visual Capitalist.
- U.S. Census Bureau, January 2010 Archived 1 July 2009 at the Wayback Machine
- World Factbook Archived 1 February 2010 at WebCite
- "The end of India's green revolution?". BBC News. 29 May 2006. Retrieved 6 September 2018.
- Food First/Institute for Food and Development Policy Archived 14 July 2009 at the Wayback Machine
- "Rising food prices curb aid to global poor". Christian Science Monitor. 24 July 2007.
- "Irish business news". Finfacts. Retrieved 6 September 2018.
- U.S. Census Bureau, June 2009 Archived 1 July 2009 at the Wayback Machine
- UN population projections Archived 28 October 2010 at WebCite
- "Japan sees biggest population fall". The Guardian. Retrieved 6 September 2018.
- CO2 Emissions from Fuel Combustion Population 1971–2008 IEA (pdf Archived 6 January 2012 at the Wayback Machine pages 83–85)
- UNdata: Crude birth rate (per 1,000 population)
- Uneca.org: Crude Birth Rates – The World and its Major Regions, 1950–2050 Archived 16 August 2011 at the Wayback Machine
- Federal report shows drop in adolescent birth rate, July 7, 2011 News Release – National Institutes of Health (NIH)
- "Ireland has one of highest birth and lowest death rates in EU". Thejournal.ie. 29 July 2011. Retrieved 6 September 2018.
- "Call for more midwives as birth rate reaches 40-year high". The Guardian. 13 July 2011. Retrieved 6 September 2018.
- "Germany faces up to its kinder surprise". The Irish Times. 9 June 2018. Retrieved 6 September 2018.
- "CDC records rise in birth rate for women over 40". CNN.com. Retrieved 6 September 2018.
- "Taiwanese birth rate plummets despite measures". BBC News. Retrieved 6 September 2018.
- CIA World Factbook – Birth Rate
- CIA World Factbook – Death Rate
- UNdata: Crude death rate (per 1,000 population)
- Jean Ziegler, L'Empire de la honte, Fayard, 2007 ISBN 978-2-253-12115-2, p.130.
- Aubrey D.N.J, de Grey (2007). "Life Span Extension Research and Public Debate: Societal Considerations" (PDF). Studies in Ethics, Law, and Technology. 1 (1, Article 5). CiteSeerX 10.1.1.395.745. doi:10.2202/1941-6008.1011. Archived from the original (PDF) on 13 October 2016. Retrieved 7 August 2011.
- Esa.un.org Archived 17 April 2015 at the Wayback Machine
- "Graph Charts of TFR and FLR using Google Motion Chart using World Bank's World Development Index". Archived from the original on 27 August 2011. Retrieved 2 October 2011.
- Nicole Mun Sim Lai (14 October 2016). Global Population Age Structures and Sustainable Development (PDF). Expert Group Meeting on Changing Population Age Structures and Sustainable Development New York, 13–14 October 2016.
- "World Health Statistics 2016: Monitoring health for the SDGs Annex B: tables of health statistics by country, WHO region and globally" (PDF). World Health Organization. 2016. p. 110. Retrieved 3 August 2018.
- "Countries Compared by Health > Hospital beds > Per 1,000 people. International Statistics at". Nationmaster.com. Retrieved 6 September 2018.
- "SOFI | FAO | Food and Agriculture Organization of the United Nations". FAO. Retrieved 6 September 2018.
- "World Population Prospects – Population Division – United Nations". esa.un.org. Retrieved 2 September 2018.
- "CIA Fact Book". The Central Intelligence Agency of the United States. Archived from the original on 1 February 2010.
- "Literacy Statistics Metadata Information Table". UNESCO Institute for Statistics. September 2015. Retrieved 19 November 2015.
| Major topics | |
|---|---|
| Biological and related topics | |
| Human impact on the environment | |
| Literature |
|
| Publications | |
| Lists |
|
Events and organizations |
|
| Related topics | |
| |