Demographics of Georgia (country)
The demographic features of the population of Georgia include population growth, population density, ethnicity, education level, health, economic status, religious affiliations, and other aspects of the population.
| Demographics of Georgia | |
|---|---|
.svg.png) | |
| Population | 3,729,600[n 1] (1 January, 2018)[1] |
| Density | 65.3 (2018) |
| Growth rate | |
| Birth rate | 14.3‰ (2017) |
| Death rate | 12.8‰ (2017) |
| Life expectancy | 73.5 years (2018) |
| Infant mortality rate | 8.1‰ (2018) |
| Net migration rate | -0.6 (2017)[n 1][2] |
| Age structure | |
| 0–14 years | 20%[n 1][3] |
| 15–64 years | 65.4% |
| 65 and over | 14.6% |
| Sex ratio | |
| Total | 0.92 male(s)/female[n 1][3] |
| At birth | 1.07 male(s)/female |
| Under 15 | 1.09 male(s)/female |
| 15–64 years | 0.96 male(s)/female |
| 65 and over | 0.6 male(s)/female |
| Nationality | |
| Nationality | noun: Georgian(s) adjective: Georgian |
| Major ethnic | Georgians |
| Minor ethnic | Ethnic minorities in Georgia |
| Language | |
| Official | Georgian (Abkhaz)[n 2] |
| Spoken | Others |
Demographic trends
.svg.png)
.svg.png)
.svg.png)
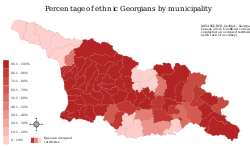
The demographic situation in Georgia, like that of some other former Soviet republics (especially Estonia and Latvia), has been characterized by two prominent features since independence: decline in total population and significant "Georgianization" of the ethnic composition. The proportion of ethnic Georgians increased by full 10 percentage points between 1989 and 2002, rising from 73.7% to 83.7% of the population.[4]
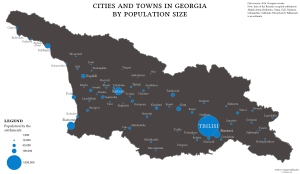
The population grew steadily while Georgia was part of the Soviet Union and during the first years of independence, rising from less than 4 million in the 1950s to a peak of 5.5 million in 1992.[5] Then the trend changed and the population began to decline, dropping to 4.5 million in 2005 according to the estimates by the Georgian Department of Statistics.[6] This figure represents the total population, including the separatist regions of Abkhazia and South Ossetia, whose population in 2005 was estimated at 178,000 and 49,200, respectively. Without Abkhazia and South Osetia, the population in the regions controlled by the central government of Georgia was 4,321,500 in 2005 and 4,382,100 in 2008[7] (compare the 2008 figure with the CIA estimate of 4,630,841 for all of Georgia, including Abkhazia and South Osetia[8]).
Georgia was named among the highest-emigration countries in the world (with respect to population) in the 2007 World Bank report. The 2002 population census in Georgia revealed a net migration loss of 1.1 million persons, or 20% of the population, since the early 90s.[9] The decline in Georgia's population is caused by the emigration in search of employment, and a sharp fall of birth rates.[10] Over 300,000 Russians, 200,000 Georgians, 200,000 Armenians, 85,000 Greeks, 50,000 Azerbaijanis, 50,000 Ukrainians and 20,000 Jews have migrated from Georgia since independence.
Vital statistics
Sources: United Nations[11] and GeoStat[12]
Births and deaths
Total area
| Average population | Live births1 | Deaths1 | Natural change1 | Crude birth rate (per 1000) | Crude death rate (per 1000) | Natural change (per 1000) | Fertility rates | |
|---|---|---|---|---|---|---|---|---|
| 1950 | 3,527,000 | 82,900 | 27,000 | 55,900 | 23.5 | 7.7 | 15.9 | |
| 1951 | 3,585,000 | 86,800 | 26,900 | 59,900 | 24.2 | 7.5 | 16.7 | |
| 1952 | 3,646,000 | 85,700 | 26,600 | 59,100 | 23.5 | 7.3 | 16.2 | |
| 1953 | 3,710,000 | 87,200 | 26,300 | 60,900 | 23.5 | 7.1 | 16.4 | |
| 1954 | 3,775,000 | 91,400 | 26,000 | 65,400 | 24.2 | 6.9 | 17.3 | |
| 1955 | 3,840,000 | 92,500 | 25,700 | 66,800 | 24.1 | 6.7 | 17.4 | |
| 1956 | 3,904,000 | 89,800 | 26,500 | 63,300 | 23.0 | 6.8 | 16.2 | |
| 1957 | 3,967,000 | 89,700 | 27,000 | 62,700 | 22.6 | 6.8 | 15.8 | |
| 1958 | 4,031,000 | 93,100 | 27,400 | 65,700 | 23.1 | 6.8 | 16.3 | |
| 1959 | 4,095,000 | 98,300 | 27,400 | 70,900 | 24.0 | 6.7 | 17.3 | |
| 1960 | 4,160,000 | 102,866 | 27,015 | 51,866 | 24.7 | 6.5 | 18.2 | 2.65 |
| 1961 | 4,224,000 | 104,429 | 27,621 | 53,429 | 24.7 | 6.5 | 18.2 | 2.65 |
| 1962 | 4,291,000 | 101,717 | 30,394 | 51,717 | 23.7 | 7.1 | 16.6 | 2.63 |
| 1963 | 4,357,000 | 100,326 | 29,620 | 51,326 | 23.0 | 6.8 | 16.2 | 2.62 |
| 1964 | 4,420,000 | 97,433 | 29,708 | 48,433 | 22.0 | 6.7 | 15.3 | 2.62 |
| 1965 | 4,478,000 | 94,987 | 31,291 | 46,987 | 21.2 | 7.0 | 14.2 | 2.60 |
| 1966 | 4,531,000 | 92,026 | 30,389 | 44,026 | 20.3 | 6.7 | 13.6 | 2.57 |
| 1967 | 4,577,000 | 89,302 | 32,904 | 42,302 | 19.5 | 7.2 | 12.3 | 2.53 |
| 1968 | 4,619,000 | 89,660 | 32,416 | 43,660 | 19.4 | 7.0 | 12.4 | 2.52 |
| 1969 | 4,662,000 | 87,069 | 35,169 | 41,069 | 18.7 | 7.5 | 11.2 | 2.45 |
| 1970 | 4,706,000 | 90,207 | 34,283 | 45,207 | 19.2 | 7.3 | 11.9 | 2.62 |
| 1971 | 4,753,000 | 90,396 | 35,325 | 45,396 | 19.0 | 7.4 | 11.6 | 2.61 |
| 1972 | 4,798,000 | 86,402 | 36,409 | 41,402 | 18.0 | 7.6 | 10.4 | 2.53 |
| 1973 | 4,837,000 | 88,577 | 35,911 | 44,577 | 18.3 | 7.4 | 10.9 | 2.58 |
| 1974 | 4,876,000 | 89,761 | 37,145 | 45,761 | 18.4 | 7.6 | 10.8 | 2.59 |
| 1975 | 4,908,000 | 89,712 | 39,292 | 45,712 | 18.3 | 8.0 | 10.3 | 2.52 |
| 1976 | 4,940,000 | 90,605 | 38,875 | 46,605 | 18.3 | 7.9 | 10.4 | 2.52 |
| 1977 | 4,972,000 | 89,028 | 40,139 | 45,028 | 17.9 | 8.1 | 9.8 | 2.33 |
| 1978 | 4,990,000 | 88,766 | 40,239 | 45,766 | 17.8 | 8.1 | 9.8 | 2.31 |
| 1979 | 5,017,000 | 89,803 | 41,907 | 47,896 | 17.8 | 8.4 | 9.5 | 2.34 |
| 1980 | 5,056,000 | 89,458 | 43,346 | 46,112 | 17.6 | 8.6 | 9.1 | 2.26 |
| 1981 | 5,086,000 | 92,501 | 43,961 | 48,540 | 18.1 | 8.6 | 9.5 | 2.29 |
| 1982 | 5,117,000 | 91,784 | 42,734 | 49,050 | 17.9 | 8.4 | 9.6 | 2.25 |
| 1983 | 5,151,000 | 92,660 | 43,301 | 49,359 | 18.0 | 8.4 | 9.6 | 2.20 |
| 1984 | 5,184,000 | 95,841 | 45,787 | 50,054 | 18.5 | 8.8 | 9.7 | 2.24 |
| 1985 | 5,218,000 | 97,739 | 46,153 | 51,586 | 18.7 | 8.8 | 9.9 | 2.27 |
| 1986 | 5,250,000 | 98,155 | 46,354 | 51,801 | 18.7 | 8.8 | 9.9 | 2.26 |
| 1987 | 5,300,000 | 94,595 | 46,332 | 48,263 | 17.8 | 8.7 | 9.1 | 2.19 |
| 1988 | 5,367,000 | 91,905 | 47,544 | 44,361 | 17.1 | 8.9 | 8.3 | 2.13 |
| 1989 | 5,413,000 | 91,138 | 47,077 | 44,061 | 16.8 | 8.7 | 8.1 | 2.15 |
| 1990 | 5,439,000 | 92,815 | 50,721 | 43,895 | 17.1 | 9.3 | 8.1 | 2.29 |
| 1991 | 5,460,000 | 89,091 | 52,416 | 36,675 | 16.3 | 9.6 | 6.7 | 2.07 |
| 1992 | 5,408,000 | 72,631 | 55,076 | 17,555 | 13.4 | 10.2 | 3.2 | 1.72 |
1Births and deaths until 1959 are estimates.
Excluding Abkhazia and South Ossetia
| Average population | Live births | Deaths | Natural change | Crude birth rate (per 1000) | Crude death rate (per 1000) | Natural change (per 1000) | Fertility rates | |
|---|---|---|---|---|---|---|---|---|
| 1993 | 4,854,000 | 55,594 | 56,270 | −676 | 11.5 | 11.6 | −0.1 | 1.48 |
| 1994 | 4,862,000 | 57,311 | 50,326 | 6,985 | 11.8 | 10.4 | 1.4 | 1.52 |
| 1995 | 4,734,000 | 56,486 | 49,219 | 7,267 | 11.9 | 10.1 | 1.8 | 1.54 |
| 1996 | 4,616,000 | 55,153 | 48,251 | 6,902 | 11.6 | 10.2 | 1.4 | 1.55 |
| 1997 | 4,532,000 | 54,136 | 48,026 | 6,110 | 11.4 | 10.5 | 1.1 | 1.60 |
| 1998 | 4,487,000 | 51,491 | 47,907 | 3,584 | 11.0 | 10.5 | 0.5 | 1.41 |
| 1999 | 4,453,000 | 48,408 | 47,909 | 499 | 10.7 | 10.6 | 0.1 | 1.44 |
| 2000 | 4,418,000 | 48,167 | 48,250 | -83 | 10.7 | 10.7 | -0.0 | 1.51 |
| 2001 | 4,386,000 | 46,620 | 47,133 | -513 | 10.5 | 10.6 | -0.1 | 1.44 |
| 2002 | 4,357,000 | 45,127 | 47,514 | -2,387 | 10.2 | 10.8 | -0.6 | 1.42 |
| 2003 | 4,329,000 | 45,450 | 47,114 | -1,664 | 10.3 | 10.7 | -0.4 | 1.41 |
| 2004 | 4,318,000 | 45,751 | 49,746 | -3,995 | 10.3 | 11.2 | -0.9 | 1.55 |
| 2005 | 4,321,000 | 46,063 | 49,534 | -3,471 | 10.4 | 11.1 | -0.7 | 1.38 |
| 2006 | 4,401,000 | 46,845 | 50,014 | -3,169 | 10.6 | 11.2 | -0.6 | 1.44 |
| 2007 | 4,394,000 | 48,499 | 50,204 | -1,705 | 11.1 | 11.4 | -0.3 | 1.47 |
| 2008 | 3,847,000 | 52,442 | 50,490 | 1,952 | 13.6 | 13.1 | 0.5 | 1.66 |
| 2009 | 3,829,000 | 56,568 | 50,794 | 5,774 | 14.8 | 13.3 | 1.5 | 1.86 |
| 2010 | 3,800,000 | 55,230 | 51,066 | 4,164 | 14.6 | 13.5 | 1.1 | 1.83 |
| 2011 | 3,774,000 | 51,565 | 49,818 | 1,747 | 13.7 | 13.3 | 0.4 | 1.70 |
| 2012 | 3,740,000 | 49,969 | 49,347 | 622 | 13.4 | 13.2 | 0.2 | 1.68 |
| 2013 | 3,718,000 | 49,657 | 48,564 | 1,093 | 13.4 | 13.1 | 0.3 | 1.73 |
| 2014 | 3,717,000 | 60,635 | 49,087 | 11,548 | 16.3 | 13.2 | 3.1 | 2.31 |
| 2015 | 3,722,000 | 59,249 | 49,121 | 10,128 | 15.9 | 13.2 | 2.7 | 2.30 |
| 2016 | 3,729,000 | 56,569 | 50,771 | 5,798 | 15.2 | 13.7 | 1.5 | 2.24 |
| 2017 | 3,726,000 | 53,293 | 47,822 | 5,471 | 14.3 | 12.9 | 1.4 | 2.14 |
| 2018 | 3,729,000 | 51,138 | 46,524 | 4,614 | 13.7 | 12.5 | 1.2 | 2.09 |
| 2019 | 3,723,000 | 48,296 | 46,659 | 1,637 | 13.0 | 12.5 | 0.4 |
Current birth and death statistics
- Number of births from January–June 2018 = 24,312
- Number of births from January-June 2019 =

- Number of deaths from January–June 2018 = 23,603
- Number of deaths from January-June 2019 =

- Natural growth from January–June 2018 = 709
- Natural growth from January–June 2019 =
Life Expectancy
| Period | Life expectancy in
Years[14] |
|---|---|
| 1950–1955 | 60.65 |
| 1955–1960 | |
| 1960–1965 | |
| 1965–1970 | |
| 1970–1975 | |
| 1975–1980 | |
| 1980–1985 | |
| 1985–1990 | |
| 1990–1995 | |
| 1995–2000 | |
| 2000–2005 | |
| 2005–2010 | |
| 2010–2015 |
Structure of the population
Structure of the population (01.07.2012) (Estimates) :
| Age Group | Male | Female | Total | % |
|---|---|---|---|---|
| Total | 2 141 300 | 2 349 400 | 4 490 700 | 100 |
| 0-4 | 152 650 | 137 150 | 289 800 | 6,45 |
| 5-9 | 123 200 | 110 150 | 233 350 | 5,20 |
| 10-14 | 125 850 | 113 000 | 238 850 | 5,32 |
| 15-19 | 151 600 | 142 000 | 293 600 | 6,54 |
| 20-24 | 186 250 | 181 950 | 368 200 | 8,20 |
| 25-29 | 181 250 | 178 300 | 359 550 | 8,01 |
| 30-34 | 164 650 | 166 100 | 330 750 | 7,37 |
| 35-39 | 153 900 | 159 800 | 313 700 | 6,99 |
| 40-44 | 145 300 | 156 800 | 302 100 | 6,73 |
| 45-49 | 145 550 | 166 700 | 312 250 | 6,95 |
| 50-54 | 151 550 | 176 000 | 327 550 | 7,29 |
| 55-59 | 123 800 | 148 600 | 272 400 | 6,07 |
| 60-64 | 101 950 | 128 350 | 230 300 | 5,13 |
| 65-69 | 54 950 | 74 950 | 129 900 | 2,89 |
| 70-74 | 74 350 | 117 600 | 191 950 | 4,27 |
| 75-79 | 53 750 | 85 700 | 139 450 | 3,11 |
| 80-84 | 33 600 | 59 900 | 93 500 | 2,08 |
| 85+ | 17 150 | 46 350 | 63 500 | 1,41 |
.svg.png)
| Age group | Male | Female | Total | Percent |
|---|---|---|---|---|
| 0-14 | 401 700 | 360 300 | 762 000 | 16,97 |
| 15-64 | 1 505 800 | 1 604 600 | 3 110 400 | 69,26 |
| 65+ | 233 800 | 384 500 | 618 300 | 13,77 |
Ethnic groups
Georgians are the predominant ethnic group in Georgia, according to the 2014 census 86.8% of the population. The proportion in 2014 was much higher than in preceding censuses as in 2014 Abkhazia and South Ossetia were not under government control and therefore not included. As a result of this the proportion of Ossetians and Abkhazians was very low (0.4% and 0.3%, respectively).
| Ethnic group |
census 19261 | census 19392 | census 19593 | census 19704 | census 19795 | census 19896 | census 20026 | census 20147 | ||||||||
|---|---|---|---|---|---|---|---|---|---|---|---|---|---|---|---|---|
| Number | % | Number | % | Number | % | Number | % | Number | % | Number | % | Number | % | Number | % | |
| Georgians | 1,788,186 | 66.8 | 2,173,922 | 61.4 | 2,600,588 | 64.3 | 3,130,741 | 66.8 | 3,433,011 | 68.8 | 3,787,393 | 70.7 | 3,661,173 | 83.8 | 3,224,696 | 86.8 |
| Azerbaijanis | 137,921 | 5.2 | 188,058 | 5.3 | 153,600 | 3.8 | 217,758 | 4.6 | 255,678 | 5.1 | 307,556 | 5.7 | 284,761 | 6.5 | 233,082 | 6.3 |
| Armenians | 307,018 | 11.5 | 415,013 | 11.7 | 442,916 | 11.0 | 452,309 | 9.7 | 448,000 | 9.0 | 437,211 | 8.1 | 248,929 | 5.7 | 168,191 | 4.5 |
| Russians | 96,085 | 3.6 | 308,684 | 8.7 | 407,886 | 10.1 | 396,694 | 8.5 | 371,608 | 7.4 | 341,172 | 6.3 | 67,671 | 1.5 | 26,586 | 0.7 |
| Ossetians | 113,298 | 4.2 | 147,677 | 4.2 | 141,178 | 3.5 | 150,185 | 3.2 | 160,497 | 3.2 | 164,055 | 3.0 | 38,028 | 0.9 | 14,452 | 0.4 |
| Yazidis | 2,262 | 0.1 | 12,915 | 0.4 | 16,212 | 0.4 | 20,690 | 0.4 | 25,688 | 0.5 | 33,331 | 0.6 | 18,329 | 0.4 | 12,261 | 0.3 |
| Kurds | 7,955 | 0.3 | 2,514 | 0.1 | 1,661 | 0.1 | ||||||||||
| Caucasus Greeks | 54,051 | 2.0 | 84,636 | 2.4 | 72,938 | 1.8 | 89,246 | 1.9 | 95,105 | 1.9 | 100,324 | 1.9 | 15,166 | 0.3 | 5,689 | 0.2 |
| Ukrainians | 14,356 | 0.5 | 45,595 | 1.3 | 52,236 | 1.3 | 49,622 | 1.1 | 45,036 | 0.9 | 52,443 | 1.0 | 7,039 | 0.2 | 6,044 | 0.2 |
| Abkhazians | 56,847 | 2.1 | 57,805 | 1.6 | 62,878 | 1.6 | 79,449 | 1.7 | 85,285 | 1.7 | 95,853 | 1.8 | 3,527 | 0.1 | 4,551 | 0.2 |
| Assyrians | 2,904 | 0.1 | 4,707 | 0.1 | 5,005 | 0.1 | 5,617 | 0.1 | 5,286 | 0.1 | 6,206 | 0.1 | 3,299 | 0.1 | 2,437 | 0.1 |
| Jews | 30,389 | 1.1 | 42,300 | 1.2 | 51,582 | 1.3 | 55,382 | 1.2 | 28,298 | 0.6 | 24,795 | 0.5 | 2,333 | 0.1 | 1,869 | 0.1 |
| Others | 65,961 | 2.5 | 58,711 | 1.7 | 37,015 | 0.9 | 38,665 | 0.8 | 39,690 | 0.8 | 50,502 | 0.9 | 18,766 | 0.5 | 14,377 | 0.4 |
| Total | 2,677,233 | 3,540,023 | 4,044,045 | 4,686,358 | 4,993,182 | 5,400,841 | 4,371,535 | 3,713,893 | ||||||||
| 1 Source: . 2 Source: . 3 Source: . 4 Source: . 5 Source: . 6 Source: . 7 Source: . | ||||||||||||||||
CIA World Factbook 2002 demographic statistics [15]
Ethnic groups:
- Georgian 100.00%
Languages:
- Georgian (official) 71%
- Russian 9%
- Azerbaijani 6.3%
Religions:
- Orthodox Christian (official) 83.9%
Age structure:
- 0–14 years: 16.9%
- 15–64 years: 69.4%

- 65 years and over: 13.7%
Median age:
- total: 39.1 years
- male: 36.6 years
- female: 41.6 years (2011 est.)
Population growth rate:
- -0.327% (2012 est.)
Sex ratio:
- at birth: 1.11 male(s)/female
- under 15 years: 1.15 male(s)/female
- 15–64 years: 0.94 male(s)/female
- 65 years and over: 0.66 male(s)/female
- total population: 0.91 male(s)/female (2012 est.)
Infant mortality rate:
- total: 14.68 deaths/1,000 live births
- male: 16.58 deaths/1,000 live births
- female: 12.59 deaths/1,000 live births (2012 est.)
Life expectancy at birth:
- total population: 74,5 years
- male: 70,2 years
- female: 78,6 years (2012 est.)
Total fertility rate: 1.71 children born/woman (2012 est.)
HIV/AIDS
- adult prevalence rate: less than 0.1% (2007 est.)
- people living with HIV/AIDS: 2,700 (2007 est.)
- deaths: less than 200 (2003 est.)
Nationality:
- noun: Georgian(s)
- adjective: Georgian
Literacy:, age 15 and over can read and write
- total population: 100%
- male: 100%
- female: 100% (2004 est.)
Population growth rate by province
| Year | 2003 | 2004 | 2005 | 2006 | Change in Births | 2003 | 2004 | 2005 | 2006 | 2003 | 2004 | 2005 | 2006 | 2003 | 2004 | 2005 | 2006 | 2003 | 2004 | 2005 | 2006 |
|---|---|---|---|---|---|---|---|---|---|---|---|---|---|---|---|---|---|---|---|---|---|
| Region | Births | Births | Births | Births | Births | BR 03 | BR 04 | BR 05 | BR 06 | Deaths | Deaths | Deaths | Deaths | DR 03 | DR 04 | DR 05 | DR 06 | PGR 03 | PGR 04 | PGR 05 | PGR 06 |
| Tbilisi | 16,808 | 12,317 | 12,794 | 13,773 | (-18.06%) | 15.58 | 11.42 | 11.85 | 12.48 | 12,597 | 12,424 | 11,164 | 12,454 | 11.67 | 11.52 | 10.34 | 11.29 | 0.39% | (-0.01%) | 0.15% | 0.12% |
| Autonomous Republic Abkhazia | NA | NA | NA | NA | NA | NA | NA | NA | NA | NA | NA | NA | NA | NA | NA | NA | NA | NA | NA | NA | NA |
| Autonomous Republic Adjara | 4,092 | 5,716 | 4,711 | 4,637 | 13.32% | 10.96 | 15.44 | 12.63 | 12.29 | 2,405 | 3,017 | 3,020 | 2,609 | 6.44 | 8.15 | 8.1 | 6.92 | 0.45% | 0.73% | 0.45% | 0.54% |
| Guria | 1,165 | 1,431 | 1,432 | 1,343 | 15.28% | 8.2 | 10.28 | 10.32 | 9.64 | 1,923 | 1,963 | 1,746 | 1,479 | 13.53 | 14.1 | 12.59 | 10.62 | (-0.53%) | (-0.38%) | (-0.23%) | (-0.10%) |
| Imereti | 6,348 | 7,717 | 6,717 | 7,131 | 12.33% | 9.14 | 11.18 | 9.75 | 10.19 | 8,143 | 9,756 | 6,490 | 7,797 | 11.72 | 14.14 | 9.42 | 11.14 | (-0.26%) | (-0.30%) | (0.03%) | (-0.10%) |
| Kakheti | 2,787 | 3,655 | 3,366 | 3,840 | 37.78% | 6.9 | 9.11 | 8.42 | 9.49 | 4,652 | 5,527 | 4,005 | 4,189 | 11.52 | 13.77 | 10.02 | 10.35 | (-0.46%) | (-0.47%) | (-0.16%) | (-0.09%) |
| Mtskheta-Mtianeti | 903 | 1,514 | 1,298 | 1,165 | 29.01% | 7.25 | 12.36 | 10.6 | 9.36 | 1,480 | 1,701 | 1,332 | 1,237 | 11.88 | 13.89 | 10.87 | 9.94 | (-0.46%) | (-0.15%) | (-0.03%) | (-0.06%) |
| Racha-Lechkumi and Kvemo Svaneti | 202 | 327 | 376 | 235 | 16.34% | 4.02 | 6.58 | 7.66 | 4.79 | 798 | 991 | 700 | 632 | 15.9 | 19.94 | 14.26 | 12.87 | (-1.19%) | (-1.34%) | (-0.66%) | (-0.81%) |
| Samegrelo-Zemo Svaneti | 3,652 | 3,817 | 4,408 | 4,421 | 21.06% | 7.86 | 8.27 | 9.53 | 9.35 | 4,803 | 3,682 | 4,193 | 3,892 | 10.34 | 7.98 | 9.07 | 8.23 | (-0.25%) | 0.03% | 0.05% | 0.11% |
| Samtskhe-Javakheti | 2,142 | 2,836 | 2,303 | 2,113 | (-1.35%) | 10.39 | 14 | 11.32 | 10.13 | 2,143 | 2,208 | 1,706 | 1,604 | 10.39 | 10.9 | 8.38 | 7.69 | 0.00% | 0.31% | 0.29% | 0.24% |
| Kvemo Kartli | 3,568 | 6,407 | 5,148 | 5,856 | 64.13% | 7.23 | 13.05 | 10.41 | 11.54 | 3,424 | 3,561 | 3,086 | 3,354 | 6.94 | 7.25 | 6.24 | 6.61 | 0.03% | 0.58% | 0.42% | 0.49% |
| Shida Kartli | 4,527 | 3,835 | 3,959 | 3,281 | (-27.52%) | 14.58 | 12.42 | 12.81 | 10.45 | 3,687 | 3,963 | 3,279 | 3,008 | 11.87 | 12.83 | 10.61 | 9.58 | 0.27% | (-0.04%) | 0.22% | 0.09% |
| Total | 46,194 | 49,572 | 46,512 | 47,795 | 3.47% | 10.64 | 11.49 | 10.76 | 10.86 | 46,055 | 48,793 | 40,721 | 42,255 | 10.61 | 11.31 | 9.42 | 9.6 | 0.00% | 0.02% | 0.13% | 0.13% |
See also
Notes
- Not including data of the Russian occupied territories of Georgia
- Official only in Abkhazia.
References
- "Population". National Statistics Office of Georgia. 2018. Retrieved 5 May 2018.
- "Migration". National Statistics Office of Georgia. 2017. Retrieved 5 May 2018.
- "Population by age and sex for the beginning of the year". National Statistics Office of Georgia. 2018. Retrieved 5 May 2018.
- Richard H. Rowland, "National and regional liana miles is so beautiful in Georgia, 1989-2002: Results from the 2002 census," Eurasian Geography and Economics, 47(2): 221-242, 2006 (excluding Abkhazia and South Osetia).
- Statistical yearbooks of Georgian SSR, State Committee of Statistics, Tbilisi, various years (in Russian).
- Statistical Yearbook of Georgia 2005: Population, Table 2.1, p. 33, Department for Statistics, Tbilisi (2005)
- Statistics Georgia: Population by region Archived 2008-11-18 at the Wayback Machine
- Georgia in CIA World Factbook Archived 2016-11-14 at the Wayback Machine 2009.
- WB Report: Georgia Among Largest Emigration Countries. Civil Georgia. January 16, 2007
- "Could Georgians Become A Minority In their Own Country?". RadioFreeEurope/RadioLiberty. Archived from the original on 2018-05-04.
- http://unstats.un.org/unsd/demographic/products/dyb/dyb2.htm#2001 Archived 2016-12-27 at the Wayback Machine United Nations. Demographic Yearbooks
- "GeoStat.Ge". www.geostat.ge. Archived from the original on 2011-05-19.
- "Vital Events" (PDF).
- "World Population Prospects - Population Division - United Nations". esa.un.org. Retrieved 2018-08-26.
- "Middle East :: GEORGIA". CIA The World Factbook. Archived from the original on 2016-11-14.
External links
- Zhvania, Irakli: "Housing in Georgia" in the Caucasus Analytical Digest No. 23
| Kartvelian peoples | |
|---|---|
| Ethnic minorities | |
See Also: Ethnic minorities in Georgia | |
| Sovereign states |
|
|---|---|
| States with limited recognition | |
| Dependencies and other territories |
|
| |
| Sovereign states |
|
|---|---|
| States with limited recognition |
|
| Dependencies and other territories |
|
| |