Demographics of Iran
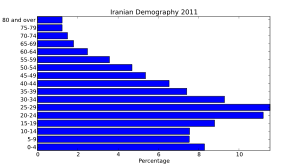
Iran's population increased dramatically during the later half of the 20th century, reaching about 80 million by 2016.[1][2] In recent years, however, Iran's birth rate has dropped significantly. Studies project that Iran's rate of population growth will continue to slow until it stabilizes above 100 million by 2050.[3][4] More than half of Iran's population is under 35 years old (2012).[5]
.jpg)
In 2009, the number of households stood at 15.3 million (4.8 persons per household).[6] Families earn some 11.8 million rials (about $960) per month on average (2012).[7]
According to the OECD/World Bank statistics population growth in Iran from 1990 to 2008 was 17.6 million and 32%.[8] The literacy rate was 80% in 2002,[9][10] and 85% in 2016.[11]
Population
According to the 2016 population census the population of Iran was 79.9 million,[1] a fourfold increase since 1956. Between 1976 and 1986, an average annual population growth of almost 4% was reached, but due to decreasing fertility levels the growth decreased to 1.2% between 2011 and 2016.
| Census date | Population | Average annual growth (%) |
Population density/km2 |
Proportion urban (%) |
Household size |
|---|---|---|---|---|---|
| 1956-11-01 | 18,954,704 | . | 12 | 31.4 | |
| 1966-11-01 | 25,785,210 | 3.13 | 16 | ~37.5 | |
| 1976-11-01 | 33,708,744 | 2.71 | 20 | 47.0 | 5.02 |
| 1986-11-22 | 49,445,010 | 3.91 | 30 | ~54.0 | 5.11 |
| 1996-11-01 | 60,055,488 | 2.0 | 37 | ~61.0 | 4.84 |
| 2006-11-01 | 70,495,782 | 1.62 | 43 | 68.5 | 4.03 |
| 2011-11-01 | 75,149,669 | 1.29 | 46 | 71.4 | 3.55 |
| 2016-11-01 | 79,926,270 | 1.24 | 49 | 74.0 | 3.3 |
Vital statistics
UN estimates
(2019 estimates)[13]
| Period | Live births per year | Deaths per year | Natural change per year | crude birth rate1 | crude death rate1 | natural change1 | total fertility rate2 | infant mortality rate3 |
|---|---|---|---|---|---|---|---|---|
| 1950–1955 | 933,000 | 529,000 | 404,000 | 50.6 | 28.7 | 21.9 | 6.93 | 262.1 |
| 1955–1960 | 1,018,000 | 505,000 | 514,000 | 49.2 | 24.4 | 24.8 | 6.93 | 212.5 |
| 1960–1965 | 1,093,000 | 479,000 | 614,000 | 46.5 | 20.3 | 26.2 | 6.93 | 172.6 |
| 1965–1970 | 1,164,000 | 455,000 | 709,000 | 43.3 | 16.9 | 26.4 | 6.70 | 140.7 |
| 1970–1975 | 1,253,000 | 443,000 | 811,000 | 40.8 | 14.4 | 26.4 | 6.24 | 116.4 |
| 1975–1980 | 1,503,000 | 430,000 | 1,073,000 | 42.1 | 12.0 | 30.1 | 6.27 | 92.2 |
| 1980–1985 | 1,889,000 | 720,000 | 1,170,000 | 44.4 | 16.9 | 27.5 | 6.54 | 69.8 |
| 1985–1990 | 1,955,000 | 550,000 | 1,406,000 | 38.6 | 10.8 | 27.8 | 5.62 | 55.4 |
| 1990–1995 | 1,633,000 | 359,000 | 1,274,000 | 26.2 | 5.9 | 20.3 | 3.70 | 47.1 |
| 1995–2000 | 1,316,400 | 333,200 | 983,200 | 19.1 | 5.3 | 13.8 | 2.40 | 32.0 |
| 2000–2005 | 1,214,400 | 345,800 | 868,600 | 17.4 | 5.0 | 12.4 | 1.92 | 25.0 |
| 2005–2010 | 1,308,000 | 369,800 | 938,200 | 17.8 | 5.1 | 12.7 | 1.82 | 19.0 |
| 2010–2015 | 1,390,600 | 376,200 | 1,014,400 | 18.5 | 4.8 | 13.7 | 1.91 | 15.0 |
| 2015–2020 | 1,266,800 | 366,600 | 900,200 | 19.1 | 4.9 | 14.2 | 2.15 | |
| 2020–2025 | 1,059,800 | 391,400 | 668,400 | 16.3 | 4.8 | 11.5 | 2.09 | |
| 2025–2030 | 906,600 | 439,800 | 466,800 | 14.1 | 5.0 | 9.1 | 2.04 | |
| 2030–2035 | 12.7 | 5.6 | 7.1 | 2.00 | ||||
| 2035–2040 | 12.3 | 6.2 | 6.1 | 1.97 | ||||
| 1per 1000; 2 TFR = number of children per woman; 3per 1000 births | ||||||||
Registered births and deaths
| Average population | Live births | Deaths | Natural change | Crude birth rate (per 1000) | Crude death rate (per 1000) | Natural change (per 1000) | Total Fertility Rate | |
|---|---|---|---|---|---|---|---|---|
| 1959 | 864,846 | 176,268 | 688,578 | |||||
| 1960 | 876,206 | 171,040 | 705,166 | |||||
| 1961 | 902,260 | 159,371 | 742,889 | |||||
| 1962 | 957,500 | 165,488 | 792,012 | |||||
| 1963 | 920,967 | 135,912 | 785,055 | |||||
| 1964 | 1,118,911 | 145,174 | 973,737 | |||||
| 1965 | 1,139,663 | 171,940 | 967,723 | |||||
| 1966 | 1,101,606 | 178,991 | 922,615 | |||||
| 1967 | 1,019,373 | 179,159 | 840,214 | |||||
| 1968 | 1,037,022 | 174,201 | 862,821 | |||||
| 1969 | 1,091,513 | 167,660 | 923,853 | |||||
| 1970 | 1,189,203 | 163,430 | 1,025,773 | |||||
| 1971 | 1,231,227 | 149,325 | 1,081,902 | |||||
| 1972 | 1,138,843 | 153,568 | 985,275 | |||||
| 1973 | 1,199,777 | 155,081 | 1,044,696 | |||||
| 1974 | 1,248,256 | 149,785 | 1,098,471 | |||||
| 1975 | 1,339,267 | 148,543 | 1,190,724 | |||||
| 1976 | 1,401,426 | 155,981 | 1,245,445 | |||||
| 1977 | 1,399,977 | 146,369 | 1,253,608 | |||||
| 1978 | 1,369,597 | 127,587 | 1,242,010 | |||||
| 1979 | 1,689,908 | 142,402 | 1,547,506 | |||||
| 1980 | 2,450,308 | 162,176 | 2,288,132 | |||||
| 1981 | 2,421,611 | 178,099 | 2,243,512 | |||||
| 1982 | 2,101,894 | 200,614 | 1,901,280 | |||||
| 1983 | 2,203,448 | 207,228 | 1,996,220 | |||||
| 1984 | 2,067,803 | 186,440 | 1,881,363 | |||||
| 1985 | 2,033,285 | 190,061 | 1,843,224 | |||||
| 1986 | 2,259,055 | 199,511 | 2,059,544 | |||||
| 1987 | 1,832,089 | 204,230 | 1,627,859 | |||||
| 1988 | 1,944,149 | 238,390 | 1,705,759 | |||||
| 1989 | 1,784,811 | 199,645 | 1,585,166 | |||||
| 1990 | 1,722,977 | 217,597 | 1,505,380 | |||||
| 1991 | 1,582,931 | 217,637 | 1,365,294 | |||||
| 1992 | 1,433,243 | 188,647 | 1,244,596 | |||||
| 1993 | 1,388,017 | 208,161 | 1,179,856 | |||||
| 1994 | 1,426,784 | 3.50 | ||||||
| 1995 | 1,205,372 | 3.22 | ||||||
| 1996 | 1,187,903 | 2.95 | ||||||
| 1997 | 1,179,260 | 2.73 | ||||||
| 1998 | 1,185,639 | 551,345 | 634,294 | 2.53 | ||||
| 1999 | 62,738,000 | 1,177,557 | 374,838 | 802,719 | 18.8 | 6.0 | 12.8 | 2.36 |
| 2000 | 63,658,000 | 1,095,165 | 382,674 | 712,491 | 17.2 | 6.0 | 11.2 | 2.19 |
| 2001 | 64,592,000 | 1,110,836 | 421,525 | 689,311 | 17.2 | 6.5 | 10.7 | 2.09 |
| 2002 | 65,540,000 | 1,122,104 | 337,237 | 784,867 | 17.1 | 5.1 | 12.0 | 2.01 |
| 2003 | 66,480,000 | 1,171,573 | 368,518 | 803,055 | 17.6 | 5.5 | 12.1 | 1.92 |
| 2004 | 67,477,000 | 1,154,368 | 355,213 | 799,155 | 17.1 | 5.3 | 11.8 | 1.87 |
| 2005 | 69,672,000 | 1,239,408 | 363,723 | 875,685 | 18.1 | 5.3 | 12.8 | 1.82 |
| 2006 | 70,554,000 | 1,253,912 | 408,566 | 845,346 | 17.8 | 5.8 | 12.0 | 1.79 |
| 2007 | 71,336,000 | 1,286,716 | 412,736 | 873,980 | 18.0 | 5.8 | 12.2 | 1.81 |
| 2008 | 72,120,000 | 1,300,166 | 417,798 | 882,368 | 17.9 | 5.8 | 12.2 | 1.80 |
| 2009 | 72,924,000 | 1,348,546 | 393,514 | 955,032 | 18.3 | 5.3 | 13.0 | 1.78 |
| 2010 | 73,762,000 | 1,363,542 | 441,042 | 922,500 | 18.3 | 5.9 | 12.4 | 1.77 |
| 2011 | 74,634,000 | 1,382,229 | 422,133 | 960,096 | 18.3 | 5.6 | 12.7 | 1.74 |
| 2012 | 75,539,000 | 1,421,689 | 367,512 | 1,054,177 | 18.7 | 4.8 | 13.9 | 1.73 |
| 2013 | 76,481,000 | 1,471,834 | 372,279 | 1,099,555 | 19.1 | 4.8 | 14.3 | 1.70 |
| 2014 | 77,465,000 | 1,534,362 | 446,333 | 1,088,029 | 19.8 | 5.8 | 14.0 | 1.68 |
| 2015 | 78,492,000 | 1,570,219 | 374,827 | 1,195,392 | 19.9 | 4.8 | 15.1 | |
| 2016 | 79,564,000 | 1,528,054 | 388,792 | 1,139,262 | 19.2 | 4.9 | 14.3 | 2.11 |
| 2017 | 80,673,000 | 1,540,570 | 374,630 | 1,165,940 | 19.0 | 4.6 | 14.4 | |
| 2018 | 81,800,000 | 1,388,249 | 376,839 | 1,011,410 | 16.9 | 4.6 | 12.3 | 1.96 |
| 2019 | 82,914,000 | 1,196,135 | 14.4 |
Structure of the population
Structure of the population 2006 and 24.10.2011 (Census):
| Age group | Number(2006) | Percentage(2006) | Number(2011) | Percentage(2011) |
|---|---|---|---|---|
| Total | 70,495,782 | 100 | 75,149,669 | 100 |
| 0–4 | 5,463,978 | 7.75 | 6,232,552 | 8.29 |
| 5–9 | 5,509,057 | 7.81 | 5,657,791 | 7.53 |
| 10–14 | 6,708,591 | 9.52 | 5,671,435 | 7.55 |
| 15–19 | 8,726,761 | 12.38 | 6,607,043 | 8.79 |
| 20–24 | 9,011,422 | 12.78 | 8,414,497 | 11.20 |
| 25–29 | 7,224,952 | 10.25 | 8,672,654 | 11.54 |
| 30–34 | 5,553,531 | 7.88 | 6,971,924 | 9.28 |
| 35–39 | 4,921,124 | 6.98 | 5,571,018 | 7.41 |
| 40–44 | 4,089,158 | 5.80 | 4,906,749 | 6.53 |
| 45–49 | 3,522,761 | 5.00 | 4,030,481 | 5.36 |
| 50–54 | 2,755,420 | 3.91 | 3,527,408 | 4.69 |
| 55–59 | 1,887,981 | 2.68 | 2,680,119 | 3.57 |
| 60–64 | 1,464,452 | 2.08 | 1,862,907 | 2.48 |
| 65–69 | 1,197,550 | 1.70 | 1,343,731 | 1.79 |
| 70–74 | 1,119,318 | 1.59 | 1,119,968 | 1.49 |
| 75–79 | 694,122 | 0.98 | 913,531 | 1.22 |
| 80+ | 645,601 | 0.92 | 919,539 | 1.22 |
| Unclear | - | - | 46,322 | 0.06 |
| Number of children 0-14 | Number of people 15-49 | Proportion | Number of women 15-49 | Proportion |
|---|---|---|---|---|
| 17,681,629 (2006) | 43,049,709 (2006) | 0.4107 (2006) | ~21,524,855 (2006) | 0.8215 (2006) |
| 17,561,778 (2011) | 45,174,366 (2011) | 0.3888 (2011) | ~22,587,183 (2011) | 0.7775 (2011) |
| Year | 0-14 | 15-64 | 65+ |
|---|---|---|---|
| 1976 | 44.5 | 52 | 3.5 |
| 1985 | 45.5 | 51.5 | 3 |
| 1996 | 39.5 | 56.1 | 4.3 |
| 2006 | 25.08 (17,681,629) | 69.73 (49,157,562) | 5.19 (3,656,591) |
| 2011 | 23.37 (17,561,778) | 70.91 (53,297,122) | 5.72 (4,290,769) |
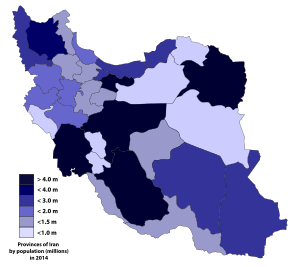
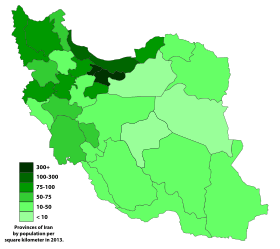
Table 9 – Population and Average Annual Growth by Provinces: 2006 and 2011
| Province | 2006 | 2011 | Average annual growth |
|---|---|---|---|
| Alborz | 2,076,991 | 2,412,513 | 3.04 |
| Ardabil | 1,228,155 | 1,248,488 | 0.33 |
| Bushehr | 886,267 | 1,032,949 | 3.11 |
| Chaharmahal and Bakhtiari | 857,910 | 895,263 | 0.86 |
| East Azerbaijan | 3,603,456 | 3,724,620 | 0.66 |
| Fars | 4,336,878 | 4,596,658 | 1.17 |
| Gilan | 2,404,861 | 2,480,874 | 0.62 |
| Golestan | 1,617,087 | 1,777,014 | 1.90 |
| Hamadan | 1,703,267 | 1,758,268 | 0.64 |
| Hormozgan | 1,403,674 | 1,578,183 | 2.37 |
| Ilam | 545,787 | 557,599 | 0.43 |
| Isfahan | 4,559,256 | 4,879,312 | 1.37 |
| Kerman | 2,652,413 | 2,938,988 | 2.07 |
| Kermanshah | 1,879,385 | 1,945,227 | 0.69 |
| Khuzestan | 4,274,979 | 4,531,720 | 1.17 |
| Kohgiluyeh and Boyer-Ahmad | 634,299 | 658,629 | 0.76 |
| Kurdistan | 1,440,156 | 1,493,645 | 0.73 |
| Lorestan | 1,716,527 | 1,754,243 | 0.44 |
| Markazi | 1,351,257 | 1,413,959 | 0.91 |
| Mazandaran | 2,922,432 | 3,073,943 | 1.02 |
| North Khorasan | 811,572 | 867,727 | 1.35 |
| Qazvin | 1,143,200 | 1,201,565 | 1.00 |
| Qom | 1,046,737 | 1,151,672 | 1.93 |
| Razavi Khorasan | 5,593,079 | 5,994,402 | 1.40 |
| Semnan | 589,742 | 631,218 | 1.37 |
| Sistan and Baluchestan | 2,405,742 | 2,534,327 | 1.05 |
| South Khorasan | 636,420 | 662,534 | 0.81 |
| Tehran | 11,345,375 | 12,183,391 | 1.44 |
| West Azerbaijan | 2,873,459 | 3,080,576 | 1.40 |
| Yazd | 990,818 | 1,074,428 | 1.63 |
| Zanjan | 964,601 | 1,015,734 | 1.04 |
| Total | 70,495,782 | 75,149,669 | 1.29 |
1 The population of the provinces of Alborz and Tehran for 2006 and their average annual growth have been calculated based on the data of 2011.
Unofficial Translation 17
Table 10 – Population Percentages by Province: 2006 and 2011 (Percentage)
| Province | 2006 | 2011 |
|---|---|---|
| Alborz | 2.95 | 3.21 |
| Ardabil | 1.74 | 1.66 |
| Bushehr | 1.26 | 1.37 |
| Chaharmahal and Bakhtiari | 1.22 | 1.19 |
| East Azerbaijan | 5.11 | 4.96 |
| Fars | 6.15 | 6.12 |
| Gilan | 3.41 | 3.30 |
| Golestan | 2.29 | 2.36 |
| Hamadan | 2.42 | 2.34 |
| Hormozgan | 1.99 | 2.10 |
| Ilam | 0.77 | 0.74 |
| Isfahan | 6.47 | 6.49 |
| Kerman | 3.76 | 3.91 |
| Kermanshah | 2.67 | 2.59 |
| Khuzestan | 6.06 | 6.03 |
| Kohgiluyeh and Boyer-Ahmad | 0.90 | 0.88 |
| Kurdistan | 2.04 | 1.99 |
| Lorestan | 2.43 | 2.33 |
| Markazi | 1.92 | 1.88 |
| Mazandaran | 4.15 | 4.09 |
| North Khorasan | 1.15 | 1.15 |
| Qazvin | 1.62 | 1.60 |
| Qom | 1.48 | 1.53 |
| Razavi Khorasan | 7.93 | 7.98 |
| Semnan | 0.84 | 0.84 |
| Sistan and Baluchestan | 3.41 | 3.37 |
| South Khorasan | 0.90 | 0.88 |
| Tehran | 16.09 | 16.21 |
| West Azerbaijan | 4.08 | 4.10 |
| Yazd | 1.41 | 1.43 |
| Zanjan | 1.37 | 1.35 |
| Total | 100 | 100 |
1 The population of the provinces of Alborz and Tehran for 2006 and their average annual growth have been calculated based on the data of 2011.
Languages and ethnic groups

The largest linguistic group comprises speakers of Iranian languages, like modern Persian, Kurdish, Gilaki, Mazandarani, Luri, Talysh, and Balochi. Speakers of Turkic languages, most notably Azerbaijanis, which is by far the second-most spoken language in the country, but also the Turkmen, and the Qashqai peoples, comprise a substantial minority. The remainder are primarily speakers of Semitic languages such as Arabic and Assyrian. There are small groups using other Indo-European languages such as Armenian, Russian, Georgian (a member of the Kartvelian language family), spoken in a large pocket only by those Iranian Georgians that live in Fereydan, Fereydunshahr. Most of those Georgians who live in the north Iranian provinces of Gilan, Mazandaran, Isfahan, Tehran Province and the rest of Iran no longer speak the language but keep a Georgian conscience. The Circassians in Iran, a very large minority in the past and speakers of the Circassian language, have been strongly assimilated and absorbed within the population in the past few centuries. However, significant pockets do exist spread over the country, and they are the second-largest Caucasus-derived group in the nation after the Georgians.[16][17]
Jews have had a continuous presence in Iran since the time of Cyrus the Great of the Achaemenid Empire. In 1948, there were approximately 140,000–150,000 Jews living in Iran. According to the Tehran Jewish Committee, the Jewish population of Iran was (more recently) estimated at about 25,000 to 35,000, of which approximately 15,000 are in Tehran with the rest residing in Hamadan, Shiraz, Isfahan, Kermanshah, Yazd, Kerman, Rafsanjan, Borujerd, Sanandaj, Tabriz and Urmia. However, the official 2011 state census recorded only 8,756 Jews in Iran.[18]
.png)
.png)
.png)
.png)
The CIA World Factbook (which is based on 2013 statistics) gives the following numbers for the languages spoken in Iran today: Persian, Luri, Gilaki and Mazandarani 66%; Azerbaijani and other Turkic languages 18%; Kurdish 10%; Arabic 2%; Balochi 2%; others 2% (Armenian, Georgian, Circassian, Assyrian, etc.).[19]
Other sources, such as the Library of Congress, and the Encyclopedia of Islam (Leiden)[20] give Iran's ethnic groups as following: Persians 65%, Azerbaijanis 16%, Kurds 7%, Lurs 6%, Arabs 2%, Baloch 2%, Turkmens 1%, Turkic tribal groups (e.g. Qashqai) 1%, and non-Persian, non-Turkic groups (e.g. Armenians, Georgians, Assyrians, Circassians, Basseri ) less than 1%.[21] For sources prior to and after 2000, see Languages and ethnicities in Iran.
Urban population
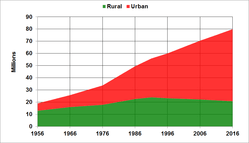
In addition to its international migration pattern, Iran also exhibits one of the steepest urban growth rates in the world according to the UN humanitarian information unit. According to 2015 population estimates, approximately 73.4 percent of Iran's population lives in urban areas, up from 27 percent in 1950.[22] Changes in urbanization law and regulations eased the urbanization process of rural areas, which created more than 400 cities only in the period of 1996-2005.[23]
The following is a list of the eight most populous cities in the country:
| Rank | City | Province | population | |
|---|---|---|---|---|
| City[24] | Metro[25] | |||
| 1 | Tehran | Tehran | 8,693,706 | 14,700,000 |
| 2 | Mashhad | Razavi Khorasan | 3,001,184 | 3,100,000 |
| 3 | Isfahan | Isfahan | 1,961,260 | 3,100,000 |
| 4 | Karaj | Alborz | 1,592,492 | 2,500,000 |
| 5 | Shiraz | Fars | 1,565,572 | 1,700,000 |
| 6 | Tabriz | East Azarbaijan | 1,588,693 | 1,760,000 |
| 7 | Qom | Qom | 1,201,158 | 1,240,000 |
| 8 | Ahvaz | Khuzestan | 1,184,788 | 1,320,000 |
Religious affiliations
Religion in Iran (2011) [26]
| Religion | census 1956 | census 1966 | census 1976 | census 2006 | census 2011 | |||||
|---|---|---|---|---|---|---|---|---|---|---|
| Number | % | Number | % | Number | % | Number | % | Number | % | |
| Muslims | 18,654,127 | 98.4 | 24,771,922 | 98.8 | 33,396,908 | 99.1 | 70,097,741 | 99.4 | 74,682,938 | 99.4 |
| Christians | 114,528 | 0.6 | 149,427 | 0.6 | 168,593 | 0.5 | 109,415 | 0.2 | 117,704 | 0.2 |
| Zoroastrians | 15,723 | 0.1 | 19,816 | 0.1 | 21,400 | 0.1 | 19,823 | 0.0 | 25,271 | 0.0 |
| Jews | 65,232 | 0.3 | 60,683 | 0.2 | 62,258 | 0.2 | 9,252 | 0.0 | 8,756 | 0.0 |
| Other | 59,256 | 0.3 | 77,075 | 0.3 | 54,234 | 0.1 | 49,101 | 0.1 | ||
| Unknown | 45,838 | 0.2 | 59,583 | 0.2 | 205,317 | 0.3 | 265,899 | 0.4 | ||
About 99% of the Iranians are Muslims; 90% belong to the Shi'a branch of Islam, the official state religion, and about 9% belong to the Sunni branch, which predominates in neighboring Muslim countries.[10] Less than 1% non-Muslim minorities include Christians, Zoroastrians, Jews, Bahá'ís, Mandeans, and Yarsan. By far the largest group of Christians in Iran are Armenians under the Armenian Apostolic Church which has between 110,000,[27] 250,000,[28] and 300,000,[29] adherents. There are hundreds of Christian churches in Iran.[30] The Bahá'í Faith, Iran's largest non-Muslim religious minority with a population around 300,000, is not officially recognized (and therefore not included in the census results), and has been persecuted since in inception in Iran. Since the 1979 revolution the persecution of Bahá'ís has increased with executions, the denial of civil rights and liberties, and the denial of access to higher education and employment.[31][32] Unofficial estimates for the Assyrian Christian population range between 20,000,[33][34] and 70,000.[35][36] The number of Iranian Mandaeans is a matter of dispute. In 2009, there were an estimated 5,000 and 10,000 Mandaeans in Iran, according to the Associated Press.[37] Whereas Alarabiya has put the number of Iranian Mandaeans as high as 60,000 in 2011.[38]
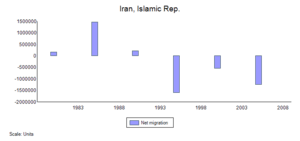
Iranian citizens abroad
The term "Iranian citizens abroad" or " Iranian/Persian diaspora" refers to the Iranian people and their children born in Iran but living outside of Iran. Migrant Iranian workers abroad remitted less than two billion dollars home in 2006.[39]
As of 2010, there are about four to five million Iranians living abroad, mostly in the United States, Canada, Europe, Persian Gulf States, Turkey, Australia and the broader Middle East.[22][40][41] According to the 2000 Census and other independent surveys, there are an estimated 1 million Iranian-Americans living in the U.S., in particular, the Los Angeles area is estimated to be host to approximately 72,000 Iranians, earning the Westwood area of LA the nickname Tehrangeles.[42] Other metropolises that have large Iranian populations include Dubai with 300,000 Iranians, Vancouver, London, Toronto, San Francisco Bay Area, Washington D.C., Buenos Aires, Mexico City, Stockholm, Berlin, Hamburg and Frankfurt. Their combined net worth is estimated to be $1.3 trillion.[43]
Note that this differs from the other Iranian peoples living in other areas of Greater Iran, who are of related ethnolinguistical family, speaking languages belonging to the Iranian languages which is a branch of Indo-European languages.
Refugee population
Iran hosts one of the largest refugee population in the world, with more than one million refugees, mostly from Afghanistan (80%) and Iraq (10%). Since 2006, Iranian officials have been working with the UNHCR and Afghan officials for their repatriation.[44][45] Between 1979 and 1997, UNHCR spent more than US$1 billion on Afghan refugees in Pakistan but only $150 million on those in Iran. In 1999, the Iranian government estimated the cost of maintaining its refugee population at US$10 million per day, compared with the US$18 million UNHCR allocated for all of its operations in Iran in 1999.[45] As of 2016, some 300,000 work permits have been issued for foreign nationals in Iran.[46]
CIA World Factbook demographic statistics
The following demographic statistics are from the CIA World Factbook, unless otherwise indicated.[47]
Age structure
- 0-14 years: 23.69% (male 9,937,715/female 9,449,716)
- 15-24 years: 17.58% (male 7,386,826/female 6,998,188)
- 25-54 years: 46.87% (male 19,534,794/female 18,817,480)
- 55-64 years: 6.58% (male 2,650,049/female 2,731,997)
- 65 years and over: 5.28% (male 1,990,961/female 2,326,544) (2015 est.)
Median age
- total: 28.8 years
- male: 28.6 years
- female: 29.1 years (2015 est.)
Population growth rate
- 1.2% (2015 est.)
Birth rate
- 17.99 births/1,000 population (2015 est.)
Death rate
- 5.94 deaths/1,000 population (2015 est.)
Urbanization
- urban population: 73.4% of total population (2015)
- rate of urbanization: 2.07% annual rate of change (2010-15 est.)
Sex ratio
- at birth: 1.05 male(s)/female
- 0-14 years: 1.05 male(s)/female
- 15-24 years: 1.06 male(s)/female
- 25-54 years: 1.04 male(s)/female
- 55-64 years: 0.97 male(s)/female
- 65 years and over: 0.86 male(s)/female
- total population: 1.03 male(s)/female (2015 est.)
Life expectancy at birth
- total population: 71.15 years
- male: 69.56 years
- female: 72.82 years (2015 est.)
Total fertility rate
- 1.83 children born/woman (2015 est.)
Youth literacy
- definition: age 15-24 can read and write
- total population: above 90%[48]
- male youth: 98%
- female youth: 98.0% (2008 est.)
Genetics
Y-chromosome DNA
Y-Chromosome DNA Y-DNA represents the male lineage, the Iranian Y-chromosome pool is as follows where haplogroups, R1 (25%), J2 (23%) G (14%), J1 (8%) E1b1b (5%), L (4%), Q (4%), comprise more than 85% of the total chromosomes.[49]
| Haplogroup[50] | n | B | C | E1b1a | E1b1b1a2 | E1b1b1a3 | E1b1b1c | F | G | H | I | J1 | J2 | K | L | N | O | P,R | Q | R1a | R1b | R1b1a | R1b1b | R2 | T |
| Marker | M2 | V13 | V22 | M34 | M343 | V88 | M269 | M70 | |||||||||||||||||
| Iran | 566 | 0.53 | 0.18 | 1.41 | 1.77 | 1.8 | 0.88 | 0.35 | 14.00 | 2.65 | 0.8 | 8.13 | 23.86 | 0.71 | 4.00 | 2.12 | 1.41 | 0.71 | 4.01 | 17.49 | 1.24 | 0.35 | 6.18 | 1.41 | 2.12 |
Mitochondrial DNA
Mitochondrial DNA (mtDNA) represents the female lineage. West Eurasian mtDNA makes up over 90% of the Iranian population on average. (2013).[51]
Among them, U3b3 lineages appear to be restricted to populations of Iran and the Caucasus, while the sub-cluster U3b1a is common in the whole Near East region.[51]
In Iran outliers in the Y-chromosomes and Mitochondrial DNA gene pool are consisted by the north Iranian ethnicities, such as the Gilaki's and Mazandarani's, whose genetic build up including chromosomal DNA are nearly identical to the major South Caucasian ethnicites, namely the Georgians, Armenians and Azerbaijani's. Other outliers are made by the Baloch people, representing a mere 1-2% of the total Iranian population, who have more patrilinial and mitochondrial DNA lines leaning towards northwest South Asian ethnic groups.
Levels of genetic variation in Iranian populations are comparable to the other groups from the Caucasus, Anatolia and Europe.[51]
People of Iranian ancestry
Tats (Caucasus)
The "Tats" are an Iranian people, presently living within Azerbaijan and Russia (mainly Southern Dagestan). The Tats are part of the indigenous peoples of Iranian origin in the Caucasus.[52][53][54]
Tats use the Tat language, a southwestern Iranian language and a variety of Persian[55][56][57][58][59] Azerbaijani and Russian are also spoken. Tats are mainly Shia Muslims, with a significant Sunni Muslim minority. Likely the ancestors of modern Tats settled in South Caucasus when the Sassanid Empire from the 3rd to 7th centuries built cities and founded military garrisons to strengthen their positions in this region.[60]
Parsis
The Parsis are the close-knit Zoroastrian community based primarily in India but also found in Pakistan. Parsis are descended from Persian Zoroastrians who emigrated to the Indian subcontinent over 1,000 years ago. Indian census data (2001) records 69,601 Parsis in India, with a concentration in and around the city of Mumbai (previously known as Bombay). There are approximately 8,000 Parsis elsewhere on the subcontinent, with an estimated 2,500 Parsis in the city of Karachi and approximately 50 Parsi families in Sri Lanka. The number of Parsis worldwide is estimated to be fewer than 100,000 (Eliade, 1991:254).
Iranis
In Pakistan and India, the term "Irani" has come to denote Iranian Zoroastrians who have migrated to Pakistan and India within the last two centuries, as opposed to most Parsis who arrived in India over 1000 years ago. Many of them moved during the Qajar era, when persecution of Iranian Zoroastrians was rampant. They are culturally and linguistically closer to the Zoroastrians of Iran. Unlike the Parsis, they speak a Dari dialect, the language spoken by the Iranian Zoroastrians in Yazd and Kerman. Their last names often resemble modern Iranian names, however Irani is a common surname among them. In India they are mostly located in modern-day Mumbai while in Pakistan they are mostly located in modern-day Karachi. In both Pakistan and India, they are famous for their restaurants and tea-houses.[61] Some, such as Ardeshir Irani, have also become very famous in cinema.
Ajam (Bahrain)
The "Ajam" are an ethnic community of Bahrain, of Iranian origin. They have traditionally been merchants living in specific quarters of Manama and Muharraq. The Iranians who adhere to Shiite sect of Islam are Ajam, and they are different from the Huwala. Ajams are also a large percentage of the populace in UAE, Kuwait, Qatar and Oman.
In addition to this, many names of ancient villages in Bahrain are of Persian origin. It is believed that these names were given during the Safavid rule of Bahrain (1501–1722). i.e. Karbabad, Salmabad, Karzakan, Duraz, Barbar, which indicates that the history of Ajams is much older.
Huwala
Huwala are the descendants of Persians and Persian Arabs who belong to the Sunni sect of Islam.[62] Huwala migrated from Ahvaz in Iran to the Persian Gulf in the seventeenth and eighteenth century.[62][63]
See also
- Culture of Iran
- Economy of Iran
- Education in Iran
- Ethnic groups in West Asia
- Health care in Iran
- Human rights in Iran
- Human capital flight from Iran
- Iranian names
- Social class in Iran
- Women in Iran
- List of Iranians
References
- Iran Census Results 2016 Archived December 23, 2015, at the Wayback Machine United Nations
- Asia-Pacific Population Journal, United Nations. "A New Direction in Population Policy and Family Planning in the Islamic Republic of Iran". Archived from the original on 2009-02-14. Retrieved 2006-04-14.
- "International Programs". census.gov. Archived from the original on 2012-04-29. Retrieved 2017-12-07.
- Iran News, Payvand.com. "Iran's population growth rate falls to 1.5 percent: UNFP". Archived from the original on 2016-12-27. Retrieved 2006-10-18.
- "International News | World News - ABC News". Abcnews.go.com. 2012-11-30. Archived from the original on 2012-08-01. Retrieved 2012-12-04.
- "Iran". Iran economy: Social indicators & living standards. Economist Intelligence Unit. June 23, 2009.
- "Central bank: Income equality improved in Iran". Tehran Times. Archived from the original on 2013-11-15. Retrieved 2012-12-04.
- CO2 Emissions from Fuel Combustion Archived 2009-10-12 at the Wayback Machine Population 1971-2008 (pdf Archived 2012-01-06 at the Wayback Machine pages 83-85) IEA (OECD/ World Bank) original population ref e.g. in IEA Key World Energy Statistics 2010 page 57)
- UNDP.org Archived 2009-11-22 at the Wayback Machine Table H
- "CIA - The World Factbook". Cia.gov. Archived from the original on 2012-02-03. Retrieved 2012-12-04.
- "The World Factbook". cia.gov. 2019-05-06. Archived from the original on 2012-02-03.
- Iran Census Results 2011 Archived December 23, 2015, at the Wayback Machine United Nations
- "World Population Prospects: The 2019 Revision". un.org. Archived from the original on 2016-02-19. Retrieved 2016-02-23.
- "United Nations Statistics Division - Demographic and Social Statistics". un.org. Archived from the original on 2016-12-27. Retrieved 2012-08-08.
- ".:: National Organization for Civil Registration-Home ::". sabteahval.ir. Archived from the original on 2013-01-14. Retrieved 2015-05-04.
- Encyclopedia of the Peoples of Africa and the Middle East Archived 2015-06-14 at the Wayback Machine Facts On File, Incorporated ISBN 143812676X p 141
- "Circassian (people)". Archived from the original on 7 April 2014. Retrieved 28 April 2014.
- "Jewish woman brutally murdered in Iran over property dispute". The Times of Israel. November 28, 2012. Archived from the original on August 19, 2014. Retrieved Aug 16, 2014.
A government census published earlier this year indicated there were a mere 8,756 Jews left in Iran
- "The World Factbook - Iran". Archived from the original on 2012-02-03. Retrieved 2013-05-13.
- See Iran in Encyclopedia of Islam, Leiden. C.E. Bosworth (editor)
- Curtis, Glenn E.; Hooglund, Eric (May 2008). "Country Profile: Iran" (PDF). Library of Congress – Federal Research Division. p. 5. Archived (PDF) from the original on 2015-09-27. Retrieved 2009-12-02.
- "Statistical Center of Iran". Migrationinformation.org. Archived from the original on 2015-10-15. Retrieved 2012-12-04.
- Annamoradnejad, Rahimberdi; Annamoradnejad, Davoud (2014). "Effects of Urbanization Law and Regulations in Iran's Geographical Space". Iranian Conference of Geographical Sciences. University of Tehran. Archived from the original on 2017-09-24. Retrieved 2017-06-20.
- https://www.amar.org.ir/english
- "Major Agglomerations of the World - Population Statistics and Maps". citypopulation.de. 2018-09-13. Archived from the original on 2018-09-13.
- "Middle East :: IRAN". CIA The World Factbook. Archived from the original on 2012-02-03.
- "In Iran, 'crackdown' on Christians worsens". Christian Examiner. Washington D.C.: Christian Examiner. April 2009. Archived from the original on 31 December 2013. Retrieved 1 December 2009.
- Price, Massoume (December 2002). "History of Christians and Christianity in Iran". Christianity in Iran. FarsiNet Inc. Archived from the original on 22 March 2010. Retrieved 1 December 2009.
- "In Iran, 'crackdown' on Christians worsens". Christian Examiner. Washington D.C.: Christian Examiner. April 2009. Archived from the original on 31 December 2013. Retrieved 19 March 2015.
- "Ahmadinejad: Religious minorities live freely in Iran (PressTV, 24 Sep 2009)". Archived from the original on 2016-01-15.
- International Federation for Human Rights (2003-08-01). "Discrimination against religious minorities in Iran" (PDF). fdih.org. Archived (PDF) from the original on 2006-10-31. Retrieved 2007-03-19.
- Iran Human Rights Documentation Center (2007). "A Faith Denied: The Persecution of the Bahá'ís of Iran" (PDF). Iran Human Rights Documentation Center. Archived from the original (PDF) on 2007-06-11. Retrieved 2007-03-19.
- "انتقال مقر جهاني آشوريان به ايران". jamejamonline.ir. Archived from the original on 2014-12-23. Retrieved 2015-01-02.
- "ASSYRIANS IN IRAN". iranicaonline.org. Archived from the original on 2015-02-04. Retrieved 2015-01-02.
- Hooglund (2008), p. 295.
- BetBasoo, Peter (1 April 2007). "Brief History of Assyrians". Assyrian International News Agency. Archived from the original on 17 October 2013. Retrieved 12 October 2013.
- Contrera, Russell. "Saving the people, killing the faith – Holland, MI". The Holland Sentinel. Archived from the original on 2012-03-06. Retrieved 2011-12-17.
- "Iran Mandaeans in exile following persecution". Alarabiya.net. 2011-12-06. Archived from the original on 2016-07-31. Retrieved 2011-12-17.
- Iran Daily - Domestic Economy - 10/22/07 Archived October 25, 2007, at the Wayback Machine
- "No Operation". Presstv.com. Archived from the original on 2012-06-06. Retrieved 2012-12-04.
- "Iran: Coping With The World's Highest Rate Of Brain Drain". RadioFreeEurope/RadioLiberty.
- "Iranian-Americans cast ballots on Iran's future - CNN.com". CNN. 2009-06-16. Archived from the original on 2009-08-17. Retrieved 2010-05-01.
- Iran Daily - Domestic Economy - 02/14/07 Archived March 6, 2007, at the Wayback Machine
- United Nations, UNHCR. "Tripartite meeting on returns to Afghanistan". Archived from the original on 2018-10-03. Retrieved 2006-04-14.
- "Migration Information Source - Iran: A Vast Diaspora Abroad and Millions of Refugees at Home". Migrationinformation.org. Archived from the original on 2014-02-15. Retrieved 2012-12-04.
- "300K Foreigners Have Work Permits". 26 December 2016. Archived from the original on 5 January 2017. Retrieved 4 January 2017.
- "The World Factbook — Central Intelligence Agency". www.cia.gov. Archived from the original on 2012-02-03. Retrieved 2007-05-30.
- "Iran - Literacy rate". Index Mundi. Archived from the original on 25 March 2017. Retrieved 6 September 2013.
- Regueiro et al. 2006, Nasidze et al. 2008
- Bekada A, Fregel R, Cabrera VM, Larruga JM, Pestano J, et al. (2013) Introducing the Algerian Mitochondrial DNA and Y-Chromosome Profiles into the North African Landscape Archived 2014-10-22 at the Wayback Machine. PLoS ONE 8(2): e56775. doi:10.1371/journal.pone.0056775
- Miroslava Derenko; Boris Malyarchuk; Ardeshir Bahmanimehr; Galina Denisova; Maria Perkova; Shirin Farjadian; Levon Yepiskoposyan (November 2013). "Complete Mitochondrial DNA Diversity in Iranians". Archived from the original on 2 January 2015. Retrieved 2 January 2015.
- Pilkington, H. (November 27, 2002). Islam in Post-Soviet Russia - Among other indigenous peoples of Iranian origin were the Tats, the Talishes and the Kurds. Psychology Press. p. 27. ISBN 9780203217696. Archived from the original on June 24, 2016. Retrieved June 20, 2015.
- R. Khanam,"Encyclopaedic Ethnography of Middle-East and Central Asia:P-Z, Volume 1", Global Vision Publishing Ho, 2005. pg 746:"The contemporary Tats are the descendants of an Iranian-speaking population sent out of Persia by the dynasty of the Sasanids in the fifth to sixth centuries."
- T. M. Masti︠u︡gina, Lev Perepelkin, Vitaliĭ Vi͡a︡cheslavovich Naumkin (1996). An Ethnic History of Russia: Pre-Revolutionary Times to the Present - The Iranian Peoples (Ossetians, Tajiks, Tats, Mountain Judaists). Greenwood Publishing Group. p. 80. ISBN 9780313293153. Archived from the original on 2016-07-29. Retrieved 2015-06-20.CS1 maint: multiple names: authors list (link)
- Gernot Windfuhr, "Persian Grammar: history and state of its study", Walter de Gruyter, 1979. pg 4:""Tat- Persian spoken in the East Caucasus""
- V. Minorsky, "Tat" in M. Th. Houtsma et al., eds., The Encyclopædia of Islam: A Dictionary of the Geography, Ethnography and Biography of the Muhammadan Peoples, 4 vols. and Suppl., Leiden: Late E.J. Brill and London: Luzac, 1913–38.
- V. Minorsky, "Tat" in M. Th. Houtsma et al., eds., The Encyclopædia of Islam: A Dictionary of the Geography, Ethnography and Biography of the Muhammadan Peoples, 4 vols. and Suppl., Leiden: Late E.J. Brill and London: Luzac, 1913–38. Excerpt: Like most Persian dialects, Tati is not very regular in its characteristic features"
- "It is a comparison of the verbal systems of three varieties of Persian—standard Persian, tat, tajik - Google Scholar". google.com. Archived from the original on 2013-09-17. Retrieved 2016-05-08.
- Borjian, Habib, "Tabari Language Materials from Il'ya Berezin's Recherches sur les dialectes persans", Iran and the Caucasus, Volume 10, Number 2, 2006, pp. 243-258(16). Excerpt:"It embraces Gilani, Ta- lysh, Tabari, Kurdish, Gabri, and the Tati Persian of the Caucasus, all but the last belonging to the north-western group of Iranian language."
- V. Minorsky. A History of Sharvan and Darband in the 10th–11th Centuries
- "Archived copy". Archived from the original on 2007-12-19. Retrieved 2008-03-27.CS1 maint: archived copy as title (link)
- "Two ethnicities, three generations: Phonological variation and change in Kuwait" (PDF). Newcastle University. 2010. p. 11. Archived from the original (PDF) on 2013-10-19. Retrieved 2013-07-12.
- Farmanfarmaian, Roxane (2008). War and Peace in Qajar Persia. Routledge. p. 128. ISBN 978-0415421195.
External links
| Wikimedia Commons has media related to Demographics of Iran. |
- Statistical Center of Iran
- BBC - Iran in Maps - Map of Iranian ethnic groups & population density
- Iran: A Vast Diaspora Abroad and Millions of Refugees at Home - Migration Information Institute (2006)
- Human Development Report - 2009 (UNDP Iran's entry)
- Videos
- Iran population decline alarms observers - PressTV (2014)
- Iran's population and the future plans - PressTV (2013)
Ethnic groups in Iran | ||
|---|---|---|
| Flag-map of Iran | |
Source for percentages is the CIA World Factbook. | ||
| Sovereign states |
|
|---|---|
| States with limited recognition | |
| Dependencies and other territories |
|
| |