Demographics of Cape Verde
This article is about the demographic features of the population of Cape Verde, including population density, ethnicity, education level, health of the populace, economic status, religious affiliations and other aspects of the population.
Cape Verde has a population of about 540,000 inhabitants who live in the islands. A large proportion (236,000) of Cape Verdeans live on the main island, Santiago.[1] Many more live abroad in the Cape Verdean diaspora in mainland Africa, Europe, U.S., Brazil, et cetera.
The archipelago of Cape Verde were first found and claimed by Portuguese sailors working for the Portuguese Crown in 1456. Cape Verdeans are West African. Many foreigners from other parts of the world settled in Cape Verde as their permanent country. Most of them were Dutch, French, British (English), Arab and Jewish (from Lebanon and Morocco). All of these have been absorbed into the mixed population.
The high degree of genetic mixture of individuals is a result of centuries of migration. It is not unusual to encounter persons with dark skin, blond hair, and blue eyes, and persons with seemingly light caucasian skin and textured curly hair.
Survival in a country with few natural resources has historically induced Cape Verdeans to emigrate. In fact, of the more than 1 million people of Cape Verdean ancestry in the world, only a little more than one-third actually live on the islands. Some 500,000 people of Cape Verdean ancestry live in the United States, mainly in New England. Many people of Cape Verdean ancestry also live in Portugal, Netherlands, France, Italy, Mexico, Uruguay, Argentina, and Senegal. Cape Verdean populations also settled Spain, Germany, Canada, and other CPLP countries (Angola, Brazil and Guinea-Bissau). Since after independence from Portugal in 1975, a number of Cape Verdean students continued to be admitted every year at Portuguese high schools, polytechnical institutes and universities, through bilateral agreements between the Portuguese and Cape Verdean governments.
Portuguese functions as a state language. Virtually all formal documents and official declarations are stated in Portuguese. But it is not the first language. Cape Verdean, commonly called Creolo, is spoken as a mother tongue by virtually all Cape Verdeans, irrespective of social status or religious affiliation. Moreover, historical linguists often attribute Cape Verdean Creole as the oldest "New World" contact language. It is a "contact" language in the sense that it was birthed and evolved between linguistically different groups who, by necessity, had to create a common language to communicate with each other. There is a rich repertoire of literature and songs in Cape Verdean Creole. In religion, the majority of Cape Verdeans follow Catholic Christianity. There are some Protestants, Bahá'ís and Muslims.
Population
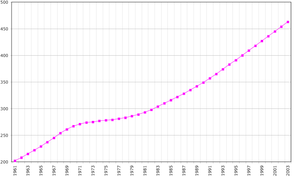
According to the 2019 revision of the World Population Prospects[2][3] the total population was 543,767 in 2018, compared to only 178,000 in 1950. The proportion of children below the age of 15 in 2010 was 31.8%, 62.3% was between 15 and 65 years of age, while 5.9% was 65 years or older.[4]
| Total population | Population aged 0–14 (%) | Population aged 15–64 (%) | Population aged 65+ (%) | |
|---|---|---|---|---|
| 1950 | 178,000 | 32.6 | 59.8 | 7.6 |
| 1955 | 195,000 | 35.8 | 57.9 | 6.2 |
| 1960 | 211,000 | 42.1 | 53.2 | 4.8 |
| 1965 | 240,000 | 48.5 | 47.3 | 4.2 |
| 1970 | 274,000 | 48.2 | 47.8 | 4 |
| 1975 | 311,000 | 45.8 | 49.6 | 4.6 |
| 1980 | 300,000 | 46 | 48.7 | 5.3 |
| 1985 | 328,000 | 44.5 | 50.5 | 5 |
| 1990 | 348,000 | 45.4 | 49.8 | 4.8 |
| 1995 | 395,000 | 44.5 | 50.5 | 5 |
| 2000 | 437,000 | 41.7 | 52.9 | 5.3 |
| 2005 | 473,000 | 37 | 57.2 | 5.8 |
| 2010 | 496,000 | 31.8 | 62.3 | 5.9 |
Vital statistics
Vital events of Cape Verde are not (yet) available for recent years. The Population Department of the United Nations prepared the following estimates.[4]
| Period | Live births per year | Deaths per year | Natural change per year | CBR* | CDR* | NC* | TFR* | IMR* |
|---|---|---|---|---|---|---|---|---|
| 1950-1955 | 9 000 | 4 000 | 5 000 | 49.0 | 22.6 | 26.3 | 6.57 | 139 |
| 1955-1960 | 10 000 | 4 000 | 5 000 | 48.0 | 21.1 | 26.9 | 6.76 | 132 |
| 1960-1965 | 10 000 | 4 000 | 6 000 | 45.0 | 18.7 | 26.3 | 6.97 | 125 |
| 1965-1970 | 11 000 | 4 000 | 6 000 | 41.4 | 16.4 | 25.0 | 6.97 | 117 |
| 1970-1975 | 12 000 | 4 000 | 8 000 | 41.1 | 13.4 | 27.7 | 6.86 | 96 |
| 1975-1980 | 13 000 | 4 000 | 9 000 | 41.6 | 11.6 | 30.0 | 6.62 | 78 |
| 1980-1985 | 13 000 | 3 000 | 10 000 | 41.3 | 10.3 | 31.0 | 6.10 | 65 |
| 1985-1990 | 14 000 | 3 000 | 11 000 | 40.9 | 9.2 | 31.7 | 5.63 | 54 |
| 1990-1995 | 14 000 | 3 000 | 11 000 | 36.5 | 7.9 | 28.6 | 4.93 | 44 |
| 1995-2000 | 13 000 | 3 000 | 10 000 | 31.6 | 6.7 | 24.9 | 4.15 | 37 |
| 2000-2005 | 12 000 | 3 000 | 9 000 | 26.2 | 5.8 | 20.5 | 3.28 | 28 |
| 2005-2010 | 11 000 | 3 000 | 8 000 | 21.9 | 5.2 | 16.7 | 2.60 | 21 |
| * CBR = crude birth rate (per 1000); CDR = crude death rate (per 1000); NC = natural change (per 1000); IMR = infant mortality rate per 1000 births; TFR = total fertility rate (number of children per woman) | ||||||||
Births and deaths[5]
| Year | Population (x1000) | Live births | Deaths | Natural increase | Crude birth rate | Crude death rate | Rate of natural increase | TFR |
|---|---|---|---|---|---|---|---|---|
| 2009 | 13 044 | 2 897 | 10 147 | 25,6 | 5,7 | 19,9 | ||
| 2010 | 13 415 | 2 917 | 10 498 | 25,9 | 5,6 | 20,3 | ||
Fertility and births
Total fertility rate (TFR) (wanted fertility rate) and crude birth rate (CBR):[6]
| Year | CBR (Total) | TFR (Total) | CBR (Urban) | TFR (Urban) | CBR (Rural) | TFR (Rural) |
|---|---|---|---|---|---|---|
| 2005 | 22 | 2,9 (2,8) | 23 | 2,7 (2,7) | 22 | 3,1 (3,0) |
Fertility data from 2005 (DHS Program):[7]
| Region | Total fertility rate | Percentage of women age 15-49 currently pregnant | Mean number of children ever born to women age 40-49 |
|---|---|---|---|
| Santo Antão | 2.9 | 3.8 | 6.0 |
| São Vicente | 2.0 | 3.4 | 4.0 |
| São Nicolau | 3.3 | 4.4 | 4.2 |
| Sal | 3.2 | 7.0 | 3.9 |
| Boa Vista | 2.4 | 10.0 | 4.4 |
| Maio | 2.6 | 1.7 | 4.3 |
| Santiago | 3.1 | 5.4 | 4.5 |
| Praia Urbano | 3.2 | 5.1 | 4.5 |
| Santiago Norte | 2.7 | 6.2 | 4.3 |
| Resto Santiago | 3.3 | 4.6 | 4.8 |
| Fogo | 3.1 | 6.3 | 5.6 |
| Brava | 2.8 | 7.0 | 5.0 |
Life expectancy
| Period | Life expectancy in Years[8] |
|---|---|
| 1950–1955 | 48.08 |
| 1955–1960 | |
| 1960–1965 | |
| 1965–1970 | |
| 1970–1975 | |
| 1975–1980 | |
| 1980–1985 | |
| 1985–1990 | |
| 1990–1995 | |
| 1995–2000 | |
| 2000–2005 | |
| 2005–2010 | |
| 2010–2015 |
Other demographic statistics
Demographic statistics according to the World Population Review in 2019.[9]
- One birth every 46 minutes
- One death every 180 minutes
- One net migrant every 360 minutes
- Net gain of one person every 76 minutes
The following demographic statistics are from the CIA World Factbook.[10]
Population
568,373 (July 2018 est.)
Age structure

- 0-14 years: 28.7% (male 82,035 /female 81,082)
- 15-24 years: 19.64% (male 55,811 /female 55,798)
- 25-54 years: 40.02% (male 110,646 /female 116,804)
- 55-64 years: 6.4% (male 16,154 /female 20,245)
- 65 years and over: 5.24% (male 11,272 /female 18,526) (2018 est.)
Median age
- total: 25.8 years. Country comparison to the world: 153rd
- male: 25 years
- female: 26.7 years (2018 est.)
- Total: 23.1 years
- Male: 22.3 years
- Female: 23.9 years (2012 est.)
Population growth rate
- 1.32% (2018 est.) Country comparison to the world: 83rd
Birth rate
- 19.7 births/1,000 population (2018 est.) Country comparison to the world: 79th
Death rate
- 6 deaths/1,000 population (2018 est.) Country comparison to the world: 163rd
Net migration rate
- -0.6 migrant(s)/1,000 population (2017 est.) Country comparison to the world: 128th
Total fertility rate
- 2.21 children born/woman (2018 est.) Country comparison to the world: 95th
Urbanization
- urban population: 65.7% of total population (2018)
- rate of urbanization: 1.97% annual rate of change (2015-20 est.)
Sex ratio
- At birth: 1.03 male(s)/female
- Under 15 years: 1.01 male(s)/female
- 15-64 years: 0.97 male(s)/female
- 65 years and over: 0.58 male(s)/female
- Total population: 0.95 male(s)/female (2009 est.)
Life expectancy at birth
- total population: 72.7 years (2018 est.)
- male: 70.3 years (2018 est.)
- female: 75.1 years (2018 est.) Country comparison to the world: 147th
- Total population: 71 years
- Male: 68.78 years
- Female: 73.27 years (2012 est.)
HIV/AIDS
- Adult prevalence rate: 0.035% (2001 est.)
- People living with HIV/AIDS: 775 (2001)
- Deaths: 225 (as of 2001)
Genetics
- The predominance of west African mitochondrial DNA haplotypes in their maternal gene pool, the major west African Y-chromosome lineage E3a was observed only at a frequency of 15.9%. Overall, these results indicate that gene flow from multiple sources and sex-specific patterns have been important in the formation of the genomic diversity in the Cabo Verde islands.[11]
Religions
- Catholic 77.3%, Protestant 3.7% (includes Church of the Nazarene 1.7%, Adventist 1.5%, Universal Kingdom of God 0.4%, and God and Love 0.1%), other Christian 4.3% (includes Christian Rationalism 1.9%, Jehovah's Witness 1%, Assembly of God 0.9%, and New Apostolic 0.5%), Islam 1.8%, Other 1.3%, None 10.8%, Unspecified 0.7% [12]
Languages
- Portuguese (official), Crioulo (a blend of Portuguese and West African words)[12]
Literacy
- Definition: age 15 and over can read and write
- Total population: 76.6%
- Male: 85.8%
- Female: 69.2% (2003 est.)
School life expectancy (primary to tertiary education)
- total: 12 years (2017)
- male: 12 years (2017)
- female: 12 years (2017)
Dependency ratios
- total dependency ratio: 55.4 (2015 est.)
- youth dependency ratio: 48.4 (2015 est.)
- elderly dependency ratio: 6.9 (2015 est.)
- potential support ratio: 14.4 (2015 est.)
See also
References
- "Cape Verde: Population". Caperverde.com. Retrieved 3 October 2017.
- ""World Population prospects – Population division"". population.un.org. United Nations Department of Economic and Social Affairs, Population Division. Retrieved November 9, 2019.
- ""Overall total population" – World Population Prospects: The 2019 Revision" (xslx). population.un.org (custom data acquired via website). United Nations Department of Economic and Social Affairs, Population Division. Retrieved November 9, 2019.
- "Population Division of the Department of Economic and Social Affairs of the United Nations Secretariat, World Population Prospects: The 2010 Revision". Esa.un.org. Retrieved 3 October 2017.
- "United Nations Statistics Division - Demographic and Social Statistics". unstats.un.org. Retrieved 3 October 2017.
- "Server Error". microdata.worldbank.org. Retrieved 3 October 2017.
- "Inquérito Demográfico e de Saúde Reprodutiva (IDSR-II)" (PDF). Dhsprogram.com. 2005. Retrieved 2 October 2017.
- "World Population Prospects - Population Division - United Nations". esa.un.org. Retrieved 2018-08-26.
- "Cape Verde Population 2019", World Population Review
- "The World FactBook - Cameroon", The World Factbook, July 12, 2018

- Gonçalves, Rita; Alexandra Rosa; Ana Freitas; Ana Fernandes; Toomas Kivisild; Richard Villems; António Brehm (26 August 2003). "Y-chromosome lineages in Cabo Verde Islands witness the diverse geographic origin of its first male settlers". Human Genetics. 113 (6): 467–472. doi:10.1007/s00439-003-1007-4. PMID 12942365.
- "Africa :: CAPE VERDE". CIA The World Factbook.
![]()
External links
| Wikimedia Commons has media related to Demographics of Cape Verde. |
- National Institute of Statistics
- Demographic Highlights — Statistics from the Population Reference Bureau