Demographics of Belize
This article is about the demographic features of the population of Belize, including population density, ethnicity, education level, health of the populace, economic status, religious affiliations and other aspects of the population.
Belize is the most sparsely populated nation in Central America. It is larger than El Salvador. Slightly more than half of the people live in rural areas. About one-fourth live in Belize City, the principal port, commercial centre, and former capital. About 80% of the population are Christian.
Most Belizeans are of multiracial descent. About 34% of the population is of mixed Indigenous (mostly Maya) and European descent (Mestizo), 35% are Kriols, about 10.6% are Maya, and about 6.1% are Afro-Amerindian (Garifuna).[1] The remaining population includes European, East Indian, Chinese, Middle Eastern, and North American groups. In the case of Europeans, most are descendants of Spanish and British colonial settlers, whether pure-blooded or mixed with each other. Most Spanish left the nation just after it was taken by the British colonists who, in the same way, left after independence. Dutch and German Mennonites settled in Belize, mostly in isolated areas.
Belize's largest cities and towns by population
- Belize City, BZ - 67,169
- San Ignacio, CY - 27,878
- Belmopan, CY - 19,931
- Orange Walk Town, OW - 13,709
- San Pedro, BZ - 11,765
- Corozal Town, CZ - 10,287
- Dangriga, SC - 9,591
- Benque Viejo del Carmen, CY - 6,148
- Ladyville, BZ - 5,458
- Punta Gorda, TO - 6,351
- Based on 2010 census.
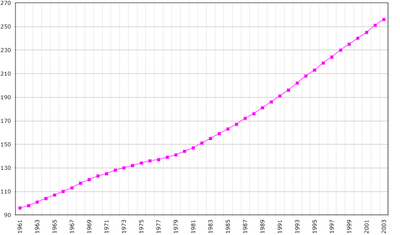
Population
According to the Statistical Institute of Belize, the current population stands at 408,487.[2]
In conjunction with a census of the British Empire, census data was compiled for Belize in 1861, 1871, 1881, 1891, 1901, 1911, 1921, 1931 and 1946. Belize conducted its own censuses in 1960, 1970, 1980, 1991 and in 2000. None has been held since then.
Ethnic groups
Most Belizeans are of multiracial descent. About 52.9% are Mestizo, 25.9% Creole, 11.3% Maya, 6.1.% Garifuna, 3.9% East Indian, 3.6% Mennonites, 1.2% White, 1% Asian, 1.2% Other and 0.3% Unknown.[3]
In the case of Europeans, most are descendants of Spanish and British colonial settlers, whether pure-blooded or mixed with each other. Most Spanish left the nation just after it was taken by the British colonists who, in the same way, left after independence. Beginning in 1958, German Mennonites of "Russian" Mennonite and Pennsylvania Dutch heritage settled in Belize, mostly in isolated areas.
Maya
Because Belize's original Maya peoples were decimated by disease and wars, or fled to Mexico and Guatemala, most of the country's Maya today are descended from other groups. The current Maya population consists mainly of three language groups. The Yucatec fled to Belize in the late 1840s to escape the Caste War in Yucatán, Mexico. Their descendants live in the Orange Walk and Corozal districts, which border on Mexico. Before the massive migration of Yucatec Maya from Mexico to Belize, a local Yucatec Maya group named the Iciache Maya already inhabited the land. Today most Yucatec Maya work in the sugar cane. In the 1870s-1880s, many Q'eqchi' fled from Alta Verapaz, Guatemala, where their lands were being stolen for coffee plantations, which then enslaved them. They settled villages in the Toledo district.
Living near rivers and streams, they are primarily farmers, though many younger people now work in tourism, and on shrimp, banana and citrus plantations. The Mopans originated in Belize, but most were driven out to Guatemala after the British displaced Spanish in a struggle that took most of the 18th century. They returned to Belize in 1886, running from enslavement and taxation in Petén. The Cayo district and San Antonio in the Toledo district are their homes now. Q'eqchi' and Mopan have intermarried, though the two languages remain distinct and mutually unintelligible.
| Ethnic group |
Census 1946 | Census 1991 | Census 2000[1] | Census 2010 | ||||
|---|---|---|---|---|---|---|---|---|
| Number | % | Number | % | Number | % | Number | % | |
| Q'eqchi' Maya | 10,030 | 16.9 | 7,954 | 4.3 | 12,366 | 5.3 | 17,409 | 5.7 |
| Mopan Maya | 6,770 | 3.7 | 8,980 | 3.9 | 10,557 | 3.5 | ||
| Yucatec/other Maya | 5,686 | 3.1 | 3,155 | 1.4 | 2,141 | 0.7 | ||
| Mestizo/Spanish/Latino | 18,360 | 31.0 | 80,477 | 43.6 | 113,045 | 48.7 | 150,921 | 49.7 |
| Creole | 22,693 | 38.3 | 55,051 | 29.8 | 57,859 | 24.9 | 63,057 | 21.8 |
| Black African | 582 | 0.3 | 1,151 | 0.4 | ||||
| Garifuna | 4,112 | 6.9 | 12,274 | 6.6 | 14,061 | 6.1 | 13,985 | 4.6 |
| White * German Mennonite * Other white | 2,329 0 2,329 | 3.9 0 3.9 | 7,257 5,763 1,494 | 3.9 3.1 0.8 | 10,034 8,276 1,758 | 4.3 3.6 0.8 | 13,964 10,865 3,099 | 4.6 3.6 1.0 |
| East Indian | 1,366 | 2.3 | 6,455 | 3.5 | 6,868 | 3.0 | 7,073 | 2.3 |
| Chinese/Asians | 50 | 0.1 | 747 | 0.4 | 1,716 | 0.7 | 2,823 | 0.9 |
| Mixed | 18,947 | 6.2 | ||||||
| Syrian/Lebanese | 128 | 0.2 | 167 | 0.1 | 240 | 0.1 | ||
| Other | 1,867 | 1.0 | 2,610 | 1.1 | 762 | 0.3 | ||
| Unknown | 152 | 0.3 | 17 | 0.0 | 835 | 0.4 | 392 | 0.1 |
| Total | 59,220 | 184,722 | 232,111 | 324,528 | ||||
Birth Rate by Ethnic Groups (2000 Census)[6]
| Ethnic Group | Population (2000) | Birth Rate (1999) | Births |
| African | 582 | 17.18 | 10 |
| British | 1,758 | 9.10 | 16 |
| Chinese | 1,716 | 19.23 | 33 |
| Creole | 57,859 | 28.88 | 1,671 |
| East Indian | 6,868 | 27.66 | 190 |
| Garifuna | 14,061 | 27.17 | 382 |
| Q'eqchi' | 12,366 | 44.88 | 555 |
| Mopan | 8,980 | 35.30 | 317 |
| Yucatec | 3,155 | 19.33 | 61 |
| Mennonite | 8,276 | 42.53 | 352 |
| Mestizo | 78,537 | 29.73 | 2,335 |
| Spanish | 34,508 | 32.22 | 1,112 |
| Other | 2,610 | 21.84 | 57 |
| Not Available | 835 | 45.51 | 38 |
| Total | 232,111 | 30.71 | 7,128 |
Vital statistics[7][8][9]
| Average population | Live births | Deaths | Natural change | Crude birth rate (per 1000) | Crude death rate (per 1000) | Natural change (per 1000) | Total fertility rate[10] | Infant mortality rate[10] | |
|---|---|---|---|---|---|---|---|---|---|
| 1934 | 52,000 | 1,945 | 971 | 974 | 37.4 | 18.7 | 18.7 | ||
| 1935 | 53,000 | 2,081 | 1,377 | 704 | 39.3 | 26.0 | 13.3 | ||
| 1936 | 53,000 | 1,879 | 1,256 | 623 | 35.5 | 23.7 | 11.8 | ||
| 1937 | 54,000 | 1,876 | 1,054 | 822 | 34.7 | 19.5 | 15.2 | ||
| 1938 | 54,000 | 2,052 | 1,178 | 874 | 38.0 | 21.8 | 16.2 | ||
| 1939 | 55,000 | 2,084 | 1,092 | 992 | 37.9 | 19.9 | 18.0 | ||
| 1940 | 56,000 | 2,192 | 986 | 1,206 | 39.1 | 17.6 | 21.5 | ||
| 1941 | 57,000 | 2,133 | 1,030 | 1,103 | 37.4 | 18.1 | 19.4 | ||
| 1942 | 57,000 | 1,905 | 1,250 | 655 | 33.4 | 21.9 | 11.5 | ||
| 1943 | 58,000 | 1,925 | 1,136 | 789 | 33.2 | 19.6 | 13.6 | ||
| 1944 | 58,000 | 2,031 | 1,153 | 878 | 35.0 | 19.9 | 15.1 | ||
| 1945 | 59,000 | 2,141 | 1,204 | 937 | 36.3 | 20.4 | 15.9 | ||
| 1946 | 59,000 | 2,065 | 1,019 | 1,046 | 35.0 | 17.3 | 17.7 | ||
| 1947 | 61,000 | 2,473 | 1,049 | 1,424 | 40.5 | 17.2 | 23.3 | ||
| 1948 | 63,000 | 2,506 | 861 | 1,645 | 39.8 | 13.7 | 26.1 | ||
| 1949 | 65,000 | 2,548 | 877 | 1,671 | 39.2 | 13.5 | 25.7 | ||
| 1950 | 69,000 | 2,657 | 845 | 1,812 | 39.7 | 12.6 | 27.0 | ||
| 1951 | 71,000 | 2,905 | 801 | 2,104 | 42.1 | 11.6 | 30.5 | ||
| 1952 | 73,000 | 3,028 | 794 | 2,234 | 42.1 | 11.0 | 31.0 | ||
| 1953 | 76,000 | 2,986 | 820 | 2,166 | 40.4 | 11.1 | 29.3 | ||
| 1954 | 78,000 | 3,231 | 876 | 2,355 | 42.5 | 11.5 | 31.0 | ||
| 1955 | 80,000 | 3,463 | 858 | 2,605 | 44.4 | 11.0 | 33.4 | ||
| 1956 | 82,000 | 3,725 | 821 | 2,904 | 46.0 | 10.1 | 35.9 | ||
| 1957 | 85,000 | 3,615 | 932 | 2,683 | 43.6 | 11.2 | 32.3 | ||
| 1958 | 87,000 | 3,988 | 795 | 3,193 | 46.4 | 9.2 | 37.1 | ||
| 1959 | 89,000 | 4,016 | 730 | 3,286 | 45.6 | 8.3 | 37.3 | ||
| 1960 | 92,000 | 4,091 | 717 | 3,374 | 45.0 | 7.9 | 37.1 | ||
| 1961 | 95,000 | 4,244 | 708 | 3,536 | 45.6 | 7.6 | 38.0 | ||
| 1962 | 97,000 | 4,461 | 853 | 3,608 | 47.0 | 9.0 | 38.0 | ||
| 1963 | 100,000 | 4,783 | 712 | 4,071 | 48.8 | 7.3 | 41.5 | ||
| 1964 | 103,000 | 4,568 | 729 | 3,839 | 45.2 | 7.2 | 38.0 | ||
| 1965 | 106,000 | 4,637 | 710 | 3,927 | 44.6 | 6.8 | 37.8 | ||
| 1966 | 109,000 | 4,898 | 776 | 4,122 | 45.8 | 7.3 | 38.5 | ||
| 1967 | 113,000 | 4,851 | 811 | 4,040 | 43.7 | 7.3 | 36.4 | ||
| 1968 | 116,000 | 4,671 | 714 | 3,957 | 41.0 | 6.3 | 34.7 | ||
| 1969 | 119,000 | 4,660 | 783 | 3,877 | 39.8 | 6.7 | 33.1 | ||
| 1970 | 122,000 | 4,455 | 813 | 3,642 | 37.1 | 6.8 | 30.4 | ||
| 1971 | 125,000 | 5,052 | 625 | 4,427 | 41.4 | 5.1 | 36.3 | ||
| 1972 | 127,000 | 4,954 | 669 | 4,285 | 40.0 | 5.4 | 34.6 | ||
| 1973 | 129,000 | 5,010 | 801 | 4,303 | 39.8 | 6.4 | 34.2 | ||
| 1974 | 131,000 | 5,039 | 721 | 4,379 | 39.4 | 5.6 | 34.2 | ||
| 1975 | 133,000 | 5,201 | 800 | 4,401 | 40.0 | 6.2 | 33.9 | ||
| 1976 | 135,000 | 5,340 | 881 | 4,459 | 40.2 | 6.6 | 33.5 | ||
| 1977 | 137,000 | 5,570 | 767 | 4,803 | 41.0 | 5.6 | 35.3 | ||
| 1978 | 139,000 | 5,384 | 885 | 4,499 | 38.7 | 6.4 | 32.4 | ||
| 1979 | 141,000 | 5,523 | 710 | 4,813 | 38.9 | 5.0 | 33.9 | ||
| 1980 | 144,000 | 6,264 | 717 | 5,547 | 43.2 | 4.9 | 38.3 | ||
| 1981 | 148,000 | 5,821 | 709 | 5,112 | 39.1 | 4.8 | 34.3 | ||
| 1982 | 151,000 | 5,899 | 663 | 5,236 | 38.6 | 4.3 | 34.3 | ||
| 1983 | 156,000 | 6,044 | 724 | 5,320 | 38.2 | 4.6 | 33.6 | ||
| 1984 | 160,000 | 5,756 | 750 | 5,006 | 38.0 | 4.9 | 33.0 | ||
| 1985 | 165,000 | 5,916 | 693 | 5,223 | 35.6 | 4.2 | 31.5 | ||
| 1986 | 170,000 | 6,136 | 688 | 5,448 | 36.2 | 4.1 | 32.1 | ||
| 1987 | 174,000 | 6,121 | 675 | 5,446 | 35.1 | 3.9 | 31.3 | ||
| 1988 | 179,000 | 6,325 | 708 | 5,617 | 35.4 | 4.0 | 31.4 | ||
| 1989 | 183,000 | 6,686 | 762 | 5,924 | 36.5 | 4.2 | 32.3 | ||
| 1990 | 188,000 | 7,200 | 819 | 6,381 | 38.4 | 4.4 | 34.0 | ||
| 1991 | 191,000 | 6,555 | 842 | 5,713 | 34.3 | 4.4 | 29.9 | ||
| 1992 | 195,000 | 7,597 | 846 | 6,751 | 39.0 | 4.3 | 34.6 | ||
| 1993 | 198,000 | 6,462 | 935 | 5,527 | 32.6 | 4.7 | 27.9 | ||
| 1994 | 202,000 | 5,887 | 944 | 4,943 | 29.1 | 4.7 | 24.4 | ||
| 1995 | 207,000 | 6,623 | 931 | 5,692 | 32.0 | 4.5 | 27.5 | ||
| 1996 | 212,000 | 6,678 | 964 | 5,714 | 31.4 | 4.5 | 26.9 | ||
| 1997 | 218,000 | 7,348 | 1,173 | 6,175 | 33.6 | 5.4 | 28.3 | ||
| 1998 | 225,000 | 6,844 | 1,350 | 5,494 | 30.4 | 6.0 | 24.4 | ||
| 1999 | 232,000 | 7,113 | 1,190 | 5,923 | 30.7 | 5.1 | 25.5 | ||
| 2000 | 239,000 | 7,313 | 1,534 | 5,779 | 30.7 | 6.4 | 24.2 | ||
| 2001 | 245,000 | 7,215 | 1,261 | 5,954 | 29.4 | 5.1 | 24.3 | ||
| 2002 | 252,000 | 7,553 | 1,284 | 6,269 | 30.0 | 5.1 | 24.9 | ||
| 2003 | 258,000 | 7,440 | 1,277 | 6,163 | 28.8 | 4.9 | 23.9 | ||
| 2004 | 265,000 | 8,083 | 1,298 | 6,785 | 30.5 | 4.9 | 25.6 | ||
| 2005 | 283,000 | 8,396 | 1,369 | 7,027 | 29.6 | 4.8 | 24.8 | 3.6 | 18.4 |
| 2006 | 291,000 | 7,171 | 1,396 | 5,775 | 24.6 | 4.8 | 19.8 | 3.0 | 19.6 |
| 2007 | 298,000 | 7,036 | 1,389 | 5,647 | 23.5 | 4.6 | 18.9 | 2.9 | 17.2 |
| 2008 | 306,000 | 7,126 | 1,302 | 5,824 | 23.2 | 4.2 | 19.0 | 2.8 | 12.0 |
| 2009 | 315,000 | 7,417 | 1,453 | 5,964 | 23.5 | 4.6 | 18.8 | 18.9 | |
| 2010 | 323,000 | 7,228 | 1,554 | 5,674 | 22.3 | 4.8 | 17.5 | 13.6 | |
| 2011 | 332,000 | 7,217 | 1,554 | 5,663 | 21.7 | 4.7 | 17.1 | 16.5 | |
| 2012 | 340,000 | 7,125 | 1,650 | 5,475 | 20.9 | 4.5 | 16.4 | 2.40 | |
| 2013 | 349,000 | 7,264 | 1,637 | 5,627 | 20.8 | 4.7 | 16.1 | 2.39 | |
| 2014 | 358,000 | 7,318 | 1,620 | 5,698 | 20.4 | 4.5 | 15.9 | 2.35 | |
| 2015 | 370,000 | 7,456 | 1,772 | 5,684 | 20.1 | 4.8 | 15.3 | 2.34 | |
| 2016 | 387,000 | 7,200 | 1,796 | 5,404 | 18.6 | 4.6 | 14.0 | 2.20 | |
| 2017 | |||||||||
| 2018 | 398,050 | 7,775 | 1,886 | 5,889 | 19.5 | 4.7 | 14.8 |
Languages
English is the only official language of Belize, a relic of past British colonization. It is the main language used in government and education.[11] Although only 5.6% of the population speaks it as the main language at home, 54% can speak it very well, and another 26% can speak some English. 37% of Belizeans consider their primary language to be Kriol, an English-based creole of words and syntax from various African languages (namely Akan, Igbo, and Twi),[12] and other languages (Miskito, Caliche). It is also a second or third language for another 40% of the multilingual country.
Kriol shares similarities with many Caribbean English Creoles as far as phonology and pronunciations are concerned. Also, many of its words and structures are both lexically and phonologically similar to English, its superstrate language. Because it is English-based, all Kriol speakers can understand English. A number of linguists classify Belizean Kriol as a separate language, while others consider it to be a dialect of English.
Spanish is the mother tongue of Mestizo and Central American refugees and is commonly spoken at home by 43% of the population. Maya dialects such as Q'eqchi', Mopan and Yucatec are spoken. Garifuna (which is Arawakan/Maipurean based, with elements of the Carib language, French, and Spanish) and the Plautdietsch and Pennsylvania German dialects of the Mennonites are spoken as well. Literacy currently stands at nearly 80%. In 2001, UNESCO declared the Garifuna language, dance, and music a "Masterpiece of the Oral and Intangible Heritage of Humanity". English is the primary language of public education, with Spanish taught in primary and secondary school as well. Bilingualism is highly encouraged, and therefore, very common.
| English & Spanish Language Proficiency[1] | ||||
|---|---|---|---|---|
| Language | Speaks Very Well | Speaks Some | Total | |
| English | 54% | 26% | 80% | |
| Spanish | 52% | 11% | 63% | |
| Language | Percentage |
|---|---|
| English | 62.9% |
| Spanish | 56.6% |
| Creole | 44.6% |
| Maya | 10.5% |
| German | 3.2% |
| Garifuna | 2.9% |
| Other | 1.8% |
| unknown | 0.3% |
| none (cannot speak) | 0.2% |
Religion
According to the 2010 census[13][14] Catholics constitute 40.0% of the population of Belize, down from 49.6% in 2000 and 57.7% in 1991;[15] Protestants constitute 31.7% of the population, with a slight growth in percentage for some groups since 2000 (8.5% Pentecostal; 5.5% Adventist; 4.6% Anglican; 3.8% Mennonite; 3.6% Baptist; 2.9% Methodist; 2.8% Nazarene); Jehova's Witnesses are 1.7% of the population. 10.2% of Belizeans follow other religions (with a growth in percentage since 2000); amongst these there are followers of the indigenous Maya religion, Garifuna religion, Obeah and Myalism, and minorities of Mormons, Hindus, Buddhists, Muslims, Baha'is, Rastafarians and other.[16] The Mennonites, of German descent, live mostly in the rural districts of Cayo and Orange Walk. 15.6% of the Belizean population do not adhere to any religion, up from 9.4% in 2000.
Belizean Roman Catholic churches belong to the Diocese of Belize City-Belmopan; Anglican churches belong to the Diocese of Belize, part of the Church in the Province of the West Indies. Hinduism is followed by most Indian immigrants, while Islam is common among Middle Eastern immigrants and has gained a following among some Kriols. Catholics frequently visit the country for special gospel revivals. The Greek Orthodox Church has a presence in Santa Elena.[17]
The Constitution of Belize provides for freedom of religion, and other laws and policies contribute to the generally free practice of religion. The Government at all levels protects this right in full against abuse, either by governmental or private actors. The Government generally respects religious freedom in practice. In 2008, the U.S. government received no reports of societal abuses or discrimination based on religious affiliation, belief, or practice.
| Religion | Percentage |
|---|---|
| Catholic | 40.1% |
| Protestant | 31.5% |
| Pentecostal | 8.4% |
| Seventh-day Adventist | 5.4% |
| Anglican | 4.7%, |
| Mennonite | 3.7% |
| Baptist | 3.6% |
| Methodist | 2.9% |
| Nazarene | 2.8% |
| Jehovah's Witness | 1.7% |
| Other (includes Baha'i, Buddhist, Hindu, Mormon, Islam, Rastafarian) | 10.5% |
| Unknown | 0.6% |
| None | 15.5% |
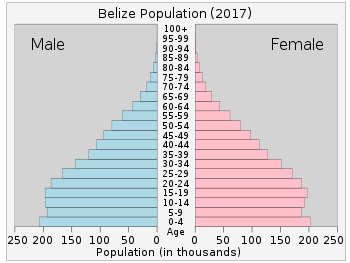
Structure of the population
| Age Group | Male | Female | Total | % |
|---|---|---|---|---|
| Total | 193 942 | 193 937 | 387 879 | 100 |
| 0-4 | 23 163 | 22 116 | 45 330 | 11,68 |
| 5-9 | 23 771 | 23 424 | 47 195 | 12,17 |
| 10-14 | 22 693 | 22 659 | 45 352 | 11,69 |
| 15-19 | 20 850 | 20 831 | 41 681 | 10,75 |
| 20-24 | 18 046 | 18 695 | 36 741 | 9,47 |
| 25-29 | 15 427 | 16 458 | 31 885 | 8,22 |
| 30-34 | 13 335 | 14 137 | 27 472 | 7,08 |
| 35-39 | 12 144 | 12 732 | 24 876 | 6,41 |
| 40-44 | 10 367 | 10 495 | 20 862 | 5,38 |
| 45-49 | 9 187 | 8 802 | 17 989 | 4,64 |
| 50-54 | 7 152 | 6 949 | 14 101 | 3,64 |
| 55-59 | 5 416 | 4 976 | 10 392 | 2,68 |
| 60-64 | 3 957 | 3 527 | 7 484 | 1,93 |
| 65-69 | 2 814 | 2 474 | 5 288 | 1,36 |
| 70-74 | 2 230 | 1 975 | 4 205 | 1,08 |
| 75-79 | 1 564 | 1 518 | 3 082 | 0,79 |
| 80+ | 1 776 | 1 994 | 3 770 | 0,97 |
| Age group | Male | Female | Total | Percent |
|---|---|---|---|---|
| 0-14 | 62 824 | 61 649 | 124 473 | 35,59 |
| 15-64 | 104 484 | 106 035 | 210 519 | 60,20 |
| 65+ | 7 557 | 7 179 | 14 736 | 4,21 |
Life expectancy at birth
| Period | Life expectancy in
Years |
Period | Life expectancy in
Years |
|---|---|---|---|
| 1950–1955 | 55.9 | 1985–1990 | 71.5 |
| 1955–1960 | 58.6 | 1990–1995 | 70.6 |
| 1960–1965 | 61.3 | 1995–2000 | 68.6 |
| 1965–1970 | 64.3 | 2000–2005 | 68.5 |
| 1970–1975 | 66.7 | 2005–2010 | 69.5 |
| 1975–1980 | 68.6 | 2010–2015 | 69.8 |
| 1980–1985 | 70.4 |
Source: UN World Population Prospects[19]
Other demographics statistics
Demographic statistics according to the World Population Review in 2019.[20]
- One birth every 63 minutes
- One death every 240 minutes
- One net migrant every 360 minutes
- Net gain of one person every 69 minutes
Demographic statistics according to the CIA World Factbook, unless otherwise indicated.[3]
- Population
- 385,854 (July 2018 est.)
- Ethnic groups
- This entry provides an ordered listing of ethnic groups starting with the largest and normally includes the percent of total population. Ethnic groups field listing
- mestizo 52.9%, Creole 25.9%, Maya 11.3%, Garifuna 6.1%, East Indian 3.9%, Mennonite 3.6%, white 1.2%, Asian 1%, other 1.2%, unknown 0.3% (2010 est.)
- note: percentages add up to more than 100% because respondents were able to identify more than one ethnic origin
- Languages
- English 62.9% (official), Spanish 56.6%, Creole 44.6%, Maya 10.5%, German 3.2%, Garifuna 2.9%, other 1.8%, unknown 0.3%, none 0.2% (cannot speak) (2010 est.)
- note: shares sum to more than 100% because some respondents gave more than one answer on the census
- Age structure
- 0-14 years: 33.61% (male 66,207 /female 63,466)
- 15-24 years: 18.74% (male 37,184 /female 35,127)
- 25-54 years: 37.43% (male 70,222 /female 74,187)
- 55-64 years: 5.88% (male 11,397 /female 11,284)
- 65 years and over: 4.35% (male 8,293 /female 8,487) (2018 est.)
- Median age
- total: 23.7 years. Country comparison to the world: 168th
- male: 23.2 years
- female: 24.4 years (2018 est.)
- Birth rate
- 22.9 births/1,000 population (2018 est.) Country comparison to the world: 63rd
- Death rate
- 4.2 deaths/1,000 population (2018 est.) Country comparison to the world: 206th
- Total fertility rate
- 2.8 children born/woman (2018 est.) Country comparison to the world: 60th
- Net migration rate
- -0.6 migrant(s)/1,000 population (2018 est.) Country comparison to the world: 129th
- Population growth rate
- 1.8% (2018 est.) Country comparison to the world: 57th
- Contraceptive prevalence rate
- 51.4% (2015/16)
- Dependency ratios
- total dependency ratio: 56.8 (2015 est.)
- youth dependency ratio: 50.9 (2015 est.)
- elderly dependency ratio: 5.9 (2015 est.)
- potential support ratio: 17 (2015 est.)
- Religions
Roman Catholic 40.1%, Protestant 31.5% (includes Pentecostal 8.4%, Seventh Day Adventist 5.4%, Anglican 4.7%, Mennonite 3.7%, Baptist 3.6%, Methodist 2.9%, Nazarene 2.8%), Jehovah's Witness 1.7%, other 10.5% (includes Baha'i, Buddhist, Hindu, Mormon, Muslim, Rastafarian, Salvation Army), unspecified 0.6%, none 15.5% (2010 est.)
- Life expectancy at birth
- total population: 74.7 years
- male: 73.1 years
- female: 76.3 years (2018 est.)
- Urbanization
- urban population: 45.7% of total population (2018)
- rate of urbanization: 2.32% annual rate of change (2015-20 est.)
- School life expectancy (primary to tertiary education)
- total: 13 years
- male: 13 years
- female: 13 years (2017)
- Unemployment, youth ages 15–24
- total: 17.7%. Country comparison to the world: 73rd
- male: 11%
- female: 28.4% (2016 est.)
See also
- Kriols
- Garifuna people
- Maya peoples
- Mennonites in Belize
- Indians in Belize
- Ethnic groups in Central America
References
- "Belize 2000 Housing and Population Census". Belize Central Statistical Office. 2000. Archived from the original on 20 December 2008. Retrieved 9 September 2008.
- http://sib.org.bz/
- "World Factbook CENTRAL AMERICA : BELIZE", The World Factbook, 12 July 2018

- UN Demographic Yearbooks
- "Archived copy" (PDF). Archived from the original (PDF) on 12 August 2011. Retrieved 7 June 2012.CS1 maint: archived copy as title (link)
- http://celade.cepal.org/cgibin/RpWebEngine.exe/PortalAction?&MODE=MAIN&BASE=CPVBLZ2000&MAIN=WebServerMain.inl%5B%5D
- United nations. Demographic Yearbooks
- Statistical Institute of Belize
- "Archived copy" (PDF). Archived from the original (PDF) on 16 September 2012. Retrieved 31 December 2013.CS1 maint: archived copy as title (link)
- "Archived copy" (PDF). Archived from the original (PDF) on 16 September 2012. Retrieved 31 December 2013.CS1 maint: archived copy as title (link)
- "Belize: Language and Religion". MSN Encarta Encyclopedia. Microsoft Corporation. Archived from the original on 1 November 2009. Retrieved 9 September 2008.
- "Archived copy". Archived from the original on 28 September 2008. Retrieved 5 October 2008.CS1 maint: archived copy as title (link)
- "2010 Census of Belize Overview". 2011. Archived from the original on 29 May 2012. Retrieved 10 May 2012.
- "2010 Census of Belize Detailed Demographics of 2000 and 2010". 2011. Retrieved 10 May 2012.
- Belize 2000 Census Archived 25 January 2012 at the Wayback Machine.
- Clifton L. Holland. Population of Belize by Religion: 1970-2000. PROLADES.
- Orthodox Church of Belize homepage
- https://unstats.un.org/unsd/demographic-social/products/dyb/documents/dyb2017/table07.pdf
- "World Population Prospects – Population Division – United Nations". Archived from the original on 19 September 2016. Retrieved 15 July 2017.
- "Belize Population 2019", World Population Review
External links
- Q'eqchi' and Mopan history - Maya history by Native Planet