Demographics of Seychelles
This article is about the demographic features of the population of Seychelles, including population density, ethnicity, education level, health of the populace, economic status, religious affiliations and other aspects of the population.
About 90% of the Seychellois people live on the island of Mahé. Most of the rest live on Praslin and La Digue, with the remaining smaller islands either sparsely populated or uninhabited.
Most Seychellois are descendants of early French settlers and East Africans who arrived in the 19th century. Tamils, along with other South Indians and Chinese (1.1% of the population) account for the other permanent inhabitants. About 1,703 (2000) expatriates live and work in Seychelles.
Seychelles culture is a mixture of French and African (Creole) influences. The local Seychellois Creole (Kreol), a creole language derived from French and African tongues, is the native language of 91.8% of the people; but English and French are also commonly used. English remains the language of government and commerce.
About 91.9% of the adult population is literate, and the literacy rate of school-aged children has risen to well over 98%. Increases are expected, as nearly all children of primary school age attend school, and the government encourages adult education.
Vital statistics
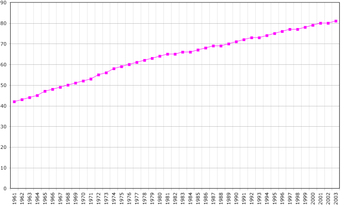
| Population (in thousands)[1][2] | Live births | Deaths | Natural change | Crude birth rate (per 1000) | Crude death rate (per 1000) | Natural change (per 1000) | TFR | |
|---|---|---|---|---|---|---|---|---|
| 1950 | 36 | 1 061 | 418 | 643 | 29.5 | 11.6 | 17.9 | |
| 1951 | 34 | 1 033 | 425 | 608 | 30.4 | 12.5 | 17.9 | |
| 1952 | 36 | 1 037 | 456 | 581 | 28.8 | 12.7 | 16.1 | |
| 1953 | 37 | 1 169 | 438 | 731 | 31.6 | 11.8 | 19.8 | |
| 1954 | 37 | 1 209 | 457 | 752 | 32.7 | 12.4 | 20.3 | |
| 1955 | 39 | 1 303 | 456 | 847 | 33.4 | 11.7 | 21.7 | |
| 1956 | 38 | 1 458 | 468 | 990 | 38.4 | 12.3 | 26.1 | |
| 1957 | 38 | 1 534 | 424 | 1 110 | 40.4 | 11.2 | 29.2 | |
| 1958 | 39 | 1 553 | 450 | 1 103 | 39.8 | 11.5 | 28.3 | |
| 1959 | 40 | 1 595 | 421 | 1 174 | 39.9 | 10.5 | 29.4 | |
| 1960 | 42 | 1 714 | 450 | 1 264 | 40.8 | 10.7 | 30.1 | |
| 1961 | 43 | 1 775 | 574 | 1 201 | 41.3 | 13.3 | 27.9 | |
| 1962 | 44 | 1 733 | 504 | 1 229 | 39.4 | 11.5 | 27.9 | |
| 1963 | 45 | 1 855 | 513 | 1 342 | 41.2 | 11.4 | 29.8 | |
| 1964 | 46 | 1 867 | 485 | 1 382 | 40.6 | 10.5 | 30.0 | |
| 1965 | 47 | 1 772 | 563 | 1 209 | 37.7 | 12.0 | 25.7 | |
| 1966 | 47 | 1 895 | 515 | 1 380 | 40.3 | 11.0 | 29.4 | |
| 1967 | 48 | 1 827 | 536 | 1 291 | 38.1 | 11.2 | 26.9 | |
| 1968 | 49 | 1 738 | 538 | 1 200 | 35.5 | 11.0 | 24.5 | |
| 1969 | 51 | 1 715 | 561 | 1 154 | 33.6 | 11.0 | 22.6 | |
| 1970 | 52 | 1 660 | 437 | 1 223 | 31.9 | 8.4 | 23.5 | |
| 1971 | 53 | 1 837 | 464 | 1 373 | 34.7 | 8.8 | 25.9 | |
| 1972 | 55 | 1 723 | 529 | 1 194 | 31.3 | 9.6 | 21.7 | |
| 1973 | 56 | 1 639 | 475 | 1 164 | 29.3 | 8.5 | 20.8 | |
| 1974 | 57 | 1 860 | 497 | 1 363 | 32.6 | 8.7 | 23.9 | |
| 1975 | 59 | 1 806 | 433 | 1 373 | 30.6 | 7.3 | 23.3 | |
| 1976 | 61 | 1 642 | 466 | 1 176 | 26.9 | 7.6 | 19.3 | |
| 1977 | 62 | 1 599 | 477 | 1 122 | 25.8 | 7.7 | 18.1 | |
| 1978 | 62 | 1 796 | 466 | 1 330 | 29.0 | 7.5 | 21.5 | |
| 1979 | 63 | 1 730 | 438 | 1 292 | 27.5 | 7.0 | 20.5 | |
| 1980 | 63 | 1 830 | 444 | 1 386 | 29.0 | 7.0 | 22.0 | |
| 1981 | 64 | 1 802 | 442 | 1 360 | 28.2 | 6.9 | 21.3 | |
| 1982 | 64 | 1 552 | 482 | 1 070 | 24.3 | 7.5 | 16.7 | |
| 1983 | 64 | 1 662 | 452 | 1 210 | 25.8 | 7.0 | 18.8 | |
| 1984 | 65 | 1 739 | 488 | 1 251 | 26.9 | 7.6 | 19.4 | |
| 1985 | 65 | 1 729 | 468 | 1 261 | 26.5 | 7.2 | 19.3 | |
| 1986 | 66 | 1 722 | 498 | 1 224 | 26.2 | 7.6 | 18.6 | |
| 1987 | 66 | 1 684 | 505 | 1 179 | 25.4 | 7.6 | 17.8 | |
| 1988 | 67 | 1 643 | 504 | 1 139 | 24.7 | 7.6 | 17.1 | |
| 1989 | 69 | 1 600 | 563 | 1 037 | 23.2 | 8.2 | 15.0 | |
| 1990 | 70 | 1 617 | 543 | 1 074 | 23.3 | 7.8 | 15.5 | |
| 1991 | 71 | 1 708 | 545 | 1 163 | 24.2 | 7.7 | 16.5 | |
| 1992 | 71 | 1 603 | 522 | 1 081 | 22.7 | 7.4 | 15.3 | |
| 1993 | 72 | 1 689 | 597 | 1 092 | 23.4 | 8.3 | 15.1 | |
| 1994 | 74 | 1 700 | 550 | 1 150 | 23.0 | 7.5 | 15.6 | |
| 1995 | 75 | 1 582 | 525 | 1 057 | 21.0 | 7.0 | 14.0 | |
| 1996 | 76 | 1 611 | 566 | 1 045 | 21.1 | 7.4 | 13.7 | |
| 1997 | 77 | 1 475 | 603 | 872 | 19.1 | 7.8 | 11.3 | |
| 1998 | 79 | 1 412 | 570 | 842 | 17.9 | 7.2 | 10.7 | |
| 1999 | 80 | 1 460 | 560 | 900 | 18.2 | 7.0 | 11.2 | |
| 2000 | 81 | 1 512 | 553 | 959 | 18.6 | 6.8 | 11.8 | |
| 2001 | 81 | 1 440 | 554 | 886 | 17.7 | 6.8 | 10.9 | |
| 2002 | 84 | 1 481 | 647 | 834 | 17.7 | 7.7 | 10.0 | |
| 2003 | 83 | 1 498 | 668 | 830 | 18.1 | 8.1 | 10.0 | |
| 2004 | 83 | 1 435 | 611 | 824 | 17.3 | 7.4 | 9.9 | |
| 2005 | 84 | 1 536 | 673 | 863 | 18.3 | 8.0 | 10.3 | |
| 2006 | 85 | 1 467 | 664 | 803 | 17.3 | 7.8 | 9.4 | |
| 2007 | 86 | 1 499 | 630 | 869 | 17.4 | 7.3 | 10.1 | |
| 2008 | 87 | 1 546 | 662 | 884 | 17.8 | 7.6 | 10.2 | |
| 2009 | 87 | 1 580 | 684 | 896 | 18.1 | 7.8 | 10.3 | 2.38 |
| 2010 | 87 | 1 504 | 664 | 840 | 16.8 | 7.4 | 9.4 | 2.17 |
| 2011 | 88 | 1 625 | 691 | 934 | 18.6 | 7.9 | 10.7 | 2.38 |
| 2012 | 89 | 1 645 | 651 | 994 | 18.6 | 7.4 | 11.3 | 2.42 |
| 2013 | 92 | 1 566 | 717 | 849 | 17.4 | 8.0 | 9.4 | 2.37 |
| 2014 | 92 | 1 557 | 725 | 832 | 17.0 | 7.9 | 9.1 | 2.34 |
| 2015 | 93 | 1 592 | 703 | 889 | 17.0 | 7.5 | 9.5 | |
| 2016 | 93[3] | |||||||
| 2017 | 1 651 | 748 | 903 | 17.2 | 7.8 | 9.4 | ||
| 2018 | 1 650 | 818 | 832 | 17.1 | 8.5 | 8.6 |
Structure of the population [4]
Structure of the population (2013 estimates):
| Age Group | Male | Female | Total | % |
|---|---|---|---|---|
| Total | 44 735 | 45 214 | 89 949 | 100 |
| 0-4 | 3 777 | 3 631 | 7 408 | 8,24 |
| 5-9 | 3 179 | 3 215 | 6 394 | 7,11 |
| 10-14 | 3 131 | 2 952 | 6 083 | 6,76 |
| 15-19 | 3 411 | 3 187 | 6 598 | 7,34 |
| 20-24 | 3 393 | 2 844 | 6 237 | 6,93 |
| 25-29 | 3 609 | 3 473 | 7 082 | 7,87 |
| 30-34 | 3 751 | 3 681 | 7 432 | 8,26 |
| 35-39 | 3 529 | 3 693 | 7 222 | 8,03 |
| 40-44 | 3 656 | 3 536 | 7 192 | 8,00 |
| 45-49 | 3 371 | 3 628 | 6 999 | 7,78 |
| 50-54 | 3 162 | 3 153 | 6 315 | 7,02 |
| 55-59 | 2 473 | 2 351 | 4 824 | 5,36 |
| 60-64 | 1 459 | 1 604 | 3 063 | 3,41 |
| 65-69 | 1 106 | 1 193 | 2 299 | 2,56 |
| 70-74 | 789 | 999 | 1 788 | 1,99 |
| 75-79 | 468 | 890 | 1 358 | 1,51 |
| 80-84 | 286 | 634 | 920 | 1,02 |
| 85-89 | 141 | 349 | 490 | 0,54 |
| 90-94 | 37 | 152 | 189 | 0,21 |
| 95-99 | 6 | 44 | 50 | 0,06 |
| 100+ | 1 | 5 | 6 | 0,01 |
| Age group | Male | Female | Total | Percent |
|---|---|---|---|---|
| 0-14 | 10 087 | 9 798 | 19 885 | 22,11 |
| 15-64 | 31 814 | 31 150 | 62 964 | 70,00 |
| 65+ | 2 834 | 4 266 | 7 100 | 7,89 |
Other demographic statistics
Demographic statistics according to the World Population Review in 2019.[5]
- One birth every 360 minutes
- One death every 720 minutes
- One net migrant every 1440 minutes
- Net gain of one person every 1440 minutes
The following demographic are from the CIA World Factbook[6] unless otherwise indicated.
Population
- 94,633 (July 2018 est.)
- 81 534 July 2005 est.)
Age structure

- 0-14 years: 19.52% (male 9,482 /female 8,989)
- 15-24 years: 12.96% (male 6,461 /female 5,806)
- 25-54 years: 49.29% (male 24,841 /female 21,800)
- 55-64 years: 10.44% (male 5,008 /female 4,870)
- 65 years and over: 7.79% (male 2,974 /female 4,402) (2018 est.)
- 0–14 years: 26.4% (male 10,839; female 10,601)
- 15–64 years: 67.4% (male 26,709; female 28,025)
- 65 years and over: 6.2% (male 1,622; female 3,392) (2005 est.)
Median age
- total: 35.8 years. Country comparison to the world: 76th
- male: 35.3 years
- female: 36.5 years (2018 est.)
Birth rate
- 13.4 births/1,000 population (2018 est.) Country comparison to the world: 142nd
Death rate
- 7 deaths/1,000 population (2018 est.) Country comparison to the world: 130th
Total fertility rate
- 1.85 children born/woman (2018 est.) Country comparison to the world: 144th
- 1.75 children born/woman (2005 est.)
Population growth rate
- 0.74% (2018 est.) Country comparison to the world: 136th
- 0.789098% (2005 est.)
Demographics profile
Seychelles has no indigenous population and was first permanently settled by a small group of French planters, African slaves, and South Indians in 1770. Seychelles’ modern population is composed of the descendants of French and later British settlers, Africans, and Indian, Chinese, and Middle Eastern traders and is concentrated on three of its 155 islands – the vast majority on Mahe and lesser numbers on Praslin and La Digue. Seychelles’ population grew rapidly during the second half of the 20th century, largely due to natural increase, but the pace has slowed because of fertility decline. The total fertility rate dropped sharply from 4.0 children per woman in 1980 to 1.9 in 2015, mainly as a result of a family planning program, free education and health care, and increased female labor force participation. Life expectancy has increased steadily, but women on average live 9 years longer than men, a difference that is higher than that typical of developed countries.[6]
The combination of reduced fertility and increased longevity has resulted in an aging population, which will put pressure on the government’s provision of pensions and health care. Seychelles’ sustained investment in social welfare services, such as free primary health care and education up to the post-secondary level, have enabled the country to achieve a high human development index score – among the highest in Africa. Despite some of its health and education indicators being nearly on par with Western countries, Seychelles has a high level of income inequality.[6]
Net migration rate
- 1 migrant(s)/1,000 population (2018 est.) Country comparison to the world: 61st
Dependency ratios
- total dependency ratio: 42.8 (2015 est.)
- youth dependency ratio: 31 (2015 est.)
- elderly dependency ratio: 11.7 (2015 est.)
- potential support ratio: 8.5 (2015 est.)
Urbanization
- urban population: 56.7% of total population (2018)
- rate of urbanization: 1.26% annual rate of change (2015-20 est.)
Life expectancy at birth
- total population: 75.2 years
- male: 70.7 years
- female: 79.8 years (2018 est.)
Sex ratio
at birth:
1.03 male(s)/female
under 15 years:
1.02 male(s)/female
15-64 years:
0.95 male(s)/female
65 years and over:
0.48 male(s)/female
total population:
0.93 male(s)/female (2005 est.)
Nationality
noun: Seychellois (singular and plural), adjective: Seychelles
Ethnic groups
predominantly creole (mainly of East African and Malagasy heritage); also French, Indian, Chinese, and Arab populations
Religions
Roman Catholic (76.2%), Protestant (10.5%) (Anglican (6.1%), Pentecoastal Assembly (1.5%), Seventh-Day Adventist (1.2%), other Protestant (1.6)), other Christian (2.4%), Hindu (2.4%), Islam (1.6%), other non-Christian (1.1%), unspecified (4.8%), none (0.9%) (2010 est.) [7]
Languages
Seychellois Creole (official) 89.1%, English (official) 5.1%, French (official) 0.7%, Other 3.8%, Unspecified 1.4% (2010 est.)[7]
Literacy
definition: age 15 and over can read and write
- total population: 91.8%
- male: 91.4%
- female: 92.3% (2012 est.)
- total population: 91.9%
- male: 91.4%
- female: 92.3% (2003 est.)
School life expectancy (primary to tertiary education)
- total: 16 years
- male: 15 years
- female: 16 years (2016)
Unemployment, youth ages 15-24
- total: 14%
- male: 12.1%
- female: 16.2% (2015 est.)
Census
The Seychelles census has now been postponed by one year, from August 2020 to August 2021. Field mapping, questionnaire design, and pretest of data collection tools using tablets, are all proceeding.[8]
References
- United nations. Demographic Yearbooks
- "MISD: Statistics & Database Administration Section". www.misd.gov.sc.
- "The World Factbook — Central Intelligence Agency". www.cia.gov.
- "United Nations Statistics Division - Demographic and Social Statistics". unstats.un.org.
- "Seychelles Population 2019", World Population Review
- "The World FactBook - Seychelles", The World Factbook, July 12, 2018

- "Africa :: MAURITIUS". CIA The World Factbook.
- Technical Brief on the Implications of COVID-19 on Census (PDF). UNFPA. 2020.