Demographics of Russia
The demographics of Russia are the demographic features of the population of the Russian Federation including population growth, population density, ethnic composition, education level, health, economic status and other aspects.
| Demographics of Russia | |
|---|---|
| Population | 144,386,830 (excluding Crimea),[1] 146.8 million (including Crimea)[2] |
| Birth rate | 10.1 births/1,000 population (2019)[4] |
| Death rate | 12.3 deaths/1,000 population (2019)[4] |
| Life expectancy | |
| • male | 67.75 years (2018)[6] |
| • female | 77.82 years (2018)[6] |
| Fertility rate | 1.50 (2019p) [8][9] |
| Infant mortality rate | 4.9 deaths/1,000 live births (2019)[10] |
| Net migration rate | 1.69 migrant(s)/1,000 population (2014) |
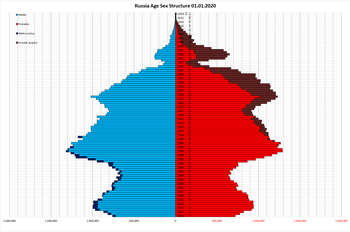
| Age structure | |
| Under 18 years | ~23.21%[11] |
| 18–44 years | ~34.73%[11] |
| 45–64 years | 26.55%[11] |
| 65 and over | 15.6%[11] |
| Sex ratio | |
| Total | 0.86 male(s)/female (2009) |
| At birth | 1.06 male(s)/female |
| Under 15 | 1.06 male(s)/female (male 11,980,138/female 11,344,818) |
| 15–64 years | 0.925 male(s)/female (male 48,166,470/female 52,088,967) |
| 65 and over | 0.44 male(s)/female (male 5,783,983/female 13,105,896) |
| Nationality | |
| Nationality | noun: Russian(s) adjective: Russian |
| Major ethnic | Russians |
| Language | |
| Spoken | Russian, others |
| Historical population | ||
|---|---|---|
| Year | Pop. | ±% p.a. |
| 1897 | 67,473,000 | — |
| 1926 | 93,459,000 | +1.13% |
| 1939 | 108,377,000 | +1.15% |
| 1959 | 117,534,000 | +0.41% |
| 1970 | 130,079,000 | +0.93% |
| 1979 | 137,552,000 | +0.62% |
| 1989 | 147,386,000 | +0.69% |
| 2002 | 145,166,731 | −0.12% |
| 2010 | 142,856,836 | −0.20% |
| 2019 | 146,780,720 | +0.30% |
| 2020 | 146,748,590 | −0.02% |
| Source:[12] 2020 data[3] | ||
With a population of 142.8 million according to the 2010 census,[13] which rose to 146.7 million as of 2020,[3] Russia is the most populous nation in Europe and the ninth-most populous country in the world. Its population density stands at 9 inhabitants per square kilometre (23 per square mile). The overall life expectancy in Russia at birth is 72.4 years (66.9 years for males and 77.6 years for females).[14] Since the 1990s, Russia's death rate has exceeded its birth rate.[15] As of 2018, the total fertility rate (TFR) across Russia was estimated to be 1.58 born per woman,[7] one of the lowest fertility rates in the world,[16] below the replacement rate of 2.1, and considerably below the high of 7.44 children born per woman in 1908.[17] Consequently, the country has one of the oldest populations in the world, with an average age of 40.3 years.[18]
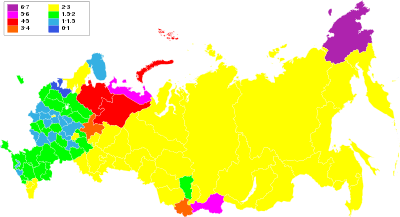
Russia is home to approximately 111 million ethnic Russians and about 20 million ethnic Russians live outside Russia in the former republics of the Soviet Union, mostly in Ukraine and Kazakhstan.[19] The 2010 census recorded 81% of the population as ethnically Russian, and 19% as other ethnicities: 3.7% Tatars; 1.4% Ukrainians; 1.1% Bashkirs; 1% Chuvashes; 11.8% others and unspecified. According to the Census, 84.93% of the Russian population belongs to European ethnic groups (Slavic, Germanic, Finnic, Greek, and others). This is a decline from the 2002, when they constituted for more than 86% of the population. In total, 185 different ethnic groups live within the Russian Federation's borders.
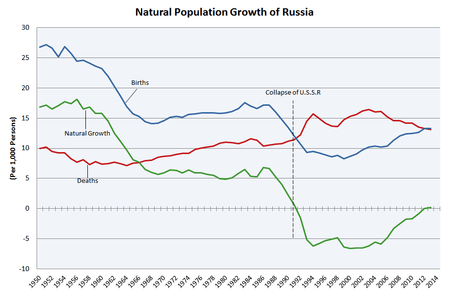
Main trends
The population of Russia peaked at 148,689,000 in 1991, just before the breakup of the Soviet Union. Low birth rates and abnormally high death rates caused Russia's population to decline at a 0.5% annual rate, or about 750,000 to 800,000 people per year from the mid-1990s to the mid-2000s. The UN warned in 2005 that Russia's then population of about 143 million could fall by a third by 2050, if trends did not improve.[23][24] In 2018, the UN claimed that Russia's population could fall to 132 million by 2050.[25][26]
The decline slowed considerably in the late 2000s, and in 2009 Russia recorded population growth for the first time in 15 years, adding 23,300.[20][27] Key reasons for the slow current population growth are improving health care, changing fertility patterns among younger women, falling emigration and a steady influx of immigrants from ex-USSR countries. In 2012, Russia's population increased by 292,400.[28]
As of 2018, Russia's TFR of 1.579 children born/woman[7] was among the highest in Eastern, Southern and Central Europe. In 2013, Russia experienced the first natural population growth since 1990 at 22,700. However since 2016 TFR has been plummeting, which has already led to a return of a growing natural decrease. In 2018 it surpassed the net migration increment leading to a slight decline of total population. Even though life expectancy in Russia is steadily growing at a high pace (~0.5 year annually) reaching all-time record highs every year[6], it is still not enough for recovery due to the distorted wave-like age structure of the population.
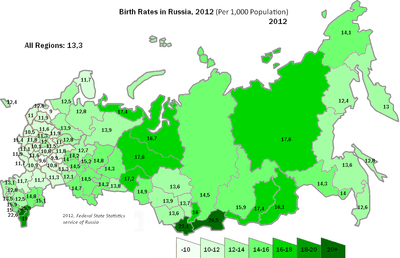
The number of Russians living in poverty has decreased by 50% since the economic crisis following the disintegration of the Soviet Union, and the improving economy had a positive impact on the country's low birth rate. The latter rose from its lowest point of 8.27 births per 1000 people in 1999 to 13.3 per 1000 in 2014. Likewise, the fertility rate rose from its lowest point of 1.157 in 1999 to 1.777 in 2015. 2007 marked the highest growth in birth rates that the country had seen in 25 years, and 2009 marked the highest total birth rate since 1991.[29]
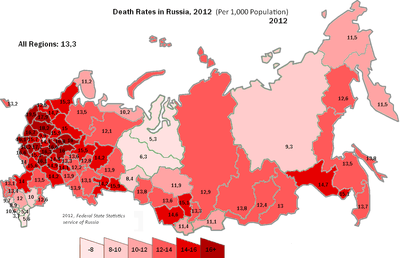
While the Russian birth rate is comparable to that of developed countries, its death rate is much higher, especially among working-age males due to a comparatively high rate of fatalities caused by heart disease and other external causes such as accidents. The Russian death rate in 2010 was 14.3 per 1000 citizens.
Demographic crisis and recovery prospects

The causes for this sharp increase in mortality are widely debated. According to a 2009 report by The Lancet,[31] a British medical journal, mass privatization, an element of the economic-reform package nicknamed shock therapy, clearly correlates with higher mortality rates. The report argues that advocates of economic reforms ignored the human cost of the policies they were promoting, such as unemployment and human suffering, leading to an early death. These conclusions were criticized by The Economist.[32] A WHO press-release in 2000, on the other hand, reported widespread alcohol abuse in Russia being used as the most common explanation of higher mortality among men.[33] A 2008 study produced very similar results.[34]
A 2009 study blamed alcohol for more than half the deaths (52%) among Russians aged 15 to 54 in the '90s. For the same demographic, this compares to 4% of deaths for the rest of the world. The study claimed alcohol consumption in mid-90s in Russia averaged 10.5 litres, and was based on personal interviews conducted in three Siberian industrial cities, Barnaul, Biysk and Omsk.[35] More recent studies have confirmed these findings.[36]
According to the Russian demographic publication Demoscope,[37] the rising male death rate was a long-term trend from 1960 to 2005. The only significant reversion of the trend was caused by Mikhail Gorbachev's anti-alcohol campaign, but its effect was only temporary. According to the publication, the sharp rise of death rates in the early 1990s was caused by the exhaustion of the effect of the anti-alcohol campaign, while the market reforms were only of secondary importance. The authors also claimed the Lancet's study is flawed because it used the 1985 death rate as the base, while that was in fact the very maximum of the effect of the anti-alcohol campaign.[37]
Other factors contributing to the collapse, along with the economic problems, include the dying off of a relatively large cohort of people born between 1925 and 1940 (between the Russian Civil War and World War II), when Russian birth rates were very high, along with an "echo boom" in the 1980s that may have satisfied the demand for children, leading to a subsequent drop in birth rates.
Government measures to halt the demographic crisis was a key subject of Vladimir Putin's 2006 state of the nation address.[38] As a result, a national programme was developed with the goal to reverse the trend by 2020. Soon after, a study published in 2007 showed that the rate of population decrease had begun to slow: if the net decrease from January to August 2006 was 408,200 people, it was 196,600 in the same period in 2007. The death rate accounted for 357,000 of these, which is 137,000 less than in 2006.[39]
At the same time period in 2007, there were just over one million births in Russia (981,600 in 2006), whilst deaths decreased from 1,475,000 to 1,402,300. In all, the number of deaths exceeded the number of births by 1.3 times, down from 1.5 in 2006. 18 of the 83 provinces showed a natural growth of population (in 2006: 16). The Russian Ministry of Economic Development expressed hope that by 2020 the population would stabilize at 138–139 million, and by 2025, to increase again to its present-day status of 143–145, also raising the life expectancy to 75 years.[39]
The natural population decline continued to slow through 2008—2012 due to declining death rates and increasing birth rates. In 2009 the population saw yearly growth for the first time in 15 years.[20][27] In September 2009, the Ministry of Health and Social Development reported that Russia recorded natural population growth for the first time in 15 years, with 1,000 more births than deaths in August.[40] In April 2011 the Russian Prime Minister (Russian president as of 2012) Vladimir Putin pledged to spend the 1.5 trillion rubles (£32.5 billion or $54 billion) on various measures to boost Russia's declining birthrate by 30 per cent in the next four years.[41]
In 2012, the birth rate increased again. Russia recorded 1,896,263 births, the highest number since 1990, and even exceeding annual births during the period 1967–1969, with a TFR of 1.691, the highest since 1991. (Source: Vital statistics table below). In fact, Russia, despite having only slightly more people than Japan, has recently had nearly twice as many births as that country. The number of births was expected to fall over the next few years as women born during the baby bust in the 1990s enter their prime childbearing years, but this didn't occur thanks to the continued growth of the TFR. The figures for 2013–2015 again showed around 1.9 million births, about the same as in 2012, but because the number of women of childbearing age is dropping, especially for those in their early 20s, the TFR actually rose to 1.777, which places Russia at first 9 or 10 countries out of 50 developed nations, and at 6th place in Europe.
In 2017, the number of births took a drop mostly due to falling fertility rates, which, in turn, were affected by falling of fertility of 2nd children due to planned but postponed termination of maternal capital program, and falling of fertility of 1st children. The more recent drop in fertility has been sharpest in the North Caucasus, including in Chechnya where the birth rate fell by one-third since 2010. Change of number of reproductive-age women also played a key role. However, the number of deaths also declined due to improving healthcare, decline in violent crime rates and declining consumption of alcohol, tobacco and hard drugs.
In 2018, the number of births kept falling, but at much slower pace. However, the number of deaths didn't decline by as much as it did the previous year because whilst life expectancy improved, the population aged leading to a higher mortality rate. By 2020 around 25.7% of Russians would be over 60 years, which is nearly double the percentage in 1985 of 12.7%. By the middle of the century it is possible that more than a third of the population will be over 60, similar to modern Japan.
Immigration
In 2006, in a bid to compensate for the country's demographic decline, the Russian government started simplifying immigration laws and launched a state program "for providing assistance to voluntary immigration of ethnic Russians from former Soviet republics".[42] In August 2012, as the country saw its first demographic growth since the 1990s, President Putin declared that Russia's population could reach 146 million by 2025, mainly as a result of immigration.[43] Introduced in April 2014 new citizenship rules[44] allowing citizens of former Soviet countries to obtain Russian citizenship If they meet certain criteria (e.g. preferred language, ethnicity) have gained strong interest among Russian-speaking residents of those countries (i.e. Russians, Germans, Belarusians and Ukrainians).[45]
There are an estimated four million illegal immigrants from the ex-Soviet states in Russia.[46] In 2012, the Russian Federal Security Service's Border Service stated there had been an increase in illegal migration from the Middle East and Southeast Asia (Note that these were Temporary Contract Migrants)[47] Under legal changes made in 2012, illegal immigrants who are caught will be banned from reentering the country for 10 years.[48][49][50]
Since the collapse of the USSR, most immigrants have come from Ukraine, Uzbekistan, Tajikistan, Azerbaijan, Moldova, Kazakhstan, Kyrgyzstan, Armenia, Belarus, and China.[51]
Worker migration
Temporary migrant workers in Russia consists of about 7 million people, most of the temporary workers come from Central Asia the Balkans and East Asia. Most of them work in the construction, cleaning and in the household industries. They primarily live in cities such as Moscow, Sochi and Blagoveshchensk. While worker migrants are opposed by most Russians, the mayor of Moscow said that Moscow cannot do without worker migrants. New laws are in place that require worker migrants to be fluent in Russian, know Russian history and laws. The Russian Opposition and most of the Russian population opposes worker migration. Alexei Navalny stated that if he came to power he would introduce a visa regime to non-Eurasian Union countries in the former Soviet Union and have a visa free regime with the European Union and The West to attract skilled migrants.[52] The problem of worker migration has become so severe it has caused a rise in Russian nationalism, and spawned groups like Movement Against Illegal Immigration.[53][54]
| Immigration | Emigration | Net external migration | |
|---|---|---|---|
| 2013 | 482 241 | 186 382 | 295 859 |
| 2014 | 590 824 | 310 496 | 280 328 |
| 2015 | 598 617 | 353 233 | 245 384 |
| 2016 | 575 158 | 313 210 | 261 948 |
| 2017 | 589 033 | 377 155 | 211 878 |
| 2018 | 565 685 | 440 831 | 124 854 |
Vital statistics
Total fertility rate, 1840–1926
The total fertility rate is the number of children born per woman. It is based on fairly good data for the entire period. Sources: Our World In Data and Gapminder Foundation.[55]
In many of the following years, Russia has had the highest total fertility rate in the world.[55] These very high fertility rates did not increase even more the population due to the casualties of the Russian Revolution, the two world wars and political killings.
| Years | 1840 | 1841 | 1842 | 1843 | 1844 | 1845 | 1846 | 1847 | 1848 | 1849[55] |
|---|---|---|---|---|---|---|---|---|---|---|
| 7 | 7 | 7 | 7.01 | 7.02 | 7.03 | 7.05 | 7.06 | 7.08 | 7.08 | |
| Years | 1850 | 1851 | 1852 | 1853 | 1854 | 1855 | 1856 | 1857 | 1858 | 1859[55] |
| 7.07 | 7.07 | 7.07 | 7.06 | 7.05 | 7.03 | 7.01 | 7 | 6.98 | 6.97 | |
| Years | 1860 | 1861 | 1862 | 1863 | 1864 | 1865 | 1866 | 1867 | 1868 | 1869[55] |
| 6.95 | 6.93 | 6.95 | 6.96 | 6.98 | 6.99 | 7.01 | 7.02 | 6.51 | 6.87 | |
| Years | 1870 | 1871 | 1872 | 1873 | 1874 | 1875 | 1876 | 1877 | 1878 | 1879[55] |
| 6.74 | 7.03 | 6.85 | 7.24 | 7.17 | 7.15 | 7.02 | 6.87 | 6.58 | 6.98 | |
| Years | 1880 | 1881 | 1882 | 1883 | 1884 | 1885 | 1886 | 1887 | 1888 | 1889[55] |
| 6.8 | 6.66 | 7.03 | 6.89 | 6.83 | 6.74 | 6.47 | 6.61 | 6.96 | 6.8 | |
| Years | 1890 | 1891 | 1892 | 1893 | 1894 | 1895 | 1896 | 1897 | 1898 | 1899[55] |
| 6.71 | 7.44 | 6.57 | 7.17 | 7.18 | 7.34 | 7.43 | 7.52 | 7.28 | 7.36 | |
| Years | 1900 | 1901 | 1902 | 1903 | 1904 | 1905 | 1906 | 1907 | 1908 | 1909[55] |
| 7.36 | 7.2 | 7.36 | 7.2 | 7.24 | 6.72 | 7.04 | 7.08 | 7.44 | 7.12 | |
| Years | 1910 | 1911 | 1912 | 1913 | 1914 | 1915 | 1916 | 1917 | 1918 | 1919[55] |
| 7.2 | 7.2 | 7.2 | 6.96 | 6.88 | 3.36 | 5.2 | 5.04 | 5.72 | 3.44 | |
| Years | 1920 | 1921 | 1922 | 1923 | 1924 | 1925 | 1926[55] | |||
| 6.72 | 4.72 | 6 | 6.48 | 6.72 | 6.8 | 6.72 |
Historical crude birth rates
| Years | 1801–1810 | 1811–1820 | 1821–1830 | 1831–1840 | 1841–1850 | 1851–1860[56] |
|---|---|---|---|---|---|---|
| Crude birth rates of Russia | 43.7 | 40.0 | 42.7 | 45.6 | 49.7 | 52.4 |
| Years | 1861–1870 | 1871–1880 | 1881–1890 | 1891–1900 | 1901–1910 | 1911–1914 | 18th century (only Orthodoxs) |
1801–1860 (only Orthodoxs)[56] |
|---|---|---|---|---|---|---|---|---|
| Crude birth rates of Russia | 50.3 | 50.4 | 50.4 | 49.2 | 46.8 | 43.9 | 51.0 | 50.0 |
_on_01_January%2C_1927.png)
| Average population[57] | Live births | Deaths | Natural change | Crude birth rate (per 1,000) | Crude death rate (per 1,000) | Natural change (per 1,000) | Total fertility rates | Life Expectancy (male) | Life Expectancy (female) | |
|---|---|---|---|---|---|---|---|---|---|---|
| 1927 | 94,596,000 | 4,688,000 | 2,705,000 | 1,983,000 | 49.6 | 28.6 | 21.0 | 6.73 | 33.7 | 37.9 |
| 1928 | 96,654,000 | 4,723,000 | 2,589,000 | 2,134,000 | 48.9 | 26.8 | 22.1 | 6.56 | 35.9 | 40.4 |
| 1929 | 98,644,000 | 4,633,000 | 2,819,000 | 1,814,000 | 47.0 | 28.6 | 18.4 | 6.23 | 33.7 | 38.2 |
| 1930 | 100,419,000 | 4,413,000 | 2,738,000 | 1,675,000 | 43.9 | 27.3 | 16.7 | 5.83 | 34.6 | 38.7 |
| 1931 | 101,948,000 | 4,412,000 | 3,090,000 | 1,322,000 | 43.3 | 30.3 | 13.0 | 5.63 | 30.7 | 35.5 |
| 1932 | 103,136,000 | 4,058,000 | 3,077,000 | 981,000 | 39.3 | 29.8 | 9.5 | 5.09 | 30.5 | 35.7 |
| 1933 | 102,706,000 | 3,313,000 | 5,239,000 | –1,926,000 | 32.3 | 51.0 | –18.8 | 4.15 | 15.2 | 19.5 |
| 1934 | 102,922,000 | 2,923,000 | 2,659,000 | 264,000 | 28.7 | 26.1 | 2.6 | 3.57 | 30.5 | 35.7 |
| 1935 | 102,684,000 | 3,577,000 | 2,421,000 | 1,156,000 | 34.8 | 23.6 | 11.3 | 4.31 | 33.1 | 38.4 |
| 1936 | 103,904,000 | 3,899,000 | 2,719,000 | 1,180,000 | 37.5 | 26.2 | 11.4 | 4.54 | 30.4 | 35.7 |
| 1937 | 105,358,000 | 4,377,000 | 2,760,000 | 1,617,000 | 41.5 | 26.2 | 15.4 | 5.08 | 30.5 | 40.0 |
| 1938 | 107,044,000 | 4,379,000 | 2,739,000 | 1,640,000 | 40.9 | 25.6 | 15.3 | 4.99 | 31.7 | 42.5 |
| 1939 | 108,785,000 | 4,329,000 | 2,600,000 | 1,729,000 | 39.8 | 23.9 | 15.9 | 4.91 | 34.9 | 42.6 |
| 1940 | 110,333,000 | 3,814,000 | 2,561,000 | 1,253,000 | 34.6 | 23.2 | 11.4 | 4.26 | 35.7 | 41.9 |
| Years | 1941 | 1942 | 1943 | 1944 | 1945[55] |
|---|---|---|---|---|---|
| 4.60 | 2.96 | 1.68 | 1.72 | 1.92 |
After WWII
| Total average midyear population | Live births | Deaths | Natural change | Crude birth rate (per 1,000) | Crude death rate (per 1,000) | Natural change (per 1,000) | Total fertility rates[fn 1] | Urban fertility | Rural fertility | Life Expectancy (male) | Life Expectancy (female) | Life Expectancy (total) | Abortions reported | |
|---|---|---|---|---|---|---|---|---|---|---|---|---|---|---|
| 1946 | 98,028,000 | 2,546,000 | 1,210,000 | 1,336,000 | 26.0 | 12.3 | 13.6 | 2.81 | 46.6 | 55.3 | ||||
| 1947 | 98,834,000 | 2,715,000 | 1,680,000 | 1,035,000 | 27.5 | 17.0 | 10.5 | 2.94 | 39.9 | 49.8 | ||||
| 1948 | 99,706,000 | 2,516,000 | 1,310,000 | 1,206,000 | 25.2 | 13.1 | 12.1 | 2.60 | 47.0 | 56.0 | ||||
| 1949 | 101,160,000 | 3,089,000 | 1,187,000 | 1,902,000 | 30.5 | 11.7 | 18.8 | 3.21 | 51.0 | 59.8 | ||||
| 1950 | 102,833,000 | 2,859,000 | 1,180,000 | 1,679,000 | 27.8 | 11.5 | 16.3 | 2.89 | 52.3 | 61.0 | ||||
| 1951 | 104,439,000 | 2,938,000 | 1,210,000 | 1,728,000 | 28.1 | 11.6 | 16.5 | 2.92 | 52.3 | 60.6 | ||||
| 1952 | 106,164,000 | 2,928,000 | 1,138,000 | 1,790,000 | 27.6 | 10.7 | 16.9 | 2.87 | 54.6 | 62.9 | ||||
| 1953 | 107,828,000 | 2,822,000 | 1,118,000 | 1,704,000 | 26.2 | 10.4 | 15.8 | 2.73 | 55.5 | 63.9 | ||||
| 1954 | 109,643,000 | 3,048,000 | 1,133,000 | 1,915,000 | 27.8 | 10.3 | 17.5 | 2.97 | 55.9 | 64.1 | ||||
| 1955 | 111,572,000 | 2,942,000 | 1,037,000 | 1,905,000 | 26.4 | 9.3 | 17.1 | 2.82 | 58.3 | 66.6 | ||||
| 1956 | 113,327,000 | 2,827,000 | 956,000 | 1,871,000 | 24.9 | 8.4 | 16.5 | 2.73 | 60.1 | 68.8 | ||||
| 1957 | 115,035,000 | 2,880,000 | 1,017,000 | 1,863,000 | 25.0 | 8.8 | 16.2 | 2.75 | 59.7 | 68.4 | 3,407,398 | |||
| 1958 | 116,749,000 | 2,861,000 | 931,000 | 1,930,000 | 24.5 | 8.0 | 16.5 | 2.69 | 61.8 | 70.4 | 3,939,362 | |||
| 1959 | 118,307,000 | 2,796,228 | 920,225 | 1,876,003 | 23.6 | 7.8 | 15.9 | 2.58 | 2.03 | 3.34 | 62.84 | 71.14 | 67.65 | 4,174,111 |
| 1960 | 119,906,000 | 2,782,353 | 886,090 | 1,896,263 | 23.2 | 7.4 | 15.8 | 2.56 | 2.06 | 3.26 | 63.67 | 72.31 | 68.67 | 4,373,042 |
| 1961 | 121,586,000 | 2,662,135 | 901,637 | 1,760,498 | 21.9 | 7.4 | 14.5 | 2.47 | 2.04 | 3.08 | 63.91 | 72.63 | 68.92 | 4,759,040 |
| 1962 | 123,128,000 | 2,482,539 | 949,648 | 1,532,891 | 20.2 | 7.7 | 12.4 | 2.36 | 1.98 | 2.92 | 63.67 | 72.27 | 68.58 | 4,925,124 |
| 1963 | 124,514,000 | 2,331,505 | 932,055 | 1,399,450 | 18.7 | 7.5 | 11.2 | 2.31 | 1.93 | 2.87 | 64.12 | 72.78 | 69.05 | 5,134,100 |
| 1964 | 125,744,000 | 2,121,994 | 901,751 | 1,220,243 | 16.9 | 7.2 | 9.7 | 2.19 | 1.88 | 2.66 | 64.89 | 73.58 | 69.85 | 5,376,200 |
| 1965 | 126,749,000 | 1,990,520 | 958,789 | 1,031,731 | 15.7 | 7.6 | 8.1 | 2.14 | 1.82 | 2.58 | 64.37 | 73.33 | 69.44 | 5,463,300 |
| 1966 | 127,608,000 | 1,957,763 | 974,299 | 983,464 | 15.3 | 7.6 | 7.7 | 2.13 | 1.85 | 2.58 | 64.29 | 73.55 | 69.51 | 5,322,500 |
| 1967 | 128,361,000 | 1,851,041 | 1,017,034 | 834,007 | 14.4 | 7.9 | 6.5 | 2.03 | 1.79 | 2.46 | 64.02 | 73.43 | 69.30 | 5,005,000 |
| 1968 | 129,037,000 | 1,816,509 | 1,040,096 | 776,413 | 14.1 | 8.1 | 6.0 | 1.98 | 1.75 | 2.44 | 63.73 | 73.56 | 69.26 | 4,872,900 |
| 1969 | 129,660,000 | 1,847,592 | 1,106,640 | 740,952 | 14.2 | 8.5 | 5.7 | 1.99 | 1.78 | 2.44 | 63.07 | 73.29 | 68.74 | 4,751,100 |
| 1970 | 130,252,000 | 1,903,713 | 1,131,183 | 772,530 | 14.6 | 8.7 | 5.9 | 2.00 | 1.77 | 2.52 | 63.07 | 73.44 | 68.86 | 4,837,700 |
| 1971 | 130,934,000 | 1,974,637 | 1,143,359 | 831,278 | 15.1 | 8.7 | 6.3 | 2.02 | 1.80 | 2.60 | 63.24 | 73.77 | 69.12 | 4,838,749 |
| 1972 | 131,687,000 | 2,014,638 | 1,181,802 | 832,836 | 15.3 | 9.0 | 6.3 | 2.03 | 1.81 | 2.59 | 63.24 | 73.62 | 69.02 | 4,765,900 |
| 1973 | 132,434,000 | 1,994,621 | 1,214,204 | 780,417 | 15.1 | 9.2 | 5.9 | 1.96 | 1.75 | 2.55 | 63.28 | 73.56 | 69.00 | 4,747,037 |
| 1974 | 133,217,000 | 2,079,812 | 1,222,495 | 857,317 | 15.6 | 9.2 | 6.4 | 2.00 | 1.78 | 2.63 | 63.12 | 73.77 | 68.99 | 4,674,050 |
| 1975 | 134,092,000 | 2,106,147 | 1,309,710 | 796,437 | 15.7 | 9.8 | 5.9 | 1.97 | 1.76 | 2.64 | 62.48 | 73.23 | 68.35 | 4,670,700 |
| 1976 | 135,026,000 | 2,146,711 | 1,352,950 | 793,761 | 15.9 | 10.0 | 5.9 | 1.96 | 1.74 | 2.62 | 62.19 | 73.04 | 68.10 | 4,757,055 |
| 1977 | 135,979,000 | 2,156,724 | 1,387,986 | 768,738 | 15.9 | 10.2 | 5.7 | 1.92 | 1.72 | 2.58 | 61.82 | 73.19 | 67.97 | 4,686,063 |
| 1978 | 136,922,000 | 2,179,030 | 1,417,377 | 761,653 | 15.9 | 10.4 | 5.6 | 1.90 | 1.70 | 2.55 | 61.83 | 73.23 | 68.01 | 4,656,057 |
| 1979 | 137,758,000 | 2,178,542 | 1,490,057 | 688,485 | 15.8 | 10.8 | 5.0 | 1.87 | 1.67 | 2.54 | 61.49 | 73.02 | 67.73 | 4,544,040 |
| 1980 | 138,483,000 | 2,202,779 | 1,525,755 | 677,024 | 15.9 | 11.0 | 4.9 | 1.87 | 1.68 | 2.51 | 61.38 | 72.96 | 67.70 | 4,506,249 |
| 1981 | 139,221,000 | 2,236,608 | 1,524,286 | 712,322 | 16.1 | 10.9 | 5.1 | 1.88 | 1.69 | 2.55 | 61.61 | 73.18 | 67.92 | 4,400,676 |
| 1982 | 140,067,000 | 2,328,044 | 1,504,200 | 823,844 | 16.6 | 10.7 | 5.9 | 1.96 | 1.76 | 2.63 | 62.24 | 73.64 | 68.38 | 4,462,825 |
| 1983 | 141,056,000 | 2,478,322 | 1,563,995 | 914,327 | 17.6 | 11.1 | 6.5 | 2.11 | 1.89 | 2.76 | 62.15 | 73.41 | 68.15 | 4,317,729 |
| 1984 | 142,061,000 | 2,409,614 | 1,650,866 | 758,748 | 17.0 | 11.6 | 5.3 | 2.06 | 1.86 | 2.69 | 61.71 | 72.96 | 67.67 | 4,361,959 |
| 1985 | 143,033,000 | 2,375,147 | 1,625,266 | 749,881 | 16.6 | 11.4 | 5.2 | 2.05 | 1.87 | 2.68 | 62.72 | 73.23 | 68.33 | 4,552,443 |
| 1986 | 144,156,000 | 2,485,915 | 1,497,975 | 987,940 | 17.2 | 10.4 | 6.9 | 2.18 | 1.98 | 2.83 | 64.77 | 74.22 | 69.95 | 4,579,400 |
| 1987 | 145,386,000 | 2,499,974 | 1,531,585 | 968,389 | 17.2 | 10.5 | 6.7 | 2.22 | 1.974 | 3.187 | 64.83 | 74.26 | 69.96 | 4,385,627 |
| 1988 | 146,505,000 | 2,348,494 | 1,569,112 | 779,382 | 16.0 | 10.7 | 5.3 | 2.13 | 1.90 | 3.06 | 64.61 | 74.25 | 69.81 | 4,608,953 |
| 1989 | 147,342,000 | 2,160,559 | 1,583,743 | 576,816 | 14.7 | 10.7 | 3.9 | 2.01 | 1.83 | 2.63 | 64.20 | 74.50 | 69.73 | 4,427,713 |
| 1990 | 147,969,000 | 1,988,858 | 1,655,993 | 332,865 | 13.4 | 11.2 | 2.3 | 1.892 | 1.698 | 2.600 | 63.76 | 74.32 | 69.36 | 4,103,425 |
| 1991 | 148,394,000 | 1,794,626 | 1,690,657 | 103,969 | 12.1 | 11.4 | 0.7 | 1.732 | 1.531 | 2.447 | 63.41 | 74.23 | 69.11 | 3,608,421 |
| 1992 | 148,538,000 | 1,587,644 | 1,807,441 | –219,797 | 10.7 | 12.2 | –1.5 | 1.547 | 1.351 | 2.219 | 61.96 | 73.71 | 67.98 | 3,436,695 |
| 1993 | 148,459,000 | 1,378,983 | 2,129,339 | –750,356 | 9.3 | 14.3 | –5.1 | 1.369 | 1.200 | 1.946 | 58.80 | 71.85 | 65.24 | 3,243,957 |
| 1994 | 148,408,000 | 1,408,159 | 2,301,366 | –893,207 | 9.5 | 15.5 | –6.0 | 1.394 | 1.238 | 1.917 | 57.38 | 71.07 | 63.93 | 3,060,237 |
| 1995 | 148,376,000 | 1,363,806 | 2,203,811 | –840,005 | 9.2 | 14.9 | –5.7 | 1.337 | 1.193 | 1.813 | 58.11 | 71.60 | 64.62 | 2,766,362 |
| 1996 | 148,160,000 | 1,304,638 | 2,082,249 | –777,611 | 8.8 | 14.1 | –5.2 | 1.270 | 1.140 | 1.705 | 59.61 | 72.41 | 65.89 | 2,652,038 |
| 1997 | 147,915,000 | 1,259,943 | 2,015,779 | –755,836 | 8.5 | 13.6 | –5.1 | 1.218 | 1.097 | 1.624 | 60.84 | 72.85 | 66.79 | 2,498,716 |
| 1998 | 147,671,000 | 1,283,292 | 1,988,744 | –705,452 | 8.7 | 13.5 | –4.8 | 1.232 | 1.109 | 1.643 | 61.19 | 73.12 | 67.14 | 2,346,138 |
| 1999 | 147,215,000 | 1,214,689 | 2,144,316 | –929,627 | 8.3 | 14.6 | –6.3 | 1.157 | 1.045 | 1.534 | 59.86 | 72.42 | 65.99 | 2,181,153 |
| 2000 | 146,597,000 | 1,266,800 | 2,225,332 | –958,532 | 8.6 | 15.2 | –6.5 | 1.195 | 1.089 | 1.554 | 58.99 | 72.25 | 65.38 | 2,138,800 |
| 2001 | 145,976,000 | 1,311,604 | 2,254,856 | –943,252 | 9.0 | 15.4 | –6.5 | 1.223 | 1.124 | 1.564 | 58.88 | 72.16 | 65.30 | 2,114,700 |
| 2002 | 145,306,496 | 1,396,967 | 2,332,272 | –935,305 | 9.6 | 16.1 | –6.4 | 1.286 | 1.189 | 1.633 | 58.68 | 71.90 | 64.95 | 1,944,481 |
| 2003 | 144,648,624 | 1,477,301 | 2,365,826 | –888,525 | 10.2 | 16.4 | –6.1 | 1.319 | 1.223 | 1.666 | 58.53 | 71.85 | 64.84 | 1,864,647 |
| 2004 | 144,067,312 | 1,502,477 | 2,295,402 | –792,925 | 10.4 | 15.9 | –5.5 | 1.344 | 1.253 | 1.654 | 58.91 | 72.36 | 65.31 | 1,797,567 |
| 2005 | 143,518,816 | 1,457,376 | 2,303,935 | –846,559 | 10.2 | 16.1 | –5.9 | 1.294 | 1.207 | 1.576 | 58.92 | 72.47 | 65.37 | 1,675,693 |
| 2006 | 143,049,632 | 1,479,637 | 2,166,703 | –687,066 | 10.3 | 15.1 | –4.8 | 1.305 | 1.210 | 1.601 | 60.43 | 73.34 | 66.69 | 1,582,398 |
| 2007 | 142,805,120 | 1,610,122 | 2,080,445 | –470,323 | 11.3 | 14.6 | –3.3 | 1.416 | 1.294 | 1.798 | 61.46 | 74.02 | 67.61 | 1,479,010 |
| 2008 | 142,742,368 | 1,713,947 | 2,075,954 | –362,007 | 12.0 | 14.5 | –2.6 | 1.502 | 1.372 | 1.912 | 61.92 | 74.28 | 67.99 | 1,385,600 |
| 2009 | 142,785,344 | 1,761,687 | 2,010,543 | –248,856 | 12.3 | 14.1 | –1.8 | 1.542 | 1.415 | 1.941 | 62.87 | 74.79 | 68.78 | 1,292,389 |
| 2010 | 142,849,472 | 1,788,948 | 2,028,516 | –239,568 | 12.5 | 14.2 | –1.7 | 1.567 | 1.439 | 1.983 | 63.09 | 74.88 | 68.94 | 1,186,108 |
| 2011 | 142,960,908 | 1,796,629 | 1,925,720 | –129,091 | 12.6 | 13.5 | –0.9 | 1.582 | 1.442 | 2.056 | 64.04 | 75.61 | 69.83 | 1,124,880 |
| 2012 | 143,201,700 | 1,902,084 | 1,906,335 | –4,251 | 13.3 | 13.3 | –0.0 | 1.691 | 1.541 | 2.215 | 64.56 | 75.86 | 70.24 | 1,063,982 |
| 2013 | 143,506,995 | 1,895,822 | 1,871,809 | 24,013 | 13.3 | 13.0 | 0.2 | 1.707 | 1.551 | 2.264 | 65.14 | 76.31 | 70.77 | 1,012,399 |
| 2014 | 146,090,613 | 1,942,683 | 1,912,347 | 30,346 | 13.3 | 13.1 | 0.2 | 1.750 | 1.588 | 2.318 | 65.29 | 76.49 | 70.93 | 929,963 |
| 2015 | 146,405,999 | 1,940,579 | 1,908,541 | 32,038 | 13.3 | 13.1 | 0.2 | 1.777 | 1.678 | 2.111 | 65.92 | 76.71 | 71.39 | 848,180 |
| 2016 | 146,674,541 | 1,888,729 | 1,891,015 | –2,286 | 12.9 | 12.9 | –0.0 | 1.762 | 1.672 | 2.056 | 66.50 | 77.06 | 71.87 | 836,611 |
| 2017 | 146,842,402 | 1,690,307 | 1,826,125 | –135,818 | 11.5 | 12.4 | –0.9 | 1.621 | 1.527 | 1.923 | 67.51 | 77.64 | 72.70 | 779,848 |
| 2018 | 146,830,576 | 1,604,344 | 1,828,910 | –224,566 | 10.9 | 12.5 | –1.6 | 1.579 | 1.489 | 1.870 | 67.75 | 77.81 | 72.91 | |
| 2019[63][64] | 146,748,590 | 1,481,074 | 1,798,307 | –317,233 | 10.1 | 12.3 | –2.2 | 1.50 | 73.34 | |||||
| Urban live births | Urban deaths | Urban natural change | Urban crude birth rate (per 1,000) | Urban crude death rate (per 1,000) | Urban natural change (per 1,000) | Rural live births | Rural deaths | Rural natural change | Rural crude birth rate (per 1,000) | Rural crude death rate (per 1,000) | Rural natural change (per 1,000) | |
|---|---|---|---|---|---|---|---|---|---|---|---|---|
| 1950 | 1,171,250 | 436,792 | 734,458 | 26.1 | 9.7 | 16.4 | 1,574,747 | 594,218 | 980,529 | 27.5 | 10.4 | 17.1 |
| 1960 | 1,332,812 | 436,709 | 896,103 | 20.4 | 6.7 | 13.7 | 1,449,541 | 449,831 | 1,000,160 | 26.5 | 8.2 | 18.3 |
| 1970 | 1,205,207 | 646,129 | 559,078 | 14.8 | 7.9 | 6.9 | 698,506 | 485,054 | 213,452 | 14.3 | 10.0 | 4.3 |
| 1980 | 1,535,723 | 970,256 | 565,467 | 15.8 | 10.0 | 5.8 | 667,056 | 555,499 | 111,557 | 16.1 | 13.4 | 2.7 |
| 1990 | 1,386,247 | 1,140,613 | 245,634 | 12.7 | 10.5 | 2.2 | 602,611 | 515,380 | 87,231 | 15.5 | 13.2 | 2.3 |
| 1995 | 933,460 | 1,554,182 | –620,722 | 8.7 | 14.4 | –5.7 | 430,346 | 649,269 | –219,283 | 10.9 | 16.5 | –5.6 |
| 2000 | 886,908 | 1,564,034 | –677,126 | 8.3 | 14.6 | –6.3 | 379,892 | 661,298 | –281,406 | 9.8 | 17.1 | –7.3 |
| 2001 | 928,642 | 1,592,254 | –663,612 | 8.7 | 14.9 | –6.2 | 382,962 | 662,602 | –279,640 | 10.0 | 17.3 | –7.3 |
| 2002 | 998,056 | 1,638,822 | –640,766 | 9.4 | 15.4 | –6.0 | 398,911 | 693,450 | –294,539 | 10.5 | 18.2 | –7.7 |
| 2003 | 1,050,565 | 1,657,569 | –607,004 | 9.9 | 15.6 | –5.7 | 426,736 | 708,257 | –281,521 | 11.1 | 18.4 | –7.3 |
| 2004 | 1,074,247 | 1,606,894 | –532,647 | 10.1 | 15.2 | –5.1 | 428,230 | 688,508 | –260,278 | 11.2 | 18.1 | –6.9 |
| 2005 | 1,036,870 | 1,595,762 | –558,892 | 9.8 | 15.1 | –5.3 | 420,506 | 708,173 | –287,667 | 11.0 | 18.6 | –7.6 |
| 2006 | 1,044,540 | 1,501,245 | –456,705 | 10.0 | 14.3 | –4.3 | 435,097 | 665,458 | –230,361 | 11.4 | 17.4 | –6.0 |
| 2007 | 1,120,741 | 1,445,411 | –324,670 | 10.7 | 13.8 | –3.1 | 489,381 | 635,034 | –145,653 | 12.9 | 16.7 | –3.8 |
| 2008 | 1,194,820 | 1,443,529 | –248,709 | 11.4 | 13.8 | –2.4 | 519,127 | 632,425 | –113,298 | 13.7 | 16.7 | –3.0 |
| 2009 | 1,237,615 | 1,397,591 | –159,976 | 11.8 | 13.3 | –1.5 | 524,072 | 612,952 | –88,880 | 13.9 | 16.3 | –2.4 |
| 2010 | 1,263,893 | 1,421,734 | –157,841 | 12.0 | 13.5 | –1.5 | 520,055 | 606,782 | –81,727 | 14.0 | 16.1 | –2.1 |
| 2011 | 1,270,047 | 1,356,696 | –88,649 | 12.0 | 12.8 | –0.8 | 526,582 | 569,024 | –42,442 | 14.1 | 15.2 | –1.1 |
| 2012 | 1,355,674 | 1,353,635 | 2,039 | 12.8 | 12.8 | 0.0 | 546,410 | 552,700 | –6,290 | 14.7 | 14.8 | –0.1 |
| 2013 | 1,357,310 | 1,332,505 | 24,805 | 12.8 | 12.5 | 0.3 | 538,512 | 539,304 | –792 | 14.5 | 14.5 | –0.0 |
| 2014 | 1,394,860 | 1,362,810 | 32,050 | 12.9 | 12.6 | 0.3 | 547,823 | 549,537 | –1,714 | 14.4 | 14.5 | –0.1 |
| 2015 | 1,455,283 | 1,361,891 | 93,392 | 13.4 | 12.6 | 0.8 | 485,296 | 546,650 | –61,354 | 12.8 | 14.4 | –1.6 |
| 2016 | 1,426,591 | 1,354,944 | 71,597 | 13.1 | 12.4 | 0.7 | 462,138 | 536,071 | –73,933 | 12.2 | 14.2 | –2.0 |
| 2017 | 1,269,527 | 1,310,235 | –40,708 | 11.6 | 12.0 | –0.4 | 420,780 | 515,890 | –95,110 | 11.2 | 13.7 | –2.5 |
| 2018 | 1,205,231 | 1,317,703 | –112,472 | 11.0 | 12.0 | –1.0 | 399,113 | 511,207 | –112,094 | 10.6 | 13.6 | –3.0 |
Note: Russian data includes Crimea starting in 2014.
Age structure
| The population of Russia (without Finland) by age groups of ten years in %, according to the General Census of 1897[65] | ||||||||
|---|---|---|---|---|---|---|---|---|
| Districts (1897) | 0–9 years | 10–19 years | 20–29 years | 30–39 years | 40–49 years | 50–59 years | 60–69 years | 70 years and over, and unknown figures |
| European Russia | 27.3 | 21.4 | 15.8 | 12.4 | 9.4 | 6.7 | 4.4 | 2.6 |
| Privislinsky Krai (Poland) | 28.2 | 21.0 | 17.4 | 12.9 | 7.8 | 6.5 | 3.9 | 2.3 |
| Caucasus | 30.4 | 20.1 | 16.9 | 12.8 | 8.5 | 5.5 | 3.5 | 2.3 |
| Siberia | 26.0 | 20.1 | 15.9 | 12.8 | 10.2 | 7.2 | 4.7 | 3.1 |
| Central Asia | 24.2 | 19.3 | 18.7 | 14.0 | 10.5 | 6.8 | 4.2 | 2.3 |
| Total empire (without Finland) | 27.3 | 21.1 | 16.2 | 12.6 | 9.3 | 6.6 | 4.3 | 2.6 |
Current population statistics


Demographic statistics according to the World Population Review in 2019.[66]
- One birth every 18 seconds
- One death every 16 seconds
- Net loss of one person every 8 minutes
- One net migrant every 4 minutes
Demographic statistics according to the US based CIA World Factbook, unless otherwise indicated.[67]
- Population
- 142,122,776 (July 2018 est.)
- 142,257,519 (July 2017 est.)
- Age structure
- 0–14 years: 17.21% (male 12,566,314 /female 11,896,416)
- 15–24 years: 9.41% (male 6,840,759 /female 6,530,991)
- 25–54 years: 44.21% (male 30,868,831 /female 31,960,407)
- 55–64 years: 14.51% (male 8,907,031 /female 11,709,921)
- 65 years and over: 14.66% (male 6,565,308 /female 14,276,798) (2018 est.)
- 0–14 years: 17.12% (male 12,509,563/female 11,843,254)
- 15–24 years: 9.46% (male 6,881,880/female 6,572,191)
- 25–54 years: 44.71% (male 31,220,990/female 32,375,489)
- 55–64 years: 14.44% (male 8,849,707/female 11,693,131)
- 65 years and over: 14.28% (male 6,352,557/female 13,958,757) (2017 est.)
- Median age
- total: 39.8 years. Country comparison to the world: 52nd
- male: 36.9 years
- female: 42.7 years (2018 est.)
- total: 39.6 years
- male: 36.6 years
- female: 42.5 years (2017 est.)
- total: 39.6 years
- male: 36.7 years
- female: 41.6 years (2009)[68]
- Birth rate
- 10.7 births/1,000 population (2018 est.) Country comparison to the world: 184th
- 11 births/1,000 population (2017 est.)
- Death rate
- 13.4 deaths/1,000 population (2018 est.) Country comparison to the world: 8th
- Total fertility rate
- 1.61 children born/woman (2018 est.) Country comparison to the world: 179th
- Net migration rate
- 1.7 migrant(s)/1,000 population (2017 est.) Country comparison to the world: 52nd
- Population growth rate
- –0.11% (2018 est.) Country comparison to the world: 205th
- –0.08% (2017 est.)
- +0.19% (2014 est.)
- Mother's mean age at first birth
- 24.6 years (2009 est.)
- Life expectancy at birth
- total population: 71.3 years. Country comparison to the world: 155th
- male: 65.6 years
- female: 77.3 years (2018 est.)
- Infant mortality rate
- total: 6.8 deaths/1,000 live births
- male: 7.6 deaths/1,000 live births
- female: 5.9 deaths/1,000 live births (2017 est.) Country comparison to the world: 163rd
- Literacy
definition: age 15 and over can read and write (2015 est.)
- total population: 99.7%
- male: 99.7%
- female: 99.6% (2015 est.)
- School life expectancy (primary to tertiary education)
- total: 16 years
- male: 15 years
- female: 16 years (2016)
- Unemployment, youth ages 15–24
- total: 16%. Country comparison to the world: 83rd
- male: 15.3%
- female: 16.9% (2015 est.)
- Ethnic groups
Russian 77.7%, Tatar 3.7%, Ukrainian 1.4%, Bashkir 1.1%, Chuvash 1%, Chechen 1%, Black 0.1% other 10.2%, unspecified 3.9% note: nearly 200 national and/or ethnic groups are represented in Russia's 2010 census (2010 est.)
- Religions
Russian Orthodox 15–20%, Muslim 10–15%, other Christian 2% (2006 est.) Note: estimates are of practicing worshipers; Russia has large populations of non-practicing believers and non-believers, a legacy of over seven decades of Soviet rule; Russia officially recognizes Orthodox Christianity, Islam, Judaism, and Buddhism as traditional religions.
- Languages
Russian (official) 85.7%, Tatar 3.2%, Chechen 1%, other 10.1%. Note: data represent native language spoken (2010 est.)
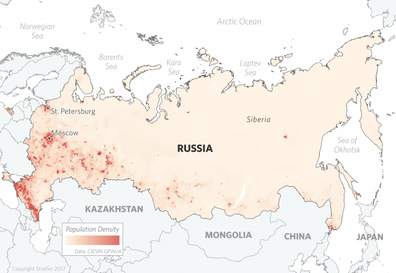
- Population distribution
Population is heavily concentrated in the westernmost fifth of the country extending from the Baltic Sea, south to the Caspian Sea, and eastward parallel to the Kazakh border; elsewhere, sizeable pockets are isolated and generally found in the south
- Urbanization
- urban population: 74.4% of total population (2018)
- rate of urbanization: 0.18% annual rate of change (2015–20 est.)
- 74% urban, 26% rural (2010 Russian Census)
- Population density
8.4 people per square kilometer (2010 Russian Census)[69]
- Sex ratio
at birth: 1.06 male(s)/female
under 15 years: 1.05 male(s)/female
15–64 years: 0.4 male(s)/female
65 years and over: 0.46 male(s)/female
total population: 0.86 male(s)/female (2009)[68]
Total fertility rate issue
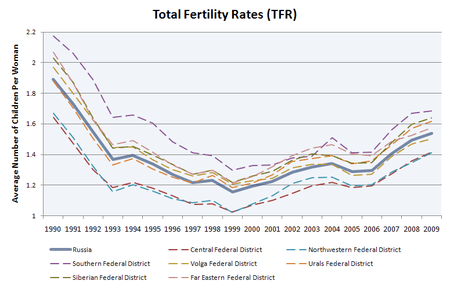
In 2017, Russia's TFR of 1.62 children born/woman was among the highest in Eastern Europe, meaning that the average Russian family had more children than an average family in most other Eastern European countries, but that the rate was below the replacement rate of 2.1. After experiencing a surge in births for several years, Russia's birth rate fell in 2017 by 10.6% percent, reaching its lowest level in 10 years.[30]
In 1990, just prior to the dissolution of the Soviet Union, Russia's total fertility rate (TFR) stood at 1.89. Fertility rates had already begun to decline in the late 1980s due to the natural progression of Russia's demographic structure, but the rapid and widely negative changes in society following the collapse greatly influenced the rate of decline.[70] The TFR hit a historic low of 1.157 in 1999.[71] The only federal subject of Russia to see a decline in fertility since 1999 is Ingushetia, where the TFR fell from 2.443 to 2.278 in 2014.
In 2009, 8 of Russia's federal subjects had a TFR above 2.1 children per woman (the approximate minimum required to ensure population replacement), These federal subjects are Chechnya (3.38), Tuva (2.81), Ust-Orda Buryat Okrug (2.73), Agin-Buryat Okrug (2.63), Komi-Permyak (2.16), Evenk Okrug (2.58), Altai Republic (2.36), Nenets Autonomous Okrug (2.1). Of these federal subjects, four have an ethnic Russian majority (Altai, Evenk, Ust-Orda and Nenets).[72][73] In 2011, the highest TFR were recorded in Chechnya (3.362), Tyva (3.249), Ingushetia (2.94), Altai Republic (2.836), Sakha Republic (2.057), Buryatia (2.027), and Nenets Autonomous Okrug (2.007).[74]
Until 2010, the Russian republic of Chechnya was the region with the highest birth rate in the former USSR (excluding Central Asia). However, in 2011, the Armenian province of Qashatagh overtook it (28.9 vs 29.3 per 1.000).[75]
In 2010, the average number of children born to women has decreased from 1513 to 1000 women from 2002 to 1469 in 2010 in urban areas the figure was 1328 children (2002–1350), and in the village – 1876 (in 2002, – 1993).
In recent years the percentage of children per woman 16 years or more were:
Year : 2002–2010
1 child : 30.5%–31.2%
2 children : 33.7%–34.4%
3 children : 8.9%–8.7%
4 or more children : 5.2%–4.2%
no children : 21.7%–21.5%
Despite a decrease in women who have not had children, the number of three-child and large families has declined between 2002 and 2010.
In every region in Russia, rural areas reported higher TFR compared to urban areas. In most of the federal subjects in Siberia and the Russian Far East, the total fertility rates were high, but not high enough to ensure population replacement. For example, Zabaykalsky Krai had a TFR of 1.82, which is higher than the national average, but less than the 2.1 needed for population replacement.[72]
Compared to the G7 countries, in 2015, Russian TFR of 1.78 children/ woman[76] was lower than that of France (1.93), the USA (1.84), the UK (1.82). Yet its TFR is higher than in other G7 countries like Canada (1.61), Germany (1.50), Japan (1.46) and Italy (1.35).
Compared to other most populous nations, Russia has a lower TFR than Nigeria (5.37), Pakistan (3.42), Indonesia (2.5), India (2.30), Mexico (2.19), the USA (1.84),[77] and higher TFR than Brazil (1.74), and China (1.5–1.6).
| Children born per woman by oblast | Total fertility rate/1990 | Urban fertility rate/1990 | Rural fertility rate/1990 | Total fertility rate/2014 | Urban fertility rate/2014 | Rural fertility rate/2014 |
|---|---|---|---|---|---|---|
| Russian Federation | 1.89 | 1.70 | 2.60 | 1.75 | 1.59 | 2.32 |
| North Caucasian Federal District | 2.03 | 1.68 | 2.41 | |||
| Chechnya | 2.84 | 2.16 | 3.35 | 2.91 | 2.83 | 2.95 |
| Ingushetia | 2.84 | 2.16 | 3.35 | 2.28 | 2.13 | 2.39 |
| Dagestan | 3.07 | 2.57 | 3.52 | 2.08 | 1.50 | 2.68 |
| North Ossetia-Alania | 2.23 | 2.20 | 2.30 | 2.01 | 2.02 | 1.98 |
| Kabardino-Balkaria | 2.45 | 2.04 | 3.11 | 1.83 | 1.65 | 2.02 |
| Karachay-Cherkessia | 2.19 | 1.89 | 2.51 | 1.65 | 1.48 | 1.78 |
| Stavropol Krai | 2.10 | 1.73 | 2.64 | 1.62 | 1.43 | 1.96 |
| Ural Federal District | 1.88 | 1.73 | 2.68 | 1.96 | 1.82 | 2.76 |
| Kurgan Oblast | 2.15 | 1.82 | 2.72 | 2.10 | 1.78 | 2.87 |
| Yamalo-Nenets Autonomous Okrug | 2.19 | 1.94 | 3.19 | |||
| Khanty-Mansi Autonomous Okrug | 2.09 | 2.07 | 2.41 | |||
| Tyumen Oblast | 1.99 | 1.85 | 2.55 | 2.07 | 1.94 | 2.71 |
| Sverdlovsk Oblast | 1.73 | 1.63 | 2.69 | 1.92 | 1.80 | 2.77 |
| Chelyabinsk Oblast | 1.89 | 1.74 | 2.80 | 1.86 | 1.70 | 2.78 |
| Siberian Federal District | 2.03 | 1.79 | 2.87 | 1.90 | 1.65 | 2.94 |
| Tuva Republic | 3.22 | 2.64 | 3.85 | 3.49 | 2.34 | 6.78 |
| Altai Republic | 2.52 | 1.62 | 3.08 | 2.88 | 1.70 | 5.20 |
| Buriatia | 2.49 | 2.10 | 3.37 | 2.26 | 1.87 | 3.12 |
| Zabaykalsky Krai | 2.49 | 2.10 | 3.38 | 2.08 | 1.75 | 3.13 |
| Khakassia | 2.27 | 2.04 | 3.04 | 2.01 | 1.72 | 2.82 |
| Irkutsk Oblast | 2.22 | 2.02 | 3.29 | 1.97 | 1.76 | 2.99 |
| Altai Krai | 1.91 | 1.66 | 2.42 | 1.84 | 1.52 | 2.66 |
| Omsk Oblast | 1.98 | 1.69 | 2.87 | 1.95 | 1.68 | 2.93 |
| Kemerovo Oblast | 1.92 | 1.84 | 2.62 | 1.78 | 1.69 | 2.43 |
| Krasnoyarsk Krai | 1.88 | 1.65 | 2.85 | 1.81 | 1.61 | 2.91 |
| Novosibirsk Oblast | 1.83 | 1.64 | 2.66 | 1.77 | 1.59 | 2.74 |
| Tomsk Oblast | 1.62 | 1.40 | 2.41 | 1.59 | 1.37 | 2.68 |
| Far East Federal District | 2.07 | 1.88 | 2.80 | 1.87 | 1.64 | 2.88 |
| Sakha Republic | 2.46 | 2.08 | 3.28 | 2.25 | 1.78 | 3.47 |
| Chukotka Autonomous Okrug | 2.09 | 1.82 | 2.88 | 2.04 | 1.59 | 3.15 |
| Jewish Autonomous Oblast | 2.40 | 2.00 | 3.30 | 1.95 | 1.72 | 2.60 |
| Amur Oblast | 2.18 | 1.91 | 3.00 | 1.85 | 1.53 | 2.94 |
| Sakhalin Oblast | 2.00 | 1.94 | 2.47 | 1.96 | 1.83 | 2.85 |
| Kamchatka Krai | 1.69 | 1.57 | 2.25 | 1.85 | 1.75 | 2.29 |
| Khabarovsk Krai | 1.99 | 1.88 | 2.63 | 1.79 | 1.65 | 2.72 |
| Magadan Oblast | 1.89 | 1.83 | 2.56 | 1.66 | 1.63 | 2.88 |
| Primorsky Krai | 1.97 | 1.83 | 2.58 | 1.73 | 1.55 | 2.61 |
| Volga Federal District | 1.97 | 1.75 | 2.72 | 1.79 | 1.60 | 2.46 |
| Orenburg Oblast | 2.20 | 1.87 | 3.01 | 2.03 | 1.59 | 3.16 |
| Perm Krai | 1.99 | 1.80 | 2.85 | 1.98 | 1.72 | 3.16 |
| Mari El | 2.16 | 1.87 | 2.79 | 1.98 | 1.74 | 2.65 |
| Udmurtia | 2.05 | 1.81 | 2.80 | 1.96 | 1.58 | 3.13 |
| Bashkortostan | 2.18 | 1.84 | 3.09 | 1.95 | 1.74 | 2.53 |
| Kirov Oblast | 2.01 | 1.82 | 2.57 | 1.89 | 1.62 | 3.61 |
| Chuvashia Republic | 2.12 | 1.78 | 2.98 | 1.88 | 1.55 | 2.89 |
| Tatarstan | 2.05 | 1.86 | 2.87 | 1.84 | 1.75 | 2.22 |
| Ulyanovsk Oblast | 1.94 | 1.78 | 2.61 | 1.67 | 1.58 | 2.00 |
| Samara Oblast | 1.73 | 1.62 | 2.35 | 1.65 | 1.55 | 2.13 |
| Nizhny Novgorod Oblast | 1.69 | 1.59 | 2.20 | 1.59 | 1.52 | 1.96 |
| Saratov Oblast | 1.91 | 1.70 | 2.70 | 1.57 | 1.42 | 2.14 |
| Penza Oblast | 1.82 | 1.63 | 2.34 | 1.53 | 1.42 | 1.86 |
| Mordovia | 1.87 | 1.69 | 2.29 | 1.37 | 1.31 | 1.54 |
| Southern Federal District | 1.71 | 1.60 | 1.92 | |||
| Astrakhan Oblast | 2.14 | 1.81 | 2.93 | 1.97 | 1.82 | 2.27 |
| Kalmykia | 2.66 | 2.29 | 3.10 | 1.85 | 1.85 | 1.85 |
| Krasnodar Krai | 2.06 | 1.90 | 2.30 | 1.81 | 1.82 | 1.77 |
| Adygea | 2.06 | 1.88 | 2.37 | 1.73 | 1.55 | 1.93 |
| Volgograd Oblast | 1.91 | 1.72 | 2.67 | 1.57 | 1.42 | 2.11 |
| Rostov Oblast | 1.80 | 1.62 | 2.34 | 1.61 | 1.44 | 2.03 |
| North-West Federal District | 1.67 | 1.58 | 2.25 | 1.61 | 1.53 | 2.25 |
| Nenets Autonomous Okrug | 2.42 | 1.83 | 6.09 | |||
| Komi Republic | 1.87 | 1.76 | 2.39 | 2.01 | 1.67 | 4.74 |
| Vologda Oblast | 2.02 | 1.81 | 2.60 | 1.86 | 1.64 | 2.77 |
| Arkhangelsk Oblast | 2.00 | 1.80 | 2.71 | 1.84 | 1.54 | 4.23 |
| Novgorod Oblast | 1.87 | 1.71 | 2.39 | 1.75 | 1.62 | 2.20 |
| Pskov Oblast | 1.84 | 1.70 | 2.30 | 1.70 | 1.52 | 2.36 |
| Republic of Karelia | 1.87 | 1.80 | 2.34 | 1.74 | 1.52 | 3.71 |
| Kaliningrad Oblast | 1.81 | 1.68 | 2.39 | 1.70 | 1.59 | 2.08 |
| Murmansk Oblast | 1.60 | 1.61 | 1.54 | 1.65 | 1.63 | 2.03 |
| Saint Petersburg | 1.40 | 1.40 | 1.52 | 1.52 | ||
| Leningrad Oblast | 1.66 | 1.66 | 1.67 | 1.28 | 1.33 | 1.19 |
| Central Federal District | 1.64 | 1.54 | 2.19 | 1.51 | 1.45 | 1.86 |
| Kostroma Oblast | 1.93 | 1.70 | 2.63 | 1.87 | 1.64 | 2.67 |
| Kursk Oblast | 1.85 | 1.68 | 2.33 | 1.70 | 1.51 | 2.30 |
| Tver Oblast | 1.81 | 1.63 | 2.45 | 1.66 | 1.54 | 2.17 |
| Yaroslavl Oblast | 1.69 | 1.60 | 2.27 | 1.64 | 1.55 | 2.20 |
| Kaluga Oblast | 1.78 | 1.65 | 2.19 | 1.69 | 1.62 | 1.94 |
| Lipetsk Oblast | 1.81 | 1.66 | 2.20 | 1.66 | 1.52 | 1.95 |
| Vladimir Oblast | 1.79 | 1.71 | 2.22 | 1.64 | 1.59 | 1.87 |
| Ryazan Oblast | 1.80 | 1.67 | 2.25 | 1.60 | 1.37 | 2.37 |
| Ivanovo Oblast | 1.72 | 1.61 | 2.46 | 1.57 | 1.52 | 1.87 |
| Bryansk Oblast | 2.02 | 1.82 | 2.75 | 1.56 | 1.42 | 1.91 |
| Oryol Oblast | 1.84 | 1.58 | 2.53 | 1.55 | 1.26 | 2.35 |
| Belgorod Oblast | 1.91 | 1.74 | 2.39 | 1.54 | 1.41 | 1.91 |
| Moscow Oblast | 1.44 | 1.39 | 1.66 | 1.60 | 1.63 | 1.47 |
| Smolensk Oblast | 1.79 | 1.63 | 2.38 | 1.53 | 1.43 | 1.89 |
| Voronezh Oblast | 1.78 | 1.64 | 2.12 | 1.47 | 1.37 | 1.80 |
| Tula Oblast | 1.68 | 1.60 | 2.16 | 1.47 | 1.41 | 1.65 |
| Tambov Oblast | 1.83 | 1.61 | 2.29 | 1.49 | 1.40 | 1.64 |
| City of Moscow | 1.42 | 1.42 | 1.34 | 1.34 | 1.69 | |
Natural increase current
Experts were puzzled with a sharp increase in deaths coincided with a sharp increase in life expectancy. While they have found out that a decrease in potential mothers led to a decrease in births and a rapid rise in fertility.[78]
Data from Federal State Statistics Service.[79]
- Number of births from January–April 2019 =

- Number of births from January–April 2020 =
- Number of deaths from January–April 2019 =

- Number of deaths from January–April 2020 =
- Natural increase between January–April 2019 =
- Natural increase between January–April 2020 =
| January–September | Birth/2019 | Birth/2018 | Death/2019 | Death/2018 |
|---|---|---|---|---|
| Russian Federation | 10.2 | 11.0 | 12.3 | 12.6 |
| North Caucasian Federal District | 13.4 | 14.4 | 7.3 | 7.5 |
| Chechnya | 18.7 | 20.5 | 4.4 | 4.5 |
| Ingushetia | 15.7 | 15.8 | 2.7 | 2.9 |
| Dagestan | 14.6 | 15.9 | 4.7 | 5.0 |
| North Ossetia-Alania | 12.2 | 13.0 | 10.4 | 10.3 |
| Kabardino-Balkaria | 11.4 | 12.4 | 8.3 | 8.2 |
| Karachay-Cherkessia | 11.1 | 10.6 | 8.9 | 8.9 |
| Stavropol Krai | 10.0 | 11.0 | 11.3 | 11.5 |
| Far East Federal District | 11.2 | 12.0 | 12.3 | 12.1 |
| Sakha Republic | 13.1 | 14.0 | 7.9 | 8.2 |
| Buriatia | 12.8 | 14.2 | 11.1 | 10.9 |
| Zabaykalsky Krai | 11.9 | 12.6 | 12.4 | 12.3 |
| Sakhalin Oblast | 11.7 | 12.3 | 12.5 | 12.6 |
| Khabarovsk Krai | 11.0 | 11.5 | 13.4 | 12.7 |
| Jewish Autonomous Oblast | 10.8 | 11.7 | 14.0 | 13.7 |
| Kamchatka Krai | 10.6 | 11.1 | 11.1 | 11.3 |
| Chukotka Autonomous Okrug | 10.5 | 12.7 | 9.7 | 11.2 |
| Amur Oblast | 10.0 | 11.2 | 14.0 | 13.4 |
| Primorsky Krai | 9.7 | 10.5 | 13.6 | 13.6 |
| Magadan Oblast | 9.5 | 9.7 | 11.8 | 11.4 |
| Ural Federal District | 11.1 | 12.1 | 11.8 | 12.0 |
| Tyumen Oblast | 12.7 | 13.7 | 7.8 | 8.0 |
| Khanty-Mansi Autonomous Okrug | 12.6 | 13.7 | 6.1 | 6.3 |
| Yamalo-Nenets Autonomous Okrug | 12.6 | 13.2 | 4.7 | 4.7 |
| Sverdlovsk Oblast | 10.9 | 11.8 | 13.5 | 13.7 |
| Chelyabinsk Oblast | 10.0 | 11.0 | 13.2 | 13.3 |
| Kurgan Oblast | 9.4 | 10.4 | 15.6 | 15.7 |
| Siberian Federal District | 10.5 | 11.5 | 13.0 | 13.1 |
| Tuva | 18.9 | 20.6 | 8.6 | 9.0 |
| Altai Republic | 13.7 | 15.5 | 10.1 | 10.0 |
| Irkutsk Oblast | 11.9 | 13.1 | 13.2 | 13.1 |
| Novosibirsk Oblast | 10.9 | 11.8 | 12.9 | 13.1 |
| Krasnoyarsk Krai | 10.7 | 11.7 | 12.4 | 12.6 |
| Khakassia | 10.5 | 11.8 | 12.4 | 12.5 |
| Omsk Oblast | 9.9 | 11.0 | 12.8 | 12.9 |
| Tomsk Oblast | 9.8 | 11.0 | 11.3 | 11.3 |
| Altai Krai | 9.3 | 10.2 | 14.2 | 14.4 |
| Kemerovo Oblast | 9.1 | 10.0 | 14.4 | 14.6 |
| Southern Federal District | 9.8 | 10.5 | 12.9 | 12.9 |
| Krasnodar Krai | 10.8 | 11.4 | 12.4 | 12.3 |
| Astrakhan Oblast | 10.7 | 11.5 | 11.5 | 11.7 |
| Kalmykia | 10.2 | 11.1 | 9.6 | 9.7 |
| Crimea | 10.0 | 10.6 | 14.1 | 14.1 |
| Sevastopol | 9.5 | 10.2 | 13.3 | 12.8 |
| Rostov Oblast | 9.0 | 9.7 | 13.4 | 13.5 |
| Adygea | 8.9 | 9.7 | 12.5 | 12.4 |
| Volgograd Oblast | 8.4 | 9.3 | 13.1 | 13.4 |
| Volga Federal District | 9.7 | 10.7 | 13.0 | 13.5 |
| Tatarstan | 11.0 | 12.0 | 11.0 | 11.7 |
| Bashkortostan | 10.5 | 11.7 | 12.2 | 12.6 |
| Perm Krai | 10.4 | 11.4 | 13.3 | 13.7 |
| Orenburg Oblast | 10.0 | 11.1 | 13.2 | 13.6 |
| Mari El | 10.0 | 11.0 | 12.1 | 12.9 |
| Udmurtia | 9.9 | 11.1 | 12.0 | 12.2 |
| Chuvashia Republic | 9.6 | 10.8 | 12.4 | 12.8 |
| Samara Oblast | 9.3 | 10.4 | 13.3 | 13.7 |
| Nizhny Novgorod Oblast | 9.1 | 10.0 | 14.7 | 15.1 |
| Kirov Oblast | 9.0 | 10.1 | 14.5 | 15.2 |
| Ulyanovsk Oblast | 8.8 | 9.8 | 13.9 | 14.3 |
| Saratov Oblast | 8.3 | 9.1 | 13.8 | 14.0 |
| Penza Oblast | 8.0 | 8.7 | 14.0 | 14.8 |
| Mordovia | 7.6 | 8.5 | 13.3 | 13.6 |
| North-West Federal District | 9.6 | 10.5 | 12.5 | 12.9 |
| Nenets Autonomous Okrug | 13.7 | 14.3 | 8.8 | 9.6 |
| Saint Petersburg | 10.9 | 12.1 | 11.1 | 11.6 |
| Vologda Oblast | 9.9 | 10.6 | 14.2 | 14.6 |
| Komi Republic | 9.6 | 10.3 | 12.0 | 11.9 |
| Kaliningrad Oblast | 9.4 | 10.7 | 12.0 | 12.3 |
| Arkhangelsk Oblast | 9.1 | 9.9 | 13.2 | 13.3 |
| Republic of Karelia | 9.0 | 9.8 | 14.5 | 14.9 |
| Murmansk Oblast | 8.9 | 9.8 | 11.4 | 11.4 |
| Novgorod Oblast | 8.7 | 9.8 | 16.5 | 16.8 |
| Pskov Oblast | 8.5 | 9.3 | 17.0 | 17.4 |
| Leningrad Oblast | 7.4 | 7.7 | 12.7 | 13.4 |
| Central Federal District | 9.5 | 10.1 | 12.7 | 13.0 |
| City of Moscow | 11.0 | 10.5 | 9.6 | 9.7 |
| Moscow Oblast | 9.5 | 11.4 | 12.0 | 12.5 |
| Kostroma Oblast | 9.2 | 9.8 | 14.7 | 14.9 |
| Yaroslavl Oblast | 9.1 | 9.8 | 14.8 | 15.1 |
| Kaluga Oblast | 9.0 | 10.4 | 14.7 | 15.1 |
| Lipetsk Oblast | 8.7 | 9.5 | 14.4 | 14.4 |
| Belgorod Oblast | 8.6 | 9.4 | 13.6 | 13.6 |
| Ryazan Oblast | 8.5 | 9.4 | 15.4 | 15.6 |
| Vladimir Oblast | 8.5 | 9.3 | 15.7 | 16.1 |
| Voronezh Oblast | 8.5 | 9.3 | 14.2 | 14.8 |
| Tver Oblast | 8.5 | 9.2 | 16.3 | 17.2 |
| Bryansk Oblast | 8.4 | 9.2 | 14.9 | 15.2 |
| Kursk Oblast | 8.3 | 9.3 | 15.0 | 15.5 |
| Oryol Oblast | 8.2 | 9.1 | 15.5 | 15.8 |
| Ivanovo Oblast | 8.1 | 9.1 | 15.9 | 16.4 |
| Smolensk Oblast | 7.7 | 8.4 | 15.2 | 15.7 |
| Tula Oblast | 7.7 | 8.4 | 15.9 | 16.2 |
| Tambov Oblast | 7.7 | 8.1 | 15.1 | 15.7 |
Natural increase 2017
| January–December | Birth/2017 | Birth/2016 | Birth/2015 | Birth/2014 | Birth/2013 | Death/2017 | Death/2016 | Death/2015 | Death/2014 | Death/2013 | |
|---|---|---|---|---|---|---|---|---|---|---|---|
| Russian Federation | 11.5 | 12.9 | 13.3 | 13.3 | 13.2 | 12.4 | 12.9 | 13.1 | 13.1 | 13.0 | |
| North Caucasian Federal District | 14.9 | 15.9 | 16.6 | 17.3 | 17.2 | 7.6 | 7.8 | 7.9 | 8.1 | 8.0 | |
| Chechnya | 21.0 | 21.3 | 23.2 | 24.2 | 24.9 | 4.6 | 4.7 | 4.9 | 5.0 | 5.0 | |
| Ingushetia | 16.5 | 17.1 | 18.6 | 20.7 | 21.4 | 3.2 | 3.3 | 3.3 | 3.5 | 3.5 | |
| Dagestan | 16.4 | 17.4 | 18.2 | 19.1 | 18.8 | 5.1 | 5.2 | 5.4 | 5.6 | 5.5 | |
| Kabardino-Balkaria | 12.8 | 14.1 | 14.6 | 15.7 | 15.5 | 8.5 | 8.5 | 8.8 | 8.8 | 8.9 | |
| North Ossetia-Alania | 12.8 | 14.1 | 14.6 | 15.4 | 15.3 | 10.2 | 10.3 | 10.7 | 10.7 | 10.5 | |
| Stavropol Krai | 11.6 | 13.0 | 13.0 | 13.1 | 12.7 | 11.2 | 11.7 | 11.6 | 11.8 | 11.7 | |
| Karachay-Cherkessia | 11.0 | 11.9 | 12.4 | 13.6 | 13.8 | 9.3 | 9.4 | 9.6 | 9.7 | 9.5 | |
| Ural Federal District | 12.6 | 14.2 | 14.9 | 15.2 | 15.1 | 11.7 | 12.3 | 12.5 | 12.4 | 12.4 | |
| Tyumen Oblast | 14.2 | 15.8 | 16.7 | 17.2 | 17.0 | 7.9 | 8.2 | 8.3 | 8.3 | 8.2 | |
| Khanty-Mansi Autonomous Okrug | 14.1 | 15.7 | 16.6 | 17.3 | 17.5 | 6.2 | 6.2 | 6.4 | 6.4 | 6.3 | |
| Yamalo-Nenets Autonomous Okrug | 14.0 | 15.4 | 16.5 | 16.9 | 16.4 | 4.9 | 5.2 | 5.2 | 5.1 | 5.1 | |
| Sverdlovsk Oblast | 12.4 | 13.8 | 14.4 | 14.5 | 14.5 | 13.3 | 14.0 | 14.2 | 14.0 | 13.8 | |
| Chelyabinsk Oblast | 11.5 | 13.3 | 13.9 | 14.3 | 14.2 | 13.0 | 13.6 | 13.9 | 13.8 | 13.9 | |
| Kurgan Oblast | 11.1 | 12,4 | 13.3 | 13.6 | 14.0 | 15.2 | 15.8 | 16.1 | 15.9 | 16.1 | |
| Siberian Federal District | 12.3 | 13.8 | 14.4 | 14.7 | 14.9 | 12.7 | 13.0 | 13.2 | 13.3 | 13.3 | |
| Tuva | 21.8 | 23.4 | 23.7 | 25.3 | 26.1 | 8.7 | 9.8 | 10.3 | 10.9 | 11.0 | |
| Altai Republic | 15.8 | 18.1 | 18.7 | 20.9 | 20.9 | 9.6 | 10.0 | 10.9 | 11.2 | 11.4 | |
| Buriatia | 14.5 | 16.4 | 17.3 | 17.5 | 17.6 | 10.6 | 11.2 | 11.4 | 11.5 | 11.8 | |
| Irkutsk Oblast | 13.3 | 14.7 | 15.4 | 15.4 | 15.6 | 12.9 | 13.3 | 13.7 | 13.8 | 13.7 | |
| Zabaykalsky Krai | 13.2 | 14.6 | 15.4 | 16.0 | 15.9 | 11.6 | 12.3 | 12.9 | 12.4 | 12.5 | |
| Khakassia | 12.4 | 14.1 | 14.8 | 15.3 | 15.7 | 12.6 | 12.8 | 13.5 | 13.2 | 13.1 | |
| Krasnoyarsk Krai | 12.4 | 13.9 | 14.4 | 14.5 | 14.5 | 12.3 | 12.5 | 12.7 | 12.7 | 12.8 | |
| Novosibirsk Oblast | 12.4 | 13.9 | 14.2 | 14.1 | 14.2 | 12.9 | 13.1 | 13.1 | 13.3 | 13.6 | |
| Omsk Oblast | 11.5 | 13.3 | 14.4 | 15.1 | 14.8 | 12.8 | 13.3 | 13.4 | 13.3 | 13.4 | |
| Tomsk Oblast | 11.7 | 13.2 | 13.6 | 13.7 | 13.8 | 11.4 | 11.4 | 11.5 | 11.8 | 11.8 | |
| Altai Krai | 10.8 | 12.2 | 12.6 | 13.2 | 13.5 | 14.0 | 14.0 | 14.2 | 14.2 | 14.2 | |
| Kemerovo Oblast | 10.5 | 12.1 | 12.5 | 13.2 | 13.6 | 14.1 | 14.3 | 14.5 | 14.6 | 14.6 | |
| Far East Federal District | 12.1 | 13.4 | 13.9 | 14.1 | 13.9 | 12.1 | 12.5 | 12.6 | 12.6 | 12.6 | |
| Sakha Republic | 14.4 | 16.0 | 17.1 | 17.8 | 17.5 | 8.1 | 8.4 | 8.6 | 8.6 | 8.7 | |
| Chukotka Autonomous Okrug | 13.2 | 13.4 | 13.5 | 13.3 | 13.1 | 9.1 | 10.0 | 9.6 | 10.7 | 10.5 | |
| Sakhalin Oblast | 12.9 | 14.3 | 13.6 | 13.6 | 13.0 | 12.0 | 13.1 | 13.2 | 13.0 | 13.1 | |
| Khabarovsk Krai | 12.0 | 13.4 | 14.3 | 14.0 | 14.0 | 13.0 | 13.1 | 13.4 | 13.3 | 13.4 | |
| Jewish Autonomous Oblast | 11.7 | 13.3 | 14.0 | 13.8 | 13.7 | 13.2 | 15.0 | 15.4 | 14.9 | 14.5 | |
| Amur Oblast | 11.8 | 12.9 | 13.3 | 13.8 | 14.1 | 13.4 | 13.7 | 13.9 | 13.9 | 13.8 | |
| Kamchatka Krai | 11.8 | 12.9 | 13.1 | 13.2 | 13.0 | 11.0 | 11.6 | 11.4 | 11.5 | 11.4 | |
| Primorsky Krai | 10.9 | 12.2 | 12.7 | 12.8 | 12.6 | 13.2 | 13.6 | 13.5 | 13.4 | 13.5 | |
| Magadan Oblast | 10.9 | 11.1 | 11.8 | 12.2 | 12.5 | 11.3 | 11.3 | 11.8 | 11.9 | 11.9 | |
| Volga Federal District | 11.1 | 12.9 | 13.3 | 13.4 | 13.3 | 13.1 | 13.6 | 13.9 | 13.9 | 14.0 | |
| Tatarstan | 12.4 | 14.4 | 14.7 | 14.8 | 14.8 | 11.3 | 11.6 | 12.0 | 12.2 | 12.1 | |
| Perm Krai | 12.2 | 14.2 | 14.7 | 14.8 | 14.7 | 13.2 | 13.8 | 14.2 | 14.0 | 14.1 | |
| Mari El | 11.9 | 13.9 | 14.5 | 14.7 | 14.6 | 12.4 | 13.2 | 13.7 | 13.7 | 13.7 | |
| Udmurtia | 11.8 | 13.8 | 14.6 | 14.6 | 14.6 | 12.0 | 12.6 | 12.9 | 12.8 | 12.8 | |
| Bashkortostan | 12.1 | 13.7 | 14.5 | 14.9 | 14.6 | 12.4 | 12.8 | 13.3 | 13.2 | 13.2 | |
| Orenburg Oblast | 11.5 | 13.5 | 14.2 | 14.6 | 14.8 | 13.2 | 13.5 | 14.1 | 14.2 | 13.9 | |
| Chuvashia Republic | 11.3 | 13.3 | 13.8 | 13.9 | 14.0 | 12.6 | 13.1 | 13.1 | 13.3 | 13.2 | |
| Samara Oblast | 10.8 | 12.6 | 12.8 | 12.6 | 12.3 | 13.7 | 13.9 | 14.2 | 14.3 | 14.4 | |
| Kirov Oblast | 10.7 | 12.6 | 12.7 | 12.8 | 13.0 | 14.4 | 14.9 | 15.2 | 15.1 | 15.4 | |
| Nizhny Novgorod Oblast | 10.6 | 11.9 | 12.3 | 11.9 | 11.8 | 14.7 | 15.4 | 15.6 | 15.9 | 15.9 | |
| Ulyanovsk Oblast | 10.0 | 11.6 | 11.9 | 11.9 | 11.6 | 14.0 | 14.8 | 14.9 | 14.6 | 14.4 | |
| Saratov Oblast | 9.5 | 11.0 | 11.5 | 11.5 | 11.5 | 13.6 | 14.0 | 14.2 | 14.2 | 14.4 | |
| Penza Oblast | 8.9 | 10.2 | 10.7 | 10.9 | 10.7 | 14.1 | 14.5 | 14.9 | 14.8 | 14.8 | |
| Mordovia | 8.5 | 9.9 | 9.7 | 10.1 | 10.1 | 13.5 | 14.1 | 14.2 | 14.3 | 14.8 | |
| North-West Federal District | 11.1 | 12.5 | 12.5 | 12.3 | 12.2 | 12.8 | 13.2 | 13.4 | 13.3 | 13.5 | |
| Nenets Autonomous Okrug | 15.3 | 18.3 | 17.5 | 16.6 | 16.6 | 8.5 | 8.8 | 9.3 | 8.9 | 10.7 | |
| Saint Petersburg | 12.6 | 13.9 | 13.6 | 13.1 | 12.8 | 11.5 | 11.7 | 11.9 | 11.7 | 12.0 | |
| Komi Republic | 11.5 | 13.1 | 13.6 | 14.1 | 14.2 | 11.7 | 12.3 | 12.3 | 12.2 | 11.9 | |
| Vologda Oblast | 11.4 | 13.3 | 13.8 | 13.6 | 13.8 | 14.4 | 15.0 | 14.8 | 14.8 | 15.1 | |
| Kaliningrad Oblast | 11.1 | 12.5 | 12.8 | 12.7 | 12.5 | 12.5 | 12.6 | 13.3 | 13.3 | 13.2 | |
| Arkhangelsk Oblast | 10.6 | 12.0 | 12.4 | 12.6 | 12.7 | 12.9 | 13.5 | 13.4 | 13.2 | 13.4 | |
| Republic of Karelia | 10.3 | 11.9 | 12.2 | 12.4 | 12.0 | 14.5 | 14.8 | 15.3 | 14.6 | 14.7 | |
| Murmansk Oblast | 10.3 | 11.2 | 11.9 | 11.8 | 11.8 | 11.0 | 11.5 | 11.5 | 11.4 | 11.0 | |
| Novgorod Oblast | 10.2 | 11.8 | 11.9 | 11.8 | 12.0 | 17.1 | 17.4 | 17.6 | 17.3 | 17.8 | |
| Pskov Oblast | 9.5 | 11.1 | 11.1 | 10.9 | 11.0 | 17.4 | 17.9 | 18.2 | 18.5 | 18.6 | |
| Leningrad Oblast | 8.4 | 9.2 | 9.1 | 9.1 | 9.0 | 13.4 | 14.0 | 14.1 | 14.6 | 14.6 | |
| Southern Federal District | 11.1 | 12.4 | 12.8 | 12.9 | 12.6 | 13.0 | 13.5 | 13.6 | 13.4 | 13.2 | |
| Astrakhan Oblast | 12.1 | 14.0 | 14.5 | 15.0 | 14.8 | 11.4 | 12.0 | 12.3 | 12.7 | 12.3 | |
| Krasnodar Krai | 12.0 | 13.4 | 13.6 | 13.6 | 13.2 | 12.5 | 12.9 | 13.1 | 13.0 | 12.9 | |
| Sevastopol | 11.3 | 13.0 | 13.7 | 12.7 | 11.7 | 13.3 | 14.1 | 15.2 | 14.4 | 14.0 | |
| Republic of Crimea | 11.0 | 12.1 | 12.7 | 12.4 | 12.3 | 14.4 | 15.2 | 15.4 | 14.7 | 13.8 | |
| Kalmykia | 10.9 | 12.5 | 13.6 | 14.1 | 14.5 | 9.9 | 9.7 | 9.8 | 9.9 | 9.9 | |
| Adygea | 10.6 | 12.1 | 12.5 | 12.8 | 12.7 | 12.7 | 12.9 | 13.0 | 13.3 | 13.2 | |
| Rostov Oblast | 10.3 | 11.6 | 12.1 | 12.2 | 11.7 | 13.4 | 13.9 | 13.9 | 14.1 | 13.8 | |
| Volgograd Oblast | 9.9 | 11.2 | 11.5 | 11.5 | 11.6 | 13.1 | 13.6 | 13.8 | 13.7 | 13.5 | |
| Central Federal District | 10.5 | 11.7 | 11.8 | 11.5 | 11.4 | 12.9 | 13.5 | 13.5 | 13.7 | 13.7 | |
| Moscow Oblast | 12.0 | 13.2 | 13.1 | 12.6 | 12.1 | 12.4 | 13.1 | 13.0 | 13.9 | 14.1 | |
| Kaluga Oblast | 10.8 | 12.2 | 12.7 | 11.8 | 11.8 | 14.8 | 15.1 | 15.1 | 15.3 | 15.3 | |
| City of Moscow | 10.8 | 11.8 | 11.7 | 11.4 | 11.3 | 9.6 | 10.0 | 10.0 | 9.7 | 9.7 | |
| Kostroma Oblast | 10.7 | 12.0 | 12.5 | 12.6 | 12.7 | 14.8 | 15.6 | 16.0 | 15.9 | 16.2 | |
| Yaroslavl Oblast | 10.5 | 12.1 | 12.2 | 12.0 | 12.1 | 15.2 | 15.7 | 15.6 | 15.6 | 15.9 | |
| Lipetsk Oblast | 10.0 | 11.4 | 11.7 | 11.6 | 11.4 | 14.7 | 15.2 | 15.4 | 15.4 | 15.3 | |
| Tver Oblast | 9.9 | 11.2 | 11.3 | 11.2 | 11.4 | 16.9 | 17.6 | 17.7 | 17.8 | 18.1 | |
| Ryazan Oblast | 9.8 | 11.4 | 11.2 | 11.0 | 10.8 | 15.3 | 15.9 | 15.9 | 16.1 | 15.8 | |
| Belgorod Oblast | 9.8 | 11.2 | 11.6 | 11.6 | 11.6 | 13.5 | 13.9 | 14.0 | 14.0 | 13.9 | |
| Vladimir Oblast | 9.7 | 11.2 | 11.6 | 11.2 | 11.1 | 15.7 | 16.4 | 16.5 | 16.5 | 16.7 | |
| Ivanovo Oblast | 9.7 | 10.9 | 11.4 | 11.2 | 11.2 | 15.8 | 16.0 | 16.1 | 16.4 | 16.4 | |
| Kursk Oblast | 9.6 | 11.1 | 11.7 | 11.8 | 11.7 | 15.5 | 16.1 | 16.3 | 16.6 | 16.3 | |
| Voronezh Oblast | 9.6 | 10.7 | 11.1 | 10.9 | 10.7 | 14.7 | 15.2 | 15.4 | 15.7 | 15.7 | |
| Oryol Oblast | 9.5 | 11.0 | 11.2 | 11.0 | 11.1 | 15.7 | 16.3 | 16.4 | 16.4 | 16.3 | |
| Bryansk Oblast | 9.5 | 10.9 | 11.4 | 11.0 | 11.1 | 15.3 | 15.6 | 15.8 | 16.0 | 15.9 | |
| Smolensk Oblast | 9.1 | 10.3 | 10.6 | 10.8 | 10.6 | 15.6 | 16.1 | 16.4 | 16.1 | 16.5 | |
| Tula Oblast | 9.0 | 10.2 | 10.5 | 10.0 | 9.9 | 16.5 | 17.0 | 17.1 | 17.1 | 17.4 | |
| Tambov Oblast | 8.6 | 9.6 | 9.8 | 9.8 | 9.6 | 15.2 | 15.8 | 16.0 | 16.3 | 16.1 |
Net migration rate
- 2.24 migrant(s)/1,000 population (2011)[80]
Health
Life expectancy
Further information: List of federal subjects of Russia by life expectancy
total population: 72.5 years
male: 67.5 years
female: 77.4 years
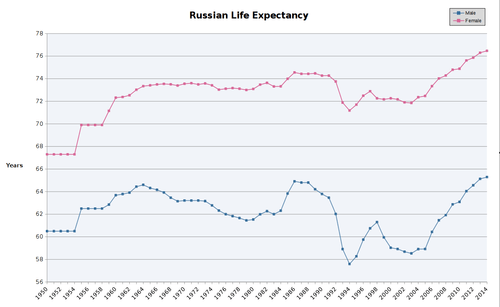
The disparity in the average lifespan between genders in Russia is the largest in the world. Women live 9–12 years longer than men, while the difference in lifespan is typically only five years in other parts of the world. David Stuckler, Lawrence King, and Martin McKee propose mass privatization and the neo-liberalist shock therapy policies of Yeltsin administration as key reasons of falling life expectancy of Russian men.[31] As of 2011, the average life expectancy in Russia was 64.3 years for males and 76.1 years for females.[83] According to the WHO 2011 report,[84] annual per capita alcohol consumption in Russia is about 15.76 litres, fourth highest volume in Europe (compare to 13.37 in the UK, 13.66 in France, 15.6 in Ukraine, 16.45 in the Czech Republic, etc.).
In the late 1950s, the USSR claimed a higher life expectancy than the United States,[85] but the Soviet Union has lagged behind Western countries in terms of mortality and life expectancy since the late 1960s.
When controlling for confounding variables, neither alcoholism, poverty, pollution, nor the collapse of the health system explain the high male mortality. Most former communist countries got through the same economic collapse and health system collapse. Alcohol consumption per capita is as high in other East European countries. Poverty is high in many other countries. One factor that could explain the low male lifespan in Russia is violence, tolerance for violence and tolerance for risk, "male toughness". Violence, tolerance for risk together with alcoholism reduce the Russian male lifespan.
The life expectancy was about 70 in 1986,[86] prior to the transition-induced disruption of the healthcare system. The turmoil in the early 1990s caused life expectancy in Russia to steadily decrease while it was steadily increasing in the rest of the world. Recently however, Russian life expectancy has again begun to rise. Between 2006—2011 the male life expectancy in Russia rose by almost four years, increasing the overall life expectancy by nearly 4 years to 70.3.[83]
Mortality
In 2012, 1,043,292, or 55% of all deaths in Russia were caused by cardiovascular disease. The second leading cause of death was cancer, which claimed 287,840 lives (15.2%). External causes of death such as suicide (1.5%), road accidents (1.5%), murders (0.8%), accidental alcohol poisoning (0.4%), and accidental drowning (0.5%), claimed 202,175 lives in total (10.6%). Other major causes of death were diseases of the digestive system (4.6%), respiratory disease (3.6%), infectious and parasitic diseases (1.6%), and tuberculosis (0.9%).[59] The infant mortality rate in 2012 was 7.6 deaths per 1,000 (down from 8.2 in 2009 and 16.9 in 1999).[59]
Under-five mortality rate
- 7.7 deaths/1000 live births (2016)[87]
Abortions and family planning
In the 1980s only 8% to 10% of married Russian women of reproductive age used hormonal and intrauterine contraception methods, compared to 20% to 40% in other developed countries.[88] This led to much higher abortion rates in Russia compared to other developed countries: in the 1980s Russia had a figure of 120 abortions per 1,000 women of reproductive age compared with only 20 per 1,000 in Western countries. However, after the dissolution of the Soviet Union in 1991 many changes took place, such as the demonopolization of the market for contraceptive drugs and media liberalization, which led to a rapid conversion to more efficient pregnancy-control practices. Abortion rates fell in the first half of the 1990s for the first time in Russia's history, even despite declining fertility rates. From the early 1990s to 2006, the number of expected abortions per woman during her lifetime fell by nearly 2.5 times, from 3.4 to 1.2. As of 2004, the share of women of reproductive age using hormonal or intrauterine birth control methods was about 46% (29% intrauterine, 17% hormonal).[89]
Despite an increase in "family planning", a large portion of Russian families do not achieve the target of desired children at the desired time. According to a 2004 study, current pregnancies were termed "desired and timely" by 58% of respondents, while 23% described them as "desired, but untimely", and 19% said they were "undesired". The share of unexpected pregnancies remains much lower in countries with developed family planning culture, such as the Netherlands, whose percentage of unwanted pregnancies 20 years before was half of that in Russia as of 2008.[89]
Ethnic groups
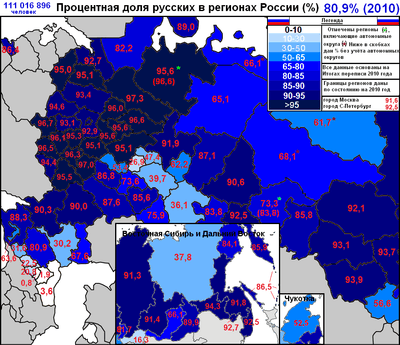
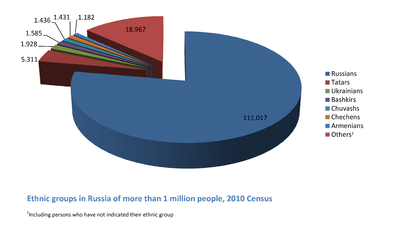
The Russian Federation is home to as many as 160 different ethnic groups and indigenous peoples. As of the 2010 census, 80.90% of the population that disclosed their ethnicity (111,016,896 people) is ethnically Russian, followed by (groups larger than one million):[90]
- 1.40% Ukrainians (1,927,988)[lower-alpha 1]
- 4.1% (5,864,000) settled, refugee or working plus temporaneous or permanent settlement.
- 3.77% Tatars (5,310,649)
- 1.15% Bashkirs (1,584,554)
- 1.05% Chuvashs (1,435,872)
- 1.04% Chechens (1,431,360)
- 0.86% Armenians (1,182,388)
According to the 2010 Census in Russia lived 142,856,536 people. It is important to note that 5,629,429 people (3.94% of the overall population.) did not declare any ethnic origin, compared to about 1 million in the 2002 Census. This is due to the fact that those people were counted from administrative databases and not directly, and were therefore unable to state their ethnicity.[91] Therefore, the percentages mentioned above are taken from the total population that declared their ethnicity, given that the non-declared remainder is thought to have an ethnic composition similar to the declared segment.[92]
Most smaller groups live compactly in their respective regions and can be categorized by language group. The ethnic divisions used here are those of the official census, and may in some respects be controversial. The following lists all ethnicities resolved by the 2010 census, grouped by language:
|
|
|
|
Historical perspective

The ethno-demographic structure of Russia has gradually changed over time. During the past century the most striking change is the fast increase of the peoples from the Caucasus. In 1926, these people composed 2% of the Russian population, compared to 6.5% in 2010. Though low in absolute numbers, the Siberian people also increased during the past century, but their growth was mainly realized after WW II (from 0.7% in 1959 to 1.2% in 2010) and not applicable to most of the small peoples (less than 10,000 people).
Peoples of European Russia
The relative proportion of the peoples of European Russia gradually decreased during the past century, but still compose 91% of the total population of Russia in 2010. The absolute numbers of most of these peoples reached its highest level in the beginning of the 1990s. Since 1992, natural growth in Russia has been negative and the numbers of all peoples of European Russia were lower in 2010 than in 2002, the only exceptions being the Roma (due to high fertility rates) and the Gagauz (due to high levels of migration from Moldova to Russia).
Several peoples saw a much larger decrease than can be explained by the low fertility rates and high mortality rates in Russia during the past two decades. Emigration and assimilation contributed to the decrease in numbers of many peoples. Emigration was the most important factor for Germans, Jews and Baltic peoples (Estonians, Latvians, Lithuanians). The number of Germans halved between 1959 and 2010. Their main country of destination is Germany.
The number of Jews decreased by more than 80% between 1959 and 2010. In 1970, the Soviet Union had the third largest population of Jews in the world, (2,183,000 of whom 808,000 with residence in Russia), following only that of the United States and Israel. By 2010, due to Jewish emigration, their number fell as low as 158,000. A sizeable emigration of other minorities has been enduring, too. The main destinations of emigrants from Russia are the USA (Russians, Jews, Belarusians, Chechens, Meskhetian Turks, Ukrainians and others), Israel (Jews), Germany (Germans and Jews), Poland (Poles), Canada (Finns and Ukrainians), Finland (Finns), France (Jews and Armenians) and the United Kingdom (mainly rich Russians).
Assimilation (i.e., marrying Russians and having children of such unions counted as Russians) explains the decrease in numbers of Ukrainians, Belarusians and most of the Uralic peoples. The assimilation is reflected in the high median age of these peoples (see the table below), as assimilation is stronger among young people than among old people. The process of assimilation of the Uralic peoples of Russia is probably going on for centuries and is most prominent among the Mordvins (1.4% of the Russian population in 1926 and 0.5% in 2010), the Karelians, Veps and Izhorians.
Assimilation on the other hand slowed down the decrease of the number of ethnic Russians. Besides, the decrease of the number of Russians was also slowed down by the immigration of ethnic Russians from the former Soviet republics, especially Central Asia. Similarly, the numbers of Ukrainians, Belarusians, Germans, Jews, and other non-autochthonous ethnic groups has also been decreased by emigration to Ukraine, Belarus, Germany, Israel, and so forth, respectively.
Peoples of European Russia in the Russian Federation, 1926–2010
| Ethnic group |
Language family |
1926 Census | 1939 Census | 1959 Census | 1970 Census | 1979 Census | 1989 Census | 2002 Census | 2010 Census | ||||||||
|---|---|---|---|---|---|---|---|---|---|---|---|---|---|---|---|---|---|
| Number | % | Number | % | Number | % | Number | % | Number | % | Number | % | Number | % | Number | % | ||
| Russians | Indo-European | 72,374,283 | 78.1% | 89,747,795 | 82.9% | 97,863,579 | 83.3% | 107,747,630 | 82.8% | 113,521,881 | 82.6% | 119,865,469 | 81.5% | 115,889,107 | 80.6% | 111,016,896 | 80.9% |
| Tatars | Turkic | 2,926,053 | 3.2% | 3,682,956 | 3.4% | 4,074,253 | 3.5% | 4,577,061 | 3.5% | 5,055,757 | 3.6% | 5,522,096 | 3.8% | 5,554,601 | 3.9% | 5,310,649 | 3.9% |
| Ukrainians | Indo-European | 6,870,976 | 7.4% | 3,205,061 | 3.0% | 3,359,083 | 2.9% | 3,345,885 | 2.6% | 3,657,647 | 2.7% | 4,362,872 | 3.0% | 2,942,961 | 2.0% | 1,927,888 | 1.4% |
| Bashkirs | Turkic | 738,861 | 0.80% | 824,537 | 0.76% | 953,801 | 0.81% | 1,180,913 | 0.91% | 1,290,994 | 0.94% | 1,345,273 | 0.92% | 1,673,389 | 1.16% | 1,584,554 | 1.15% |
| Chuvashs | Turkic | 1,112,478 | 1.20% | 1,346,232 | 1.24% | 1,436,218 | 1.22% | 1,637,028 | 1.26% | 1,689,847 | 1.23% | 1,773,645 | 1.21% | 1,637,094 | 1.14% | 1,435,872 | 1.05% |
| Mordvins | Uralic | 1,306,798 | 1.41% | 1,375,558 | 1.27% | 1,211,105 | 1.03% | 1,177,492 | 0.91% | 1,111,075 | 0.81% | 1,072,939 | 0.73% | 843,350 | 0.59% | 744,237 | 0.54% |
| Udmurts (incl. Besermyan 1939–1989) | Uralic | 503,970 | 0.54% | 599,893 | 0.55% | 615,640 | 0.52% | 678,393 | 0.52% | 685,718 | 0.50% | 714,883 | 0.49% | 636,906 | 0.45% | 552,299 | 0.40% |
| Besermyan | Uralic | 10,035 | 0.01% | 3,122 | 0.00% | 2,201 | 0.00% | ||||||||||
| Mari | Uralic | 427,874 | 0.46% | 476,314 | 0.44% | 498,066 | 0.42% | 581,082 | 0.45% | 599,637 | 0.44% | 643,698 | 0.44% | 604,298 | 0.42% | 547,605 | 0.40% |
| Belarusians | Indo-European | 607,845 | 0.66% | 451,933 | 0.42% | 843,985 | 0.72% | 964,082 | 0.74% | 1,051,900 | 0.77% | 1,206,222 | 0.82% | 807,970 | 0.56% | 521,443 | 0.38% |
| Germans | Indo-European | 707,277 | 0.76% | 811,205 | 0.75% | 820,016 | 0.70% | 761,888 | 0.59% | 790,762 | 0.58% | 842,295 | 0.57% | 597,212 | 0.42% | 394,138 | 0.29% |
| Komi (incl. Komi-Permyak 1939) | Uralic | 226,012 | 0.24% | 415,009 | 0.38% | 281,780 | 0.24% | 315,347 | 0.24% | 320,078 | 0.23% | 336,309 | 0.23% | 293,406 | 0.20% | 228,235 | 0.17% |
| Komi-Permyak | Uralic | 149,275 | 0.16% | 143,030 | 0.12% | 150,244 | 0.12% | 145,993 | 0.11% | 147,269 | 0.10% | 125,235 | 0.09% | 94,456 | 0.07% | ||
| Roma | Indo-European | 39,089 | 0.04% | 59,198 | 0.05% | 72,488 | 0.06% | 97,955 | 0.08% | 120,672 | 0.09% | 152,939 | 0.10% | 183,252 | 0.13% | 204,958 | 0.15% |
| Jews | Semitic | 539,086 | 0.58% | 891,147 | 0.82% | 875,058 | 0.74% | 807,526 | 0.62% | 699,286 | 0.51% | 550,709 | 0.37% | 233,439 | 0.16% | 156,801 | 0.11% |
| Moldovans | Indo-European | 16,870 | 0.02% | 21,974 | 0.02% | 62,298 | 0.05% | 87,538 | 0.07% | 102,137 | 0.07% | 172,671 | 0.12% | 172,330 | 0.12% | 156,400 | 0.11% |
| Karelians | Uralic | 248,017 | 0.27% | 249,778 | 0.23% | 164,050 | 0.14% | 141,148 | 0.11% | 133,182 | 0.10% | 124,921 | 0.08% | 93,344 | 0.06% | 60,815 | 0.04% |
| Poles | Indo-European | 189,269 | 0.20% | 142,461 | 0.13% | 118,422 | 0.10% | 107,084 | 0.08% | 99,733 | 0.07% | 94,594 | 0.06% | 73,001 | 0.05% | 47,125 | 0.03% |
| Lithuanians | Indo-European | 26,128 | 0.03% | 20,795 | 0.02% | 108,579 | 0.09% | 76,718 | 0.06% | 66,783 | 0.05% | 70,427 | 0.05% | 45,569 | 0.03% | 31,377 | 0.02% |
| Bulgarians | Indo-European | 4,087 | 0.00% | 8,338 | 0.01% | 24,899 | 0.02% | 27,321 | 0.02% | 24,943 | 0.02% | 32,785 | 0.02% | 31,965 | 0.02% | 24,038 | 0.02% |
| Finns | Uralic | 134,089 | 0.14% | 138,962 | 0.13% | 72,356 | 0.06% | 62,307 | 0.05% | 55,687 | 0.04% | 47,102 | 0.03% | 34,050 | 0.02% | 20,267 | 0.01% |
| Latvians | Indo-European | 124,312 | 0.13% | 104,877 | 0.10% | 74,932 | 0.06% | 59,695 | 0.05% | 67,267 | 0.05% | 46,829 | 0.03% | 28,520 | 0.02% | 18,979 | 0.01% |
| Estonians | Uralic | 146,051 | 0.16% | 130,494 | 0.12% | 78,556 | 0.07% | 62,980 | 0.05% | 55,539 | 0.04% | 46,390 | 0.03% | 28,113 | 0.02% | 17,875 | 0.01% |
| Gagauz | Turkic | 0 | 0.00% | 0 | 0.00% | 3,012 | 0.00% | 3,704 | 0.00% | 4,176 | 0.00% | 10,051 | 0.01% | 12,210 | 0.01% | 13,690 | 0.01% |
| Veps | Uralic | 32,783 | 0.04% | 31,442 | 0.03% | 16,170 | 0.01% | 8,057 | 0.01% | 7,550 | 0.01% | 12,142 | 0.01% | 8,240 | 0.01% | 5,936 | 0.00% |
| Sami | Uralic | 1,715 | 0.00% | 1,828 | 0.00% | 1,760 | 0.00% | 1,836 | 0.00% | 1,775 | 0.00% | 1,835 | 0.00% | 1,991 | 0.00% | 1,771 | 0.00% |
| Izhorians | Uralic | 16,136 | 0.02% | 7,720 | 0.01% | 564 | 0.00% | 561 | 0.00% | 449 | 0.00% | 449 | 0.00% | 327 | 0.00% | 266 | 0.00% |
| Karaites | Turkic | 1,608 | 0.00% | 1,608 | 0.00% | 1,236 | 0.00% | 939 | 0.00% | 680 | 0.00% | 366 | 0.00% | 205 | 0.00% | ||
Peoples of the Caucasus
Peoples of the Caucasus in the Russian Federation, 1926–2010
| Ethnic group |
Language family |
1926 Census | 1939 Census | 1959 Census | 1970 Census | 1979 Census | 1989 Census | 2002 Census | 2010 Census | ||||||||
|---|---|---|---|---|---|---|---|---|---|---|---|---|---|---|---|---|---|
| Number | % | Number | % | Number | % | Number | % | Number | % | Number | % | Number | % | Number | % | ||
| Chechens | Northeast Caucasian | 318,361 | 0.34% | 400,325 | 0.37% | 261,311 | 0.22% | 572,220 | 0.44% | 712,161 | 0.52% | 898,999 | 0.61% | 1,360,253 | 0.95% | 1,431,360 | 1.04% |
| Armenians | Indo-European | 183,785 | 0.20% | 205,233 | 0.19% | 255,978 | 0.22% | 298,718 | 0.23% | 364,570 | 0.27% | 532,390 | 0.36% | 1,132,033 | 0.79% | 1,182,388 | 0.86% |
| Avars | Northeast Caucasian | 178,263 | 0.19% | 235,715 | 0.22% | 249,529 | 0.21% | 361,613 | 0.28% | 438,306 | 0.32% | 544,016 | 0.37% | 814,473 | 0.57% | 912,090 | 0.66% |
| Azerbaijanis | Turkic | 24,335 | 0.03% | 43,014 | 0.04% | 70,947 | 0.06% | 95,689 | 0.07% | 152,421 | 0.11% | 335,889 | 0.23% | 621,840 | 0.43% | 603,070 | 0.44% |
| Dargins | Northeast Caucasian | 125,759 | 0.14% | 152,007 | 0.14% | 152,563 | 0.13% | 224,172 | 0.17% | 280,444 | 0.20% | 353,348 | 0.24% | 510,156 | 0.35% | 589,386 | 0.43% |
| Ossetians | Indo-European | 157,280 | 0.17% | 195,624 | 0.18% | 247,834 | 0.21% | 313,458 | 0.24% | 352,080 | 0.26% | 402,275 | 0.27% | 514,875 | 0.36% | 528,515 | 0.38% |
| Kabardins | Northwest Caucasian | 139,864 | 0.15% | 161,216 | 0.15% | 200,634 | 0.17% | 277,435 | 0.21% | 318,822 | 0.23% | 386,055 | 0.26% | 519,958 | 0.36% | 516,826 | 0.38% |
| Kumyks | Turkic | 94,509 | 0.10% | 110,299 | 0.10% | 132,896 | 0.11% | 186,690 | 0.14% | 225,800 | 0.16% | 277,163 | 0.19% | 422,409 | 0.29% | 503,060 | 0.37% |
| Lezgians | Northeast Caucasian | 92,937 | 0.10% | 100,328 | 0.09% | 114,210 | 0.10% | 170,494 | 0.13% | 202,854 | 0.15% | 257,270 | 0.17% | 411,535 | 0.29% | 473,722 | 0.34% |
| Ingush | Northeast Caucasian | 72,137 | 0.08% | 90,980 | 0.08% | 55,799 | 0.05% | 137,380 | 0.11% | 165,997 | 0.12% | 215,068 | 0.15% | 413,016 | 0.29% | 444,833 | 0.32% |
| Karachays | Turkic | 55,116 | 0.06% | 74,488 | 0.07% | 70,537 | 0.06% | 106,831 | 0.08% | 125,792 | 0.09% | 150,332 | 0.10% | 192,182 | 0.13% | 218,403 | 0.16% |
| Kalmyks | Mongolic | 128,809 | 0.14% | 129,786 | 0.12% | 100,603 | 0.09% | 131,318 | 0.10% | 140,103 | 0.10% | 165,103 | 0.11% | 174,000 | 0.12% | 183,372 | 0.13% |
| Laks | Northeast Caucasian | 40,243 | 0.04% | 54,348 | 0.05% | 58,397 | 0.05% | 78,625 | 0.06% | 91,412 | 0.07% | 106,245 | 0.07% | 156,545 | 0.11% | 178,630 | 0.13% |
| Georgians | Kartvelian | 20,551 | 0.02% | 43,585 | 0.04% | 57,594 | 0.05% | 68,971 | 0.05% | 89,407 | 0.07% | 130,688 | 0.09% | 197,934 | 0.14% | 157,803 | 0.11% |
| Tabasarans | Northeast Caucasian | 31,983 | 0.03% | 33,471 | 0.03% | 34,288 | 0.03% | 54,047 | 0.04% | 73,433 | 0.05% | 93,587 | 0.06% | 131,785 | 0.09% | 146,360 | 0.11% |
| Adyghe (incl. Shapsugs 1926–1989 and Circassians 1926–1939) | Northwest Caucasian | 64,959 | 0.07% | 85,588 | 0.08% | 78,561 | 0.07% | 98,461 | 0.08% | 107,239 | 0.08% | 122,908 | 0.08% | 128,528 | 0.09% | 124,835 | 0.09% |
| Shapsugs | Northwest Caucasian | 3,231 | 0.00% | 3,882 | 0.00% | ||||||||||||
| Circassians | Northwest Caucasian | 28,986 | 0.02% | 38,356 | 0.03% | 44,572 | 0.03% | 50,572 | 0.03% | 60,517 | 0.04% | 73,184 | 0.05% | ||||
| Balkars | Turkic | 33,298 | 0.04% | 41,949 | 0.04% | 35,249 | 0.03% | 52,969 | 0.04% | 61,828 | 0.04% | 78,341 | 0.05% | 108,426 | 0.08% | 112,924 | 0.08% |
| Turks (incl. Meskhetian Turks 1926–1989) | Turkic | 1,846 | 0.00% | 2,668 | 0.00% | 1,377 | 0.00% | 1,568 | 0.00% | 3,561 | 0.00% | 9,890 | 0.01% | 92,415 | 0.06% | 105,058 | 0.08% |
| Meskhetian Turks | Turkic | 3,527 | 0.00% | 4,825 | 0.00% | ||||||||||||
| Nogais | Turkic | 36,089 | 0.04% | 36,088 | 0.03% | 37,656 | 0.03% | 51,159 | 0.04% | 58,639 | 0.04% | 73,703 | 0.05% | 90,666 | 0.06% | 103,660 | 0.08% |
| Greeks | Indo-European | 34,439 | 0.04% | 65,705 | 0.06% | 47,024 | 0.04% | 57,847 | 0.04% | 69,816 | 0.05% | 91,699 | 0.06% | 97,827 | 0.07% | 85,640 | 0.06% |
| Kurds (incl. Yazidis 1939–1989) | Indo-European | 164 | 0.00% | 387 | 0.00% | 855 | 0.00% | 1,015 | 0.00% | 1,634 | 0.00% | 4,724 | 0.00% | 19,607 | 0.01% | 23,232 | 0.01% |
| Yazidis | Indo-European | 1 | 0.00% | 31,273 | 0.02% | 40,586 | 0.03% | ||||||||||
| Abazas | Northwest Caucasian | 13,825 | 0.01% | 14,739 | 0.01% | 19,059 | 0.02% | 24,892 | 0.02% | 28,800 | 0.02% | 32,983 | 0.02% | 37,942 | 0.03% | 43,341 | 0.03% |
| Small Dagestan Peoples (SDP) | 20,962 | 0.02% | |||||||||||||||
| Rutuls | Northeast Caucasian | 10,333 | 0.01% | SDP | SDP | 6,703 | 0.01% | 11,904 | 0.01% | 14,835 | 0.01% | 19,503 | 0.01% | 29,929 | 0.02% | 35,240 | 0.03% |
| Aghuls | Northeast Caucasian | 7,653 | 0.01% | SDP | SDP | 6,460 | 0.01% | 8,751 | 0.01% | 11,752 | 0.01% | 17,728 | 0.01% | 28,297 | 0.02% | 34,160 | 0.02% |
| Tsakhurs | Northeast Caucasian | 3,533 | 0.00% | SDP | SDP | 4,437 | 0.00% | 4,730 | 0.00% | 4,774 | 0.00% | 6,492 | 0.00% | 10,366 | 0.01% | 12,769 | 0.01% |
| Udis | Northeast Caucasian | 2 | 0.00% | SDP | SDP | 35 | 0.00% | 94 | 0.00% | 216 | 0.00% | 1,102 | 0.00% | 3,721 | 0.00% | 4,267 | 0.00% |
| Abkhaz | Northwest Caucasian | 97 | 0.00% | 647 | 0.00% | 1,400 | 0.00% | 2,427 | 0.00% | 4,058 | 0.00% | 7,239 | 0.00% | 11,366 | 0.01% | 11,249 | 0.01% |
| Assyrians | Semitic | 2,791 | 0.00% | 7,446 | 0.01% | 7,612 | 0.01% | 8,098 | 0.01% | 8,708 | 0.01% | 9,622 | 0.01% | 13,649 | 0.01% | 11,084 | 0.01% |
| Persians | Indo-European | 8,626 | 0.01% | 6,041 | 0.01% | 2,490 | 0.00% | 2,548 | 0.00% | 1,747 | 0.00% | 2,572 | 0.00% | 3,821 | 0.00% | 3,696 | 0.00% |
| Talysh | Indo-European | 0 | 0.00% | 47 | 0.00% | 33 | 0.00% | 2 | 0.00% | 202 | 0.00% | 2,548 | 0.00% | 2,529 | 0.00% | ||
| Tats | Indo-European | 223 | 0.00% | 5,136 | 0.00% | 8,753 | 0.01% | 12,748 | 0.01% | 19,420 | 0.01% | 2,303 | 0.00% | 1,585 | 0.00% | ||
Peoples of Siberia
Peoples of Siberia in the Russian Federation, 1926–2010
| Ethnic group |
Language family |
1926 Census | 1939 Census | 1959 Census | 1970 Census | 1979 Census | 1989 Census | 2002 Census | 2010 Census | ||||||||
|---|---|---|---|---|---|---|---|---|---|---|---|---|---|---|---|---|---|
| Number | % | Number | % | Number | % | Number | % | Number | % | Number | % | Number | % | Number | % | ||
| Sakha (icl. Dolgans 1939–1959) | Turkic | 240,682 | 0.26% | 241,870 | 0.22% | 236,125 | 0.20% | 295,223 | 0.23% | 326,531 | 0.24% | 380,242 | 0.26% | 443,852 | 0.31% | 478,085 | 0.35% |
| Dolgans | Turkic | 656 | 0.00% | 4,718 | 0.00% | 4,911 | 0.00% | 6,584 | 0.00% | 7,261 | 0.01% | 7,885 | 0.01% | ||||
| Buryats (incl. Soyots 1939–1989) | Mongolic | 237,490 | 0.26% | 220,618 | 0.20% | 251,504 | 0.21% | 312,847 | 0.24% | 349,760 | 0.25% | 417,425 | 0.28% | 445,175 | 0.31% | 461,389 | 0.34% |
| Soyots | Mongolic | 229 | 0.00% | 2,769 | 0.00% | 3,608 | 0.00% | ||||||||||
| Tuvans | Turkic | 200 | 0.00% | 794 | 0.00% | 99,864 | 0.08% | 139,013 | 0.11% | 165,426 | 0.12% | 206,160 | 0.14% | 243,442 | 0.17% | 263,934 | 0.19% |
| Altay | Turkic | 52,248 | 0.06% | 46,489 | 0.04% | 44,654 | 0.04% | 54,614 | 0.04% | 58,879 | 0.04% | 69,409 | 0.05% | 77,822 | 0.05% | 89,773 | 0.06% |
| Khakas | Turkic | 45,607 | 0.05% | 52,033 | 0.05% | 56,032 | 0.05% | 65,368 | 0.05% | 69,247 | 0.05% | 78,500 | 0.05% | 76,278 | 0.05% | 72,959 | 0.05% |
| Nenets (incl. Enets 1926–1979 and Nganasans 1926–1939) | Uralic | 17,560 | 0.02% | 24,716 | 0.02% | 22,845 | 0.02% | 28,487 | 0.02% | 29,487 | 0.02% | 34,190 | 0.02% | 41,302 | 0.03% | 44,640 | 0.03% |
| Enets | Uralic | 198 | 0.00% | 237 | 0.00% | 227 | 0.00% | ||||||||||
| Nganasans | Uralic | 721 | 0.00% | 823 | 0.00% | 842 | 0.00% | 1,262 | 0.00% | 834 | 0.00% | 862 | 0.00% | ||||
| Evenks | Tungusic | 38,804 | 0.03% | 29,599 | 0.02% | 24,583 | 0.02% | 25,051 | 0.02% | 27,278 | 0.02% | 29,901 | 0.02% | 35,527 | 0.02% | 37,843 | 0.03% |
| Khanty | Uralic | 22,301 | 0.02% | 18,447 | 0.02% | 19,246 | 0.02% | 21,007 | 0.02% | 20,743 | 0.02% | 22,283 | 0.02% | 28,678 | 0.02% | 30,943 | 0.02% |
| Evens | Tungusic | 2,044 | 0.00% | 9,674 | 0.01% | 9,023 | 0.01% | 11,819 | 0.01% | 12,215 | 0.01% | 17,055 | 0.01% | 19,071 | 0.01% | 22,383 | 0.02% |
| Chukchi (incl. Kereks 1926–1989 and Chuvans 1939–1979) | Chukotko-Kamchatkan | 12,331 | 0.01% | 13,830 | 0.01% | 11,680 | 0.01% | 13,500 | 0.01% | 13,937 | 0.01% | 15,107 | 0.01% | 15,767 | 0.01% | 15,908 | 0.01% |
| Kereks | Chukotko-Kamchatkan | 8 | 0.00% | 4 | 0.00% | ||||||||||||
| Chuvans | Chukotko-Kamchatkan | 704 | 0.00% | 1,384 | 0.00% | 1,087 | 0.00% | 1,002 | 0.00% | ||||||||
| Shors | Turkic | 13,000 | 0.01% | 16,042 | 0.01% | 14,938 | 0.01% | 15,950 | 0.01% | 15,182 | 0.01% | 15,745 | 0.01% | 13,975 | 0.01% | 12,888 | 0.01% |
| Mansi | Uralic | 5,754 | 0.01% | 6,295 | 0.01% | 6,318 | 0.01% | 7,609 | 0.01% | 7,434 | 0.01% | 8,279 | 0.01% | 11,432 | 0.01% | 12,269 | 0.01% |
| Nanais | Tungusic | 5,860 | 0.01% | 8,411 | 0.01% | 7,919 | 0.01% | 9,911 | 0.01% | 10,357 | 0.01% | 11,883 | 0.01% | 12,160 | 0.01% | 12,003 | 0.01% |
| Koryaks | Chukotko-Kamchatkan | 7,437 | 0.01% | 7,337 | 0.01% | 6,168 | 0.01% | 7,367 | 0.01% | 7,637 | 0.01% | 8,942 | 0.01% | 8,743 | 0.01% | 7,953 | 0.01% |
| Nivkh | Nivkh | 4,076 | 0.00% | 3,857 | 0.00% | 3,690 | 0.00% | 4,356 | 0.00% | 4,366 | 0.00% | 4,631 | 0.00% | 5,162 | 0.00% | 4,652 | 0.00% |
| Selkups | Uralic | 1,630 | 0.00% | 2,604 | 0.00% | 3,704 | 0.00% | 4,249 | 0.00% | 3,518 | 0.00% | 3,564 | 0.00% | 4,249 | 0.00% | 3,649 | 0.00% |
| Udege (incl. Taz 1926–1989) | Tungusic | 1,357 | 0.00% | 1,701 | 0.00% | 1,395 | 0.00% | 1,396 | 0.00% | 1,431 | 0.00% | 1,902 | 0.00% | 1,657 | 0.00% | 1,496 | 0.00% |
| Taz | Sino-Tibetan | 276 | 0.00% | 274 | 0.00% | ||||||||||||
| Small Siberian Peoples (SSP) | 11,824 | 0.01% | |||||||||||||||
| Itelmeni | Chukotko-Kamchatkan | 803 | 0.00% | SSP | SSP | 1,096 | 0.00% | 1,255 | 0.00% | 1,335 | 0.00% | 2,429 | 0.00% | 3,180 | 0.00% | 3,193 | 0.00% |
| Ulchs | Tungusic | 723 | 0.00% | SSP | SSP | 2,049 | 0.00% | 2,410 | 0.00% | 2,494 | 0.00% | 3,173 | 0.00% | 2,913 | 0.00% | 2,765 | 0.00% |
| Eskimo | Eskimo-Aleut | 1,292 | 0.00% | SSP | SSP | 1,111 | 0.00% | 1,265 | 0.00% | 1,460 | 0.00% | 1,704 | 0.00% | 1,750 | 0.00% | 1,738 | 0.00% |
| Yukaghir | Yukaghir | 443 | 0.00% | SSP | SSP | 440 | 0.00% | 593 | 0.00% | 801 | 0.00% | 1,112 | 0.00% | 1,509 | 0.00% | 1,603 | 0.00% |
| Ket | Yeniseian | 1,428 | 0.00% | SSP | SSP | 1,017 | 0.00% | 1,161 | 0.00% | 1,072 | 0.00% | 1,084 | 0.00% | 1,494 | 0.00% | 1,219 | 0.00% |
| Tofalars | Turkic | 2,828 | 0.00% | SSP | SSP | 476 | 0.00% | 570 | 0.00% | 576 | 0.00% | 722 | 0.00% | 837 | 0.00% | 762 | 0.00% |
| Orochs (incl. Oroks 1970–1979) | Tungusic | 646 | 0.00% | SSP | SSP | 779 | 0.00% | 1,037 | 0.00% | 1,040 | 0.00% | 883 | 0.00% | 686 | 0.00% | 596 | 0.00% |
| Oroks | Tungusic | 162 | 0.00% | SSP | SSP | 2 | 0.00% | 179 | 0.00% | 346 | 0.00% | 295 | 0.00% | ||||
| Negidals | Tungusic | 683 | 0.00% | SSP | SSP | 495 | 0.00% | 477 | 0.00% | 587 | 0.00% | 567 | 0.00% | 513 | 0.00% | ||
| Aleut | Eskimo-Aleut | 353 | 0.00% | SSP | SSP | 399 | 0.00% | 410 | 0.00% | 489 | 0.00% | 644 | 0.00% | 540 | 0.00% | 482 | 0.00% |
Foreign-born population
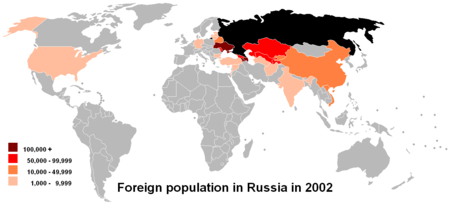
Russia experiences a constant flow of immigration. On average, close to 300,000 legal immigrants enter the country every year; about half are ethnic Russians from the other republics of the former Soviet Union. There is a significant inflow of ethnic Armenians, Uzbeks, Kyrgyz and Tajiks into big Russian cities, something that is viewed unfavorably by some citizens.[94] According to a 2013 opinion poll, 74% of Russians view the large number of labor migrants as a negative phenomenon.[95] According to the United Nations, Russia's legal immigrant population is the third biggest in the world, numbering 11.6 million.[96] In addition, there are an estimated 4 million illegal immigrants from the ex-Soviet states in Russia.[97] In 2015, Ukraine–Russia was the world's largest migration corridor after Mexico–USA.[98] According to the Armenian government, between 80,000 and 120,000 Armenians travel to Russia every year to do seasonal work, returning home for the winter.[99] According to the Tajik government, at least 870,000 Tajiks are working in Russia.[100] In 2014, remittances from Russia accounted for around one-third of Kyrgyzstan's and over 40% of Tajikistan's GDP.[101]
The Kazakhs in Russia are mostly not recent immigrants. The majority inhabit regions bordering Kazakhstan such as the Astrakhan (16% of the population are Kazakhs), Orenburg (6% of the population are Kazakhs), Omsk (4% of the population are Kazakhs) and Saratov (3% of the population are Kazakhs) oblasts. Together these oblasts host 60% of the Kazakh population in Russia. The number of Kazakhs slightly decreased between 2002 and 2010 due to emigration to Kazakhstan, which has by far the strongest economy in Central Asia (Russia does receive immigration from Kazakhstan, but they are mainly ethnic Russians); other Central Asian populations, especially Uzbeks, Tajiks, and Kyrgyz, have continued to rise rapidly. (Turkmen are an exception; citizens of Turkmenistan do not have visa-free access to Russia.)
Russian statistical organizations classify the immigrants based on their ethnicity, although there is an information gap between 2007 and 2013, In 2007, the net immigration was 190,397 (plus another 49,546 for which ethnicity was unknown). Of this, 97,813 was Slavic / Germanic / Finnic (51.4%, of which Russian – 72,769, Ukrainian – 17,802), Turkic and other Muslim – 52,536 (27.6%, of which Azeri – 14,084, Tatar – 10,391, Uzbek – 10,517, Tajik – 9,032, Kyrgyz – 7,533 & Kazakh – (-) 1,424) and Others – 40,048 (21.0%, of which Armenian – 25,719).[102]
Many immigrants are actually migrant workers, who come to Russia and work for around five years then return to their countries. Major sources of migrant workers but where permanent migrants of majority ethnicity of those countries are virtually nonexistent are in 2013. China 200,000 migrant workers, 1000 settled permanently. Uzbekistan 100,000 migrant workers, 489 permanent settlers. Tajikistan 80,000 migrant workers, 220 settled permanently. Kyrgyzstan 50,000 miagrant workers, 219 settled permanently. North Macedonia – 20,000 worker arrivals, 612 settled permanently.
Peoples of Central Asia in the Russian Federation, 1926–2010
| Ethnic group |
Language family |
1926 Census | 1939 Census | 1959 Census | 1970 Census | 1979 Census | 1989 Census | 2002 Census | 2010 Census | ||||||||
|---|---|---|---|---|---|---|---|---|---|---|---|---|---|---|---|---|---|
| Number | % | Number | % | Number | % | Number | % | Number | % | Number | % | Number | % | Number | % | ||
| Kazakhs | Turkic | 136,501 | 0.15% | 356,500 | 0.33% | 382,431 | 0.33% | 477,820 | 0.37% | 518,060 | 0.38% | 635,865 | 0.43% | 653,962 | 0.46% | 647,732 | 0.47% |
| Uzbeks | Turkic | 942 | 0.00% | 16,166 | 0.01% | 29,512 | 0.03% | 61,588 | 0.05% | 72,385 | 0.05% | 126,899 | 0.09% | 122,916 | 0.09% | 289,862 | 0.21% |
| Tajiks | Indo-European | 52 | 0.00% | 3,315 | 0.00% | 7,027 | 0.01% | 14,108 | 0.01% | 17,863 | 0.01% | 38,208 | 0.03% | 120,136 | 0.08% | 200,666 | 0.15% |
| Kyrgyz | Turkic | 285 | 0.00% | 6,311 | 0.01% | 4,701 | 0.00% | 9,107 | 0.01% | 15,011 | 0.01% | 41,734 | 0.03% | 31,808 | 0.02% | 103,422 | 0.08% |
| Turkmens | Turkic | 7,849 | 0.01% | 12,869 | 0.01% | 11,631 | 0.01% | 20,040 | 0.02% | 22,979 | 0.02% | 39,739 | 0.03% | 33,053 | 0.02% | 36,885 | 0.03% |
| Uygurs | Turkic | 26 | 0.00% | 642 | 0.00% | 720 | 0.00% | 1,513 | 0.00% | 1,707 | 0.00% | 2,577 | 0.00% | 2,867 | 0.00% | 3,696 | 0.00% |
| Karakalpaks | Turkic | 14 | 0.00% | 306 | 0.00% | 988 | 0.00% | 2,267 | 0.00% | 1,743 | 0.00% | 6,155 | 0.00% | 1,609 | 0.00% | 1,466 | 0.00% |
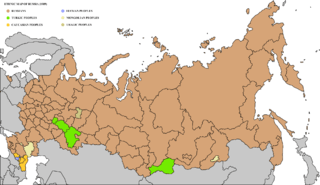 Ethnic map of Russia, 1989
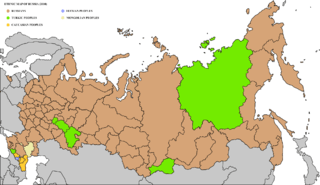 Ethnic map of Russia, 2010
The 2010 census found the following figures for foreign citizens resident in Russia:
![]()
![]()
![]()
![]()
![]()
![]()
![]()
![]()
![]()
![]()
![]()
![]()
![]()
![]()
![]()
![]()
![]()
![]()
Median age and fertility
Median ages of ethnic groups vary considerably between groups. Ethnic Russians and other Slavic and Finnic groups have higher median age compared to the Caucasian groups.
Median ages are strongly correlated with fertility rates, ethnic groups with higher fertility rates have lower median ages, and vice versa. For example, in 2002, in the ethnic group with the lowest median age – Ingush – women 35 or older had, on average, 4.05 children; in the ethnic group with the highest median age – Jews – women 35 or older averaged only 1.37 children.[103] Ethnic Jews have both the highest median age and the lowest fertility rate; this is a consequence of Jewish emigration.
Ethnic Russians represent a significant deviation from the pattern, with second lowest fertility rate of all major groups, but relatively low median age (37.6 years). This phenomenon is at least partly due to a high mortality rate among older people, especially males as well as the fact that children from mixed marriages are often registered as ethnic Russians in the census. The most noticeable trend in the past couple of decades is the convergence of birth rates between minorities (including Muslim minorities) and the Russian majority.
The following table shows the variation in median age and fertility rates according to 2002 census.[104]
| Ethnic group | Median age | Male | Female | Urban | Urban Male | Urban Female | Rural | Rural Male | Rural Female | Children per woman (15+) | Children per woman (35+) | Predominant religion |
|---|---|---|---|---|---|---|---|---|---|---|---|---|
| Russian | 37.6 | 34.0 | 40.5 | 37.1 | 33.5 | 40.1 | 39.0 | 35.7 | 41.7 | 1.446 | 1.828 | Christianity |
| Tatar | 37.7 | 35.3 | 39.6 | 37.2 | 34.7 | 39.1 | 38.8 | 36.5 | 41.1 | 1.711 | 2.204 | Islam |
| Ukrainian | 45.9 | 44.7 | 47.3 | 45.6 | 44.5 | 46.8 | 47.0 | 45.2 | 49.0 | 1.726 | 1.946 | Christianity |
| Bashkir | 34.2 | 32.1 | 36.2 | 32.9 | 30.6 | 34.7 | 35.4 | 33.3 | 37.6 | 1.969 | 2.658 | Islam |
| Chuvash | 38.6 | 36.4 | 40.4 | 37.9 | 36.3 | 39.1 | 39.4 | 36.5 | 42.5 | 1.884 | 2.379 | Christianity |
| Chechen | 22.8 | 22.1 | 23.5 | 22.9 | 22.5 | 23.4 | 22.7 | 21.9 | 23.5 | 2.163 | 3.456 | Islam |
| Armenian | 32.8 | 33.4 | 32.0 | 33.0 | 33.7 | 32.2 | 32.1 | 32.6 | 31.5 | 1.68 | 2.225 | Christianity |
| Mordvin | 44.4 | 42.1 | 46.9 | 44.2 | 42.3 | 45.9 | 44.7 | 41.7 | 48.5 | 1.986 | 2.303 | Christianity |
| Avar | 24.6 | 23.8 | 25.4 | 23.8 | 23.4 | 24.1 | 25.1 | 24.0 | 26.2 | 2.09 | 3.319 | Islam |
| Belarusian | 48.0 | 45.9 | 50.2 | 47.7 | 45.8 | 49.6 | 49.1 | 46.1 | 52.4 | 1.765 | 1.941 | Christianity |
| Kyrgyz | 30.2 | 29.4 | 31 | 29.5 | 29 | 30.1 | 30.6 | 29.7 | 31.4 | 2.015 | 2.964 | Islam |
| Udmurt | 40.0 | 37.4 | 42.0 | 41.2 | 39.0 | 42.6 | 38.9 | 36.1 | 41.3 | 1.93 | 2.378 | Christianity |
| Azerbaijani | 29.5 | 31.9 | 24.6 | 30.0 | 32.3 | 24.7 | 26.5 | 28.7 | 24.1 | 1.83 | 2.619 | Islam |
| Mari | 36.7 | 34.5 | 38.5 | 36.4 | 34.6 | 37.7 | 36.9 | 34.5 | 39.3 | 1.917 | 2.493 | Christianity |
| German | 39.7 | 38.2 | 41.2 | 39.6 | 38.0 | 41.0 | 40.0 | 38.4 | 41.4 | 1.864 | 2.443 | Christianity |
| Kabardin | 28.2 | 27.1 | 29.3 | 28.8 | 27.4 | 30.2 | 27.7 | 26.9 | 28.4 | 1.799 | 2.654 | Islam |
| Ossetian | 34.1 | 32.5 | 35.7 | 34.0 | 32.2 | 35.7 | 34.4 | 33.2 | 35.6 | 1.665 | 2.267 | Christianity |
| Dargwa | 24.6 | 23.9 | 25.3 | 24.3 | 23.8 | 24.8 | 24.8 | 24.0 | 25.6 | 2.162 | 3.476 | Islam |
| Buryat | 28.6 | 26.6 | 30.5 | 27.6 | 25.7 | 29.5 | 29.5 | 27.4 | 31.5 | 1.949 | 2.861 | Buddhism |
| Yakut | 26.9 | 25.1 | 28.7 | 26.9 | 25.2 | 28.5 | 27.0 | 25.1 | 28.8 | 1.972 | 2.843 | Christianity |
| Kumyk | 24.6 | 23.7 | 25.4 | 24.8 | 23.9 | 25.6 | 24.4 | 23.5 | 25.2 | 1.977 | 3.123 | Islam |
| Ingush | 22.7 | 22.4 | 23.0 | 22.9 | 22.5 | 23.4 | 22.5 | 22.3 | 22.7 | 2.325 | 4.05 | Islam |
| Lezgian | 25.4 | 25.2 | 25.7 | 25.0 | 25.2 | 24.8 | 25.9 | 25.2 | 26.6 | 2.045 | 3.275 | Islam |
| Komi | 38.8 | 35.8 | 41.0 | 39.4 | 35.5 | 41.6 | 38.3 | 36.0 | 40.4 | 1.869 | 2.363 | Christianity |
| Tuvan | 23.0 | 21.7 | 24.2 | 22.3 | 21.4 | 23.3 | 23.6 | 22.0 | 25.1 | 1.996 | 3.407 | Buddhism |
| Jewish | 57.5 | 55.7 | 61.1 | 57.6 | 55.7 | 61.2 | 53.5 | 52.0 | 55.3 | 1.264 | 1.371 | Judaism |
| Karachay | 29.5 | 28.3 | 30.5 | 27.6 | 26.4 | 28.9 | 30.5 | 29.5 | 31.5 | 1.86 | 2.836 | Islam |
| Kalmyk | 31.3 | 29.2 | 33.3 | 28.6 | 26.3 | 31.3 | 33.9 | 32.6 | 35.1 | 1.853 | 2.625 | Buddhism |
| Adyghe | 34.2 | 32.4 | 36.0 | 32.0 | 30.3 | 33.7 | 36.2 | 34.2 | 38.2 | 1.757 | 2.363 | Islam |
| Permyak | 40.8 | 38.6 | 42.7 | 41.3 | 39.5 | 42.5 | 40.5 | 38.1 | 42.8 | 2.145 | 2.604 | Christianity |
| Balkar | 30.1 | 29.5 | 30.7 | 29.3 | 28.8 | 29.8 | 30.9 | 30.1 | 31.9 | 1.689 | 2.624 | Islam |
| Karelian | 45.7 | 42.4 | 48.6 | 44.7 | 41.3 | 47.2 | 47.0 | 43.5 | 51.2 | 1.823 | 2.108 | Christianity |
| Kazakh | 30.7 | 28.4 | 32.9 | 30.1 | 27.9 | 32.4 | 31.2 | 28.8 | 33.5 | 1.872 | 2.609 | Islam |
| Altay | 27.5 | 25.5 | 29.4 | 22.7 | 21.5 | 24.2 | 28.9 | 26.9 | 30.8 | 2.021 | 2.933 | Buddhism |
| Cherkess | 31.2 | 30.1 | 32.3 | 29.7 | 28.3 | 30.9 | 32.1 | 31.1 | 33.3 | 1.807 | 2.607 | Islam |
Languages
Russian is the common official language throughout Russia understood by 99% of its current inhabitants and widespread in many adjacent areas of Asia and Eastern Europe. National subdivisions of Russia have additional official languages (see their respective articles). There are more than 100 languages spoken in Russia, many of which are in danger of extinction.
Religion
Religion in Russia (2012)[105]
Russia officially recognizes Orthodox Christianity, Islam, Judaism, and Buddhism as traditional religions. Russia has large populations of non-practicing believers and non-believers; many people identify only nominally with a religion. There is no official census on religion in Russia. The Pew Research Center found that 71% of Russians identified as Orthodox, with 1.8% Protestants, 0.5% Catholics and 0.3% other Christians.[106][107] Pew estimated 11.7% of the population to be Muslim as of 2010.[108] Estimates of practicing worshipers are: Russian Orthodox 15–20%, Muslim 10–15%, other Christian 2% (2006 est.).[109] Only a small percentage of the population is strongly religious: about approximately 2–4%[110] of the general population are integrated into church life (воцерковленные), while others attend on a less regular basis or not at all. Many non-religious ethnic Russians identify with the Orthodox faith for cultural reasons.[111] The majority of Muslims live in the Volga–Ural region and the North Caucasus, although Moscow, Saint Petersburg, and parts of Siberia also have sizable Muslim populations.[112][113]
Other branches of Christianity present in Russia include Roman Catholicism (approx. 1%), Baptists, Pentecostals, Lutherans and other Protestant churches (together totalling about 0.5% of the population) and Old Believers.[114][115] There is some presence of Judaism, Buddhism, Hinduism and other pagan beliefs are also present to some extent in remote areas, sometimes syncretized with one of the mainstream religions.
According to the data of the 2010 Census, presented above, 88.26% of the people who stated their ethnicity belong to traditional Christian ethnic groups, 10.90% belong to traditional Muslim ethnic groups and 0.84% belong to traditional Buddhist, Jewish, Hindu and other ethnic groups.
Education
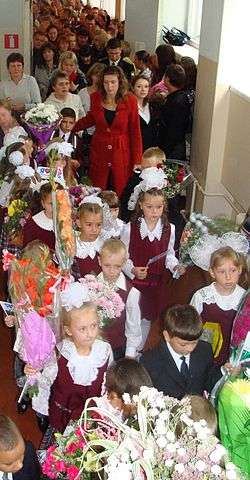
Literacy
definition: age 15 and over can read and write
total literacy: 99.7% (2015)
male: 99.7%
female: 99.6%[109]
Russia's free, widespread and in-depth educational system, inherited with almost no changes from the Soviet Union, has produced nearly 100% literacy. 97% of children receive their compulsory 9-year basic or complete 11-year education in Russian. Other languages are also used in their respective republics, for instance Tatar, and Yakut.
About 3 million students attend Russia's 519 institutions of higher education and 48 universities. As a result of great emphasis on science and technology in education, Russian medical, mathematical, scientific, and space and aviation research is generally of a high order.[116]
Labor force
The Russian workforce is undergoing tremendous changes. Although well-educated and skilled, it is largely mismatched to the rapidly changing needs of the Russian economy. The unemployment rate in Russia was 5.3% as of 2013.[117] Unemployment is highest among women and young people. Following the breakup of the Soviet Union and the economic dislocation it engendered, the standard of living fell dramatically. However, since recovering from the 1998 economic crisis, the standard of living has been on the rise. As of 2010 about 13.1% of the population was living below the poverty line, compared to 40% in 1999.[118] The average yearly salary in Russia was $14,302 (about $23,501 PPP) as of October 2013, up from $455 per year in August 1999.[119][120][121]
According to the FMS, as of 2011, there were 7,000,000 immigrants working in Russia. Half of these were from Ukraine, while the remainder was mostly from Central Asia. Only 3 million or less than half of all the immigrants are legal. Illegal immigrants number 4 million, mostly from Ukraine and the Caucasus.[46] The Census usually covers only a part of this population and the last one (2002 Census) counted one million non-citizens.
Population of main cities
Russia is a highly urbanized country, with 74.2% of the total population (2017) living in urban areas.[109] Moscow is the capital and most populous city of Russia, with 12.2 million residents within the city limits[122] and 17.1 million within the urban area.[123] Moscow is recognized as a Russian federal city. Moscow is a major political, economic, cultural, and scientific centre of Russia and Eastern Europe, as well as the largest city entirely on the European continent.
Rural life
Rural life in Russia is distinct from many other nations. Relatively few Russian people live in villages—rural population accounted for 26% of the total population according to the 2010 Russian Census. Some people own or rent village houses and use them as dachas (summer houses).
See also
- Demographics of Siberia
- Demography of Central Asia
- Demographic crisis of Russia
- Health in Russia
- Indigenous small-numbered peoples of the North, Siberia and the Far East
- Russian cross
Census information:
Notes
- In fertility rates, 2.1 and above is a stable population and has been marked blue, 2 and below leads to an aging population and the result is that the population decreases.
- Millions of Ukrainians have immigrated into Russia since the start of War in Donbass in 2014.
- Including Old Believers (0.2%), Protestantism (0.2%), and Catholicism (0.1%).
- The Sreda Arena Atlas 2012 did not count the populations of two Muslim-majority federal subjects of Russia, namely Chechnya and Ingushetia, which together had a population of nearly 2 million, thus the proportion of Muslims may be slightly underestimated.[105]
- The category included Rodnovers accounting for 44%, Hinduists accounting for 0.1%, and other Pagan religions and Siberian Tengrists and shamans accounting for the rest.
- Including Judaism (0.1%) and other unspecified religions.
References
- Оценка численности постоянного населения на 1 января 2020 года и в среднем за 2019 год [Preliminary estimated population as of 1 January 2020 and on the average for 2019] (XLS). Rosstat (in Russian).}
- "Население России на 2017 год составляет 146 804 372 человека. Статистика населения России РФ : Сайт о странах, городах, статистике населения и пр". Statdata.ru. Retrieved 28 August 2017.
- Оценка численности постоянного населения на 1 января 2020 года и в среднем за 2019 год [Preliminary estimated population as of 1 January 2020 and on the average for 2019] (XLS). Rosstat (in Russian).
- Рождаемость, смертность и естественный прирост населения по субъектам Российской Федерации за 2019 год [Births, deaths and natural change by the regions of Russia for 2019] (XLSX). Russian Federal State Statistics Service (in Russian). Retrieved 16 May 2020.
- Ожидаемая продолжительность жизни при рождении за 2019 год (предварительно) [Life expectancy at birth (preliminary data for 2019)] (XLSX). Russian Federal State Statistics Service (in Russian). Retrieved 4 April 2020.
- Ожидаемая продолжительность жизни при рождении [Life expectancy at birth] (XLSX). Russian Federal State Statistics Service (in Russian). Retrieved 29 January 2020.
- Суммарный коэффициент рождаемости [Total fertility rate] (XLSX). Russian Federal State Statistics Service (in Russian). Retrieved 27 February 2020.
- Суммарный коэффициент рождаемости [Total fertility rate]. Russian Federal State Statistics Service (in Russian). Retrieved 16 May 2020.
- "Путин заявил, что недоволен уровнем рождаемости в России". tass.ru. Retrieved 16 May 2020.
- Оперативные данные по естественному движению населения Российской Федерации [Preliminary vital statistics of Russia] (XLSX). Russian Federal State Statistics Service (in Russian). Retrieved 5 February 2020.
- https://www.worldometers.info/demographics/russia-demographics/
- "RUSSIA: historical demographical data of the whole country". Populstat.info. Retrieved 6 July 2017.
- Russian Federal State Statistics Service (2011). "Всероссийская перепись населения 2010 года. Том 1" [2010 All-Russian Population Census, vol. 1]. Всероссийская перепись населения 2010 года [2010 All-Russia Population Census] (in Russian). Federal State Statistics Service.
- "Russia", The World Factbook, 7 February 2020
- "Demographic Transition Model". Barcelona Field Studies Centre. 27 September 2009. Archived from the original on 27 May 2010. Retrieved 28 March 2011.
- "Russia", The World Factbook, 7 February 2020
- Max Roser (2014), "Total Fertility Rate around the world over the last centuries", Our World In Data, Gapminder Foundation
- "Russia", The World Factbook, 7 February 2020
- Moya Flynn. Migrant resettlement in the Russian federation: reconstructing 'homes' and 'homelands', Anthem Press (2004). p. 15. ISBN 1-84331-117-8
- 2009 demographic figures Rosstat Retrieved 18 February 2010
- Russian death rates 1950–2008, Demoscope.ru, Retrieved 29 May 2009
- "Russian birth rates 1950–2008". Demoscope.ru. Archived from the original on 30 April 2011. Retrieved 20 May 2009.
- Eke, Steven (23 June 2005). "Russia's population falling fast". BBC News. Retrieved 15 March 2008.
- "World Population Statistics". esa.un.org. Archived from the original on 21 March 2007.
- "World Urbanization Prospects – Population Division – United Nations". esa.un.org. Retrieved 17 May 2018.
- ООН спрогнозировала сокращение населения России к 2050 году до 132 миллионов человек. Meduza (in Russian). Retrieved 17 May 2018.
- Russia sees first population increase in 15 years BBC Retrieved 18 February 2009
- "Russian population rises by 292,400 in 2012 – Rosstat. | HighBeam Business: Arrive Prepared". Business.highbeam.com. 19 February 2013. Archived from the original on 2 December 2013. Retrieved 4 June 2013.
- Russian policies ignite unprecedented birth rate in 2007, The Economic Times, 21 March 2008
- News, Paul Harrison, BBC UGC and Social (30 January 2018). "Russians debate declining birth rate". Retrieved 25 April 2019 – via www.bbc.com.
- Mass privatisation and the post-communist mortality crisis: a cross-national analysis The Lancet, Retrieved 02-12-09
- Ex-communist reform – Mass murder and the market, The Economist, Retrieved 02-12-09
- "WHO Life Expectancy Projections 2000 – ministry". World Health Organization. Archived from the original on 29 December 2008. Retrieved 7 January 2009.
- Korotayev A., Khaltourina D. Russian Demographic Crisis in Cross-National Perspective. Russia and Globalization: Identity, Security, and Society in an Era of Change. Ed. by D. W. Blum. Baltimore: Johns Hopkins University Press, 2008. p. 37–78.
- Burlington Free Press, 26 June 2009, page 2A, "Study blames alcohol for half Russian deaths"; see also Khaltourina, D. A., & Korotayev, A. V. "Potential for alcohol policy to decrease the mortality crisis in Russia", Evaluation & the Health Professions, vol. 31, no. 3, September 2008. pp. 272–281].
- See, e.g., Khaltourina, Daria, and Andrey Korotayev. "Effects of Specific Alcohol Control Policy Measures on Alcohol-Related Mortality in Russia from 1998 to 2013". Alcohol and Alcoholism (2015): agv042.
- "Смертность в России сквозь призму приватизации". demoscope.ru. Retrieved 1 September 2017.
- "Vladimir Putin's State-of-the-Nation Address". Mosnews.com. Archived from the original on 21 January 2008. Retrieved 23 October 2011.
- Newsru, Население России за пять лет уменьшилось на 3,2 миллиона до 142 миллионов человек, 19 October 2007 Retrieved same date
- "Миздравсоцразвития: В России впервые за 15 лет зафиксирован прирост населения — Рамблер/финансы". finance.rambler.ru. Archived from the original on 12 March 2014. Retrieved 1 September 2017.
- Tom Parfitt in Moscow (21 April 2011). "Vladimir Putin pledges to spend £32bn on increasing Russian life expectancy, World news". The Guardian. UK. Retrieved 14 May 2011.
- Sputnik. "Russia trying to resolve demographic problem through immigration". En.rian.ru. Retrieved 1 September 2017.
- Sputnik. "Immigration Drives Russian Population Increase". En.ria.ru. Retrieved 1 September 2017.
- Lomsadze, Giorgi (23 April 2014). "The Caucasus Concerned over Born-Again Russians". Eurasianet.org. Retrieved 1 September 2017 – via EurasiaNet.
- "Uzbekistan: Minorities Taking Advantage of New Russian Citizenship Rules". EurasiaNet.org. Retrieved 21 June 2015.
- "Новости NEWSru.com :: ФМС: в РФ нелегально работают 3 млн трудовых мигрантов, остальные 4 млн "халтурят" с налогами". Newsru.com. Retrieved 14 May 2011.
- "Russia reports surge in illegal migration from Asia". Indian Express. Retrieved 22 August 2016.
- "Migration law violators to be banned from entering Russia – Putin". Russia Today. Retrieved 6 April 2012.
- "Illegal immigrants can be barred from Russia for 5–10 years". The Voice of Russia. Retrieved 6 April 2012.
- "Russia closed for immigration?". Russia. Retrieved 6 April 2012.
- "ФМС России". fms.gov.ru. Retrieved 25 April 2019.
- Luxmoore, Matthew (27 February 2015). "Ruble ripple: New Russian laws make life difficult for migrant workers". Al Jazeera. Retrieved 26 December 2015.
- "The Backlash Against Immigration in Russia". Newsweek. Retrieved 6 April 2012.
- "Some 500 illegal immigrants from Vietnam arrested in Moscow". RIA Novosti. Retrieved 6 April 2012.
- Max Roser (2014), "Total Fertility Rate around the world over the last centuries", Our World In Data, Gapminder Foundation
- А. Г. Рашин. Население России за 100 лет (1811—1913 гг.). Статистические очерки. Раздел первый. Масштабы и темпы динамики численности населения России за 1811—1913 гг. Глава первая. Динамика общей численности населения России за 1811—1913 гг. страница 38
- E.Andreev, L.Darski, T. Kharkova "Histoire démographique de la Russie. 1927–1959"
- "Goskomstat". Goskomstat. Retrieved 14 May 2011.
- "Демография". Gks.ru. Archived from the original on 4 February 2014. Retrieved 21 June 2015.
- "Каталог публикаций::Федеральная служба государственной статистики". Gks.ru. 8 May 2010. Retrieved 4 June 2013.
- "Численность населения" (XLS). Gks.ru. Retrieved 1 September 2017.
- "ЕМИСС – Число прерываний беременности". Fedstat.ru. Archived from the original on 24 September 2015. Retrieved 21 June 2015.
- https://www.gks.ru/storage/mediabank/Popul2020.xls
- https://www.gks.ru/storage/mediabank/EDN(1).xlsx
- Статистический ежегодник России. 1913 г. Издание ЦСК МВД. СПб., 1914.
- "Russia Population 2018", World Population Review
- "The World FactBook – Russia", The World Factbook, 12 July 2018
- Age structure of the Russian population as of 1 January 2009 Rosstat Retrieved 8 October 2009
- "Сообщение Росстата". Perepis-2010.ru. Retrieved 14 May 2011.
- Russia's Demographic "Crisis" 1996 RAND, page 13–18. Retrieved 3 March 2009. ISBN 0-8330-2446-9
- "The World Factbook 2009". Washington DC: Central Intelligence Agency. 2009. Retrieved 7 December 2009.
- "Rosstat TFR database". Gks.ru. Retrieved 14 May 2011.
- Fertility Rate Statistics. Demoscope.ru. Retrieved 10 September 2009
- "Archived copy". Archived from the original on 4 December 2013. Retrieved 24 May 2013.CS1 maint: archived copy as title (link)
- "Population" (PDF). Stat-nkr.am. Retrieved 1 September 2017.
- Russian Birth Rate above Regional Average, Euromonitor International, retrieved on 26 March 2013.
- "Births: Preliminary Data for 2011" (PDF). Center for Disease Control and Prevention. Retrieved 1 September 2017.
- Adomanis, Mark (29 May 2015). "According To The Latest Data Russia's Demography Is Still In Sharp Decline". Forbes. Retrieved 26 December 2015.
- "ЕСТЕСТВЕННОЕ ДВИЖЕНИЕ НАСЕЛЕНИЯ В РАЗРЕЗЕ СУБЪЕКТОВ РОССИЙСКОЙ ФЕДЕРАЦИИ за январь-октябрь года". Federal State Statistics Service. Retrieved 18 April 2020.
- "Демография". Gks.ru. Retrieved 1 September 2017.
- "Life expectancy of the Russian Federation since 1950". Demoscope.ru. 26 April 2011. Archived from the original on 14 May 2011. Retrieved 14 May 2011.
- "Ожидаемая продолжительность жизни при рождении". Gks.ru. Retrieved 1 September 2017.
- "Ожидаемая продолжительность жизни россиян выросла на 3,7 года в 2011г – Голикова". Perepis-2010.ru. Retrieved 4 June 2013.
- "Global status report on alcohol and health" (PDF). WHO. Retrieved 1 September 2017.
- Yeltsin: healthier than the average Russian: Poverty, pollution and drink has slashed life expectancy, writes Phil Reeves, The Independent, 29 September 1996
- A Country Study: Soviet Union (Former) Federal Research Division, Library of Congress, Edited by Raymond E. Zickel 1989. Chapter 3 – Population – Vital Statistics
- "World Development Indicators – DataBank". World Bank. Retrieved 25 April 2019.
-
Vishnevsky, Anatoly G. (2009). "National Human Development Report: Russian Federation 2008: Russia Facing Demographic Challenges" (PDF). Moscow: UNDP Russia. p. 48. Retrieved 26 February 2015.
In the 1980s only 8–10% of married women of reproductive age in Russia used hormonal and intrauterine contraception, compared with 20–40% in developed countries.
- National Human Development Report Russian Federation 2008, UNDP, pages 47–49, Retrieved 10 October 2009
- https://www.gks.ru/free_doc/new_site/perepis2010/croc/perepis_itogi1612.htm
- "Владивосток: В России стало больше русских". Perepis-2010.ru. 20 December 2011. Retrieved 4 June 2013.
- "Перепись-2010: русских становится больше". Perepis-2010.ru. 19 December 2011. Retrieved 4 June 2013.
- "СОСТАВ ГРУППЫ НАСЕЛЕНИЯ "ЛИЦА, УКАЗАВШИЕ ДРУГИЕ ОТВЕТЫ О НАЦИОНАЛЬНОЙ ПРИНАДЛЕЖНОСТИ" ПО СУБЪЕКТАМ РОССИЙСКОЙ ФЕДЕРАЦИИ"".
- Central Asia: Labor Migrants Face Abuse, Xenophobia Rferl.org, Retrieved 15 March 2008
- Ilkhamov, Alisher (19 March 2014). "Central Asian Migrants in Russia: A Heated Debate". Fair Observer.
- Kirk, Ashley (21 January 2016). "Mapped: Which country has the most immigrants?". The Daily Telegraph.
- "Новости NEWSru.com :: ФМС: в РФ нелегально работают 3 млн трудовых мигрантов, остальные 4 млн "халтурят" с налогами". Newsru.com. Retrieved 14 May 2011.
- "Migration and Remittances: Recent Developments and Outlook" (PDF). April 2016.
- Arakelyan, Lilit (4 June 2014). "Armenians Enticed by Russian Passport Offer".
- "Tajik Official Says Migration To Russia Down". 22 July 2016.
- Shaku, Kanat (30 September 2016). "Central Asian remittances from Russia begin to recover".
- "Национальный состав международных мигрантов". Gks.ru. Retrieved 21 June 2015.
- "5. Женщины Наиболее Многочисленных Национальностей По Возрастным Группам И Числу Рожденных Детей По Субъектам Российской Федерации". Prerpis2002.ru. Retrieved 1 September 2017.
- "7. Население Отдельных Национальностей По Возрастным Группам И Полу По Субъектам Российской Федерации" (XLS). Perepis2002.ru. Retrieved 1 September 2017.
- "Арена: Атлас религий и национальностей" [Arena: Atlas of Religions and Nationalities] (PDF). Среда (Sreda). 2012. See also the results' main interactive mapping and the static mappings: "Religions in Russia by federal subject" (Map). Ogonek. 34 (5243). 27 August 2012. Archived from the original on 21 April 2017. The Sreda Arena Atlas was realised in cooperation with the All-Russia Population Census 2010 (Всероссийской переписи населения 2010) and the Russian Ministry of Justice (Минюста РФ).
- "Christian Population". Pew Forum. Retrieved 13 April 2018.
- "Religious Belief and National Belonging in Central and Eastern Europe". Pew Forum. Retrieved 13 April 2018.
- "Muslim Population by Country". Pew Forum. Retrieved 13 April 2018.
- "Central Asia :: Russia — The World Factbook – Central Intelligence Agency". CIA. Retrieved 25 April 2019.
- "Русская линия / Библиотека периодической печати / Как пишутся страшные сказки о Церкви". Rusk.ru. 31 August 2005. Retrieved 14 May 2011.
- Социология религии (PDF) (in Russian). Archived from the original (PDF) on 27 March 2009.
- "Russia". U.S. Department of State. Retrieved 1 September 2017.
- Russia CIA World Factbook CIA World Factbook updated 6 March 2008
- "Arena: Atlas of Religions and Nationalities in Russia". Sreda, 2012.
- 2012 Arena Atlas Religion Maps. Ogonek, № 34 (5243), 27/08/2012. Retrieved 21/04/2017. Archived.
- "Russia country guide – EUbusiness.com – business, legal and financial news and information from the European Union". Eubusiness.com. Retrieved 14 May 2011.
- "Russia Capital Investment Falls 1.6% in September – Rosstat". The Wall Street Journal.
- "Russia Population below poverty line". Indexmundi.com. Retrieved 21 June 2015.
- Russians weigh an enigma with Putin's protégé NBC News Retrieved 29 March 2009
- "Putin's Economy—Eight Years On". Russiaprofile.org. Archived from the original on 22 December 2007. Retrieved 27 December 2007.
- "GDP per capita, PPP (current international $)". World Bank. Retrieved 21 June 2015.
- http://www.gks.ru/free_doc/new_site/population/demo/Popul2015.xls
- "Major Agglomerations of the World – Population Statistics and Maps". Citypopulation.de. Retrieved 26 September 2017.
- Surinov, A.; et al., eds. (2016). "5. Population: Cities with population size of 1 million persons and over". Russia in Figures (PDF) (Report). Moscow: Federal State Statistics Service (Rosstat). p. 82. ISBN 978-5-89476-420-7. Retrieved 12 June 2017.
- Оксенойт, Г. К. (2016). "31. Численность населения городов и поселков городского типа по федеральным округам и субъектам Российской Федерации". In Рахманинов, М. В. (ed.). Численность населения Российской Федерации: По муниципальным образованиям (Report) (in Russian). Москва: Федеральная служба государственной статистики (Росстат). Retrieved 12 June 2017.
- "Оценка численности постоянного населения на 1 января 2017 года и в среднем за 2016 год". gks.ru. Retrieved June 12, 2017.
- "Предварительная оценка численности постоянного населения на 1 января 2017 года и в среднем за 2016 год по городским округам и муниципальным районам Красноярского края". krasstat.gks.ru. Retrieved June 12, 2017.
- "Численность населения по муниципальным районам и городским округам Новосибирской области на 1 января 2017 года и в среднем за 2016 год". novosibstat.gks.ru. Retrieved June 12, 2017.
- "Предварительная оценка численности населения на 1 января 2017 года и в среднем за 2016 год". sverdl.gks.ru. Retrieved June 12, 2017.
- "Численность населения муниципальных образований Республики Татарстан на начало 2017 года". tatstat.gks.ru. Retrieved June 12, 2017.
- "Оценка численности населения на 1 января 2017 года по муниципальным образованиям Краснодарского края". krsdstat.gks.ru. Retrieved June 12, 2017.
- "Численность постоянного населения Челябинской области в разрезе городских округов, муниципальных районов, городских и сельских поселений на 1 января 2017 года". chelstat.gks.ru. Retrieved June 12, 2017.
- "База данных показателей муниципальных образований Омской области (Население)". gks.ru. Retrieved June 12, 2017.
- "Утвержденная численность постоянного населения Самарской области (на 1. 1. 2017. г. и среднегодовая за 2016. г.)". samarastat.gks.ru. Retrieved June 12, 2017.
- "Численность постоянного населения Удмуртской Республики /Утверждено Росстатом (письмо от 3. 3. 2017. г., No. 08-08-4/891-ТО)/". udmstat.gks.ru. Retrieved June 12, 2017.
- "Оценка численности постоянного населения Республики Башкортостан на 1 января 2017 года по муниципальным образованиям". gks.ru. Retrieved June 12, 2017.
Further reading
- Gavrilova N.S., Gavrilov L.A. Aging Populations: Russia/Eastern Europe. In: P. Uhlenberg (Editor), International Handbook of the Demography of Aging, New York: Springer-Verlag, 2009, pp. 113–131.
- Gavrilova N.S., Semyonova V.G., Dubrovina E., Evdokushkina G.N., Ivanova A.E., Gavrilov L.A. Russian Mortality Crisis and the Quality of Vital Statistics. Population Research and Policy Review, 2008, 27: 551–574.
- Gavrilova, N.S., Gavrilov, L.A., Semyonova, V.G., Evdokushkina, G.N., Ivanova, A.E. 2005. Patterns of violent crime in Russia. In: Pridemore, W.A. (ed.). Ruling Russia: Law, Crime, and Justice in a Changing Society. Boulder, Colorado: Rowman & Littlefield Publ., Inc, 117–145
- Gavrilova, N.S., Semyonova, V.G., Evdokushkina G.N., Gavrilov, L.A. The response of violent mortality to economic crisis in Russia. Population Research and Policy Review, 2000, 19: 397–419.
External links
- Igor Beloborodov, Demographic situation in Russia in 1992–2010 (report at the Moscow Demographic Summit — June 2011)
- Nicholas Eberstadt, Russia's Peacetime Demographic Crisis: Dimensions, Causes, Implications (National Bureau of Asian Research Project Report, May 2010)
- Edited by Julie DaVanzo, Gwen Farnsworth Russia's Demographic "Crisis" 1996 RAND ISBN 0-8330-2446-9
- Jessica Griffith The Regional Consequences of Russia's Demographic Crisis University of Leicester
- Results of population policy and current demographic situation (2008)
- Interactive statistics for all countries, site of United States Census Bureau.
- 2009 World Population Data Sheet by the Population Reference Bureau
- Population density and distribution maps (text is in Russian; the topmost map shows population density based on 1996 data)
- Ethnic groups of Russia
- Problems with mortality data in Russia
- V. Borisov "Demographic situation in Russia and the role of mortality in reproduction of population", 2005 (in English)
- Russian Empire:
- (in Russian) В погоне за малыми, an article about treatment of minorities in the Russian Empire, Kommersant-Money, 25 October 2005
- Choice between mass migration and birth rate increase as possible solutions of depopulation problem in Russia (in Russian)
- Build Russian population graph 1960–2013 (World Bank data)
- Build Russian population projection graph till 2100 (United Nation data)
- Build Russian life expectancy at birth graph 1950 – 2013 (United Nation data)
| Titular Nationalities | |||||||||||||||
|---|---|---|---|---|---|---|---|---|---|---|---|---|---|---|---|
| Indigenous peoples |
| ||||||||||||||
| Other ethnic peoples | |||||||||||||||
| Unrecognized peoples | |||||||||||||||
| Disappeared nations | |||||||||||||||
| Political leaders |  | |
|---|---|---|
| Military figures and explorers | ||
| Scientists, engineers and inventors | ||
| Artists and writers | ||
| Religious leaders | ||
| Sportspeople | ||
| Sovereign states |
|
|---|---|
| States with limited recognition | |
| Dependencies and other territories |
|
| |