Demographics of Chad
The people of Chad speak more than 100 different languages and divide themselves into many ethnic groups. However, language and ethnicity are not the same. Moreover, neither element can be tied to a particular physical type.[1]

Although the possession of a common language shows that its speakers have lived together and have a common history, peoples also change languages. This is particularly so in Chad, where the openness of the terrain, marginal rainfall, frequent drought and famine, and low population densities have encouraged physical and linguistic mobility. Slave raids among non-Muslim peoples, internal slave trade, and exports of captives northward from the ninth to the twentieth centuries also have resulted in language changes.
Anthropologists view ethnicity as being more than genetics. Like language, ethnicity implies a shared heritage, partly economic, where people of the same ethnic group may share a livelihood, and partly social, taking the form of shared ways of doing things and organizing relations among individuals and groups. Ethnicity also involves a cultural component made up of shared values and a common worldview. Like language, ethnicity is not immutable. Shared ways of doing things change over time and alter a group's perception of its own identity.
Not only do the social aspects of ethnic identity change but the biological composition (or gene pool) also may change over time. Although most ethnic groups emphasize intermarriage, people are often proscribed from seeking partners among close relatives—a prohibition that promotes biological variation. In all groups, the departure of some individuals or groups and the integration of others also changes the biological component.
The Chadian government has avoided official recognition of ethnicity. With the exception of a few surveys conducted shortly after independence, little data were available on this important aspect of Chadian society. Nonetheless, ethnic identity was a significant component of life in Chad.
The peoples of Chad carry significant ancestry from Eastern, Central, Western, and Northern Africa.[2]
Chad's languages fall into ten major groups, each of which belongs to either the Nilo-Saharan, Afro-Asiatic, or Niger–Congo language family. These represent three of the four major language families in Africa; only the Khoisan languages of southern Africa are not represented. The presence of such different languages suggests that the Lake Chad Basin may have been an important point of dispersal in ancient times.
Population
According to the 2019 revision of the World Population Prospects[3][4] the total population was 15,477,729 in 2018, compared to only 2 429 000 in 1950. The proportion of children below the age of 15 in 2010 was 45.4%, 51.7% was between 15 and 65 years of age, while 2.9% was 65 years or older .[5]
| Total population | Population aged 0–14 (%) | Population aged 15–64 (%) | Population aged 65+ (%) | |
|---|---|---|---|---|
| 1950 | 2 429 000 | 37.8 | 57.8 | 4.4 |
| 1955 | 2 671 000 | 39.1 | 56.8 | 4.1 |
| 1960 | 2 954 000 | 40.3 | 55.9 | 3.8 |
| 1965 | 3 289 000 | 41.5 | 54.7 | 3.8 |
| 1970 | 3 656 000 | 42.0 | 54.2 | 3.8 |
| 1975 | 4 114 000 | 42.8 | 53.4 | 3.8 |
| 1980 | 4 554 000 | 44.0 | 52.3 | 3.7 |
| 1985 | 5 151 000 | 45.2 | 51.2 | 3.6 |
| 1990 | 6 011 000 | 45.8 | 50.7 | 3.5 |
| 1995 | 6 998 000 | 45.9 | 50.8 | 3.3 |
| 2000 | 8 222 000 | 45.9 | 51.0 | 3.1 |
| 2005 | 9 786 000 | 45.8 | 51.2 | 3.0 |
| 2010 | 11 227 000 | 45.4 | 51.7 | 2.9 |
Vital statistics
Registration of vital events is in Chad not complete. The Population Departement of the United Nations prepared the following estimates.[5]
| Period | Live births per year | Deaths per year | Natural change per year | CBR* | CDR* | NC* | TFR* | IMR* |
|---|---|---|---|---|---|---|---|---|
| 1950–1955 | 118 000 | 70 000 | 48 000 | 46.4 | 27.5 | 18.9 | 6.10 | 191 |
| 1955–1960 | 130 000 | 72 000 | 57 000 | 46.1 | 25.8 | 20.3 | 6.20 | 181 |
| 1960–1965 | 142 000 | 75 000 | 68 000 | 45.6 | 23.9 | 21.8 | 6.30 | 172 |
| 1965–1970 | 159 000 | 77 000 | 82 000 | 45.8 | 22.2 | 23.5 | 6.40 | 163 |
| 1970–1975 | 184 000 | 82 000 | 101 000 | 47.3 | 21.2 | 26.1 | 6.60 | 154 |
| 1975–1980 | 209 000 | 86 000 | 123 000 | 48.3 | 19.9 | 28.4 | 6.74 | 146 |
| 1980–1985 | 233 000 | 88 000 | 146 000 | 48.1 | 18.1 | 30.0 | 6.75 | 136 |
| 1985–1990 | 266 000 | 94 000 | 172 000 | 47.6 | 16.8 | 30.8 | 6.70 | 129 |
| 1990–1995 | 308 000 | 109 000 | 199 000 | 47.4 | 16.7 | 30.7 | 6.65 | 129 |
| 1995–2000 | 362 000 | 131 000 | 231 000 | 47.6 | 17.3 | 30.3 | 6.62 | 131 |
| 2000–2005 | 429 000 | 160 000 | 269 000 | 47.6 | 17.8 | 29.9 | 6.54 | 133 |
| 2005–2010 | 482 000 | 179 000 | 303 000 | 45.9 | 17.1 | 28.9 | 6.20 | 131 |
| * CBR = crude birth rate (per 1000); CDR = crude death rate (per 1000); NC = natural change (per 1000); IMR = infant mortality rate per 1000 births; TFR = total fertility rate (number of children per woman) | ||||||||
Fertility and Births
Total Fertility Rate (TFR) (Wanted Fertility Rate) and Crude Birth Rate (CBR):[6]
| Year | CBR (Total) | TFR (Total) | CBR (Urban) | TFR (Urban) | CBR (Rural) | TFR (Rural) |
|---|---|---|---|---|---|---|
| 1996-97 | 47,8 | 6,6 (6,3) | 44,4 | 6,1 (5,7) | 48,8 | 6,8 (6,5) |
| 2004 | 44,6 | 6,3 (6,1) | 41,8 | 5,7 (5,5) | 45,3 | 6,5 (6,2) |
| 2014-15 | 40,5 | 6,4 (6,1) | 36,0 | 5,4 (5,1) | 41,8 | 6,8 (6,5) |
Fertility data as of 2014-2015 (DHS Program):[7]
| Region | Total fertility rate | Percentage of women age 15-49 currently pregnant | Mean number of children ever born to women age 40-49 |
|---|---|---|---|
| Batha | 7.3 | 12.2 | 8.3 |
| Borkou, Tibesti | 5.3 | 9.6 | 6.4 |
| Chari Baguirmi | 6.6 | 16.1 | 7.7 |
| Guéra | 6.7 | 14.6 | 8.4 |
| Hadjer-Lamis | 6.8 | 14.5 | 8.4 |
| Kanem | 6.0 | 14.8 | 7.1 |
| Lac | 5.4 | 14.7 | 7.9 |
| Logone Occidental | 6.4 | 12.7 | 7.6 |
| Logone Oriental | 7.6 | 12.7 | 8.3 |
| Mandoul | 6.5 | 12.7 | 7.7 |
| Mayo Kebbi Est | 6.7 | 15.0 | 7.3 |
| Mayo Kebbi Ouest | 7.5 | 13.8 | 7.9 |
| Moyen Chari | 5.5 | 12.6 | 6.8 |
| Ouaddaï | 6.1 | 13.1 | 7.1 |
| Salamat | 6.5 | 19.7 | 8.0 |
| Tandjilé | 7.1 | 13.1 | 8.0 |
| Wadi Fira | 5.9 | 12.2 | 6.5 |
| N’Djaména | 5.2 | 9.4 | 6.5 |
| Barh El Gazal | 5.6 | 14.5 | 7.1 |
| Ennedi Est, Ennedi Ouest | 5.0 | 13.4 | 6.3 |
| Sila | 6.7 | 19.6 | 7.7 |
Life expectancy
| Period | Life expectancy in Years[8] |
|---|---|
| 1950–1955 | 36.06 |
| 1955–1960 | |
| 1960–1965 | |
| 1965–1970 | |
| 1970–1975 | |
| 1975–1980 | |
| 1980–1985 | |
| 1985–1990 | |
| 1990–1995 | |
| 1995–2000 | |
| 2000–2005 | |
| 2005–2010 | |
| 2010–2015 |
Religions
The separation of religion from social structure in Chad represents a false dichotomy, for they are perceived as two sides of the same coin. Three religious traditions coexist in Chad- classical African religions, Islam, and Christianity. None is monolithic. The first tradition includes a variety of ancestor and/or place-oriented religions whose expression is highly specific. Islam, although characterized by an orthodox set of beliefs and observances, also is expressed in diverse ways. Christianity arrived in Chad much more recently with the arrival of Europeans. Its followers are divided into Roman Catholics and Protestants (including several denominations); as with Chadian Islam, Chadian Christianity retains aspects of pre-Christian religious belief.
The number of followers of each tradition in Chad is unknown. Estimates made in 1962 suggested that 35 percent of Chadians practiced classical African religions, 55 percent were Muslims, and 10 percent were Christians. In the 1970s and 1980s, this distribution undoubtedly changed. Observers report that Islam has spread among the Hajerai and among other non-Muslim populations of the Saharan and sahelian zones. However, the proportion of Muslims may have fallen because the birthrate among the followers of traditional religions and Christians in southern Chad is thought to be higher than that among Muslims. In addition, the upheavals since the mid-1970s have resulted in the departure of some missionaries; whether or not Chadian Christians have been numerous enough and organized enough to have attracted more converts since that time is unknown.
Other demographic statistics
Demographic statistics according to the World Population Review in 2019.[9]
- One birth every 48 seconds
- One death every 3 minutes
- One net migrant every 360 minutes
- Net gain of one person every 1 minutes
The following demographic statistics are from the CIA World Factbook.[10]
Population
- 15,833,116 (July 2018 est.)
- 12,075,985 (2017 est.)
Age structure
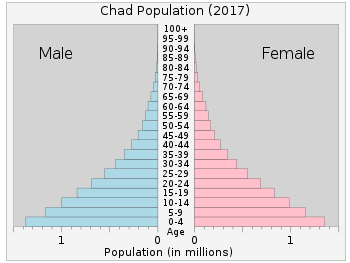
- 0-14 years: 48.12% (male 3,856,001 /female 3,763,622)
- 15-24 years: 19.27% (male 1,532,687 /female 1,518,940)
- 25-54 years: 26.95% (male 2,044,795 /female 2,222,751)
- 55-64 years: 3.25% (male 228,930 /female 286,379)
- 65 years and over: 2.39% (male 164,257 /female 214,754) (2018 est.)
Median age
- total: 15.8 years. Country comparison to the world: 226th
- male: 15.3 years
- female: 16.3 years (2018 est.)
- Total: 17.8 years
- Male: 16.8 years
- Female: 18.8 years (2017 est.)
Population growth rate
- 3.23% (2018 est.) Country comparison to the world: 5th
Birth rate
- 43 births/1,000 population (2018 est.) Country comparison to the world: 4th
Death rate
- 10.5 deaths/1,000 population (2018 est.) Country comparison to the world: 26th
Net migration rate
- -3.2 migrant(s)/1,000 population (2017 est.) Country comparison to the world: 176th
Total fertility rate
- 5.9 children born/woman (2018 est.) Country comparison to the world: 4th
Mother's mean age at first birth
- 17.9 years (2014/15 est.)
- note: median age at first birth among women 25-29
Dependency ratios
- total dependency ratio: 100.2 (2015 est.)
- youth dependency ratio: 95.2 (2015 est.)
- elderly dependency ratio: 4.9 (2015 est.)
- potential support ratio: 20.3 (2015 est.)
Contraceptive prevalence rate
- 5.7% (2014/15)
Urbanization
- urban population: 23.1% of total population (2018)
- rate of urbanization: 3.88% annual rate of change (2015-20 est.)
Sex ratio
- At birth: 1.04 male(s)/female
- Under 15 years: 1.01 male(s)/female
- 15–64 years: 0.92 male(s)/female
- 65 years and over: 0.66 male(s)/female
- Total population: 0.96 male(s)/female (2006 est.)
Life expectancy at birth
- total population: 57.5 years (2018 est.) Country comparison to the world: 214th
- male: 55.7 years (2018 est.)
- female: 59.3 years (2018 est.)
- Total population: 50.6 years
- Male: 49.4 years
- Female: 51.9 years (2017 est.)
HIV/AIDS
- Adult prevalence rate: 1.3% (2017 est.)
- People living with HIV/AIDS: 110,000(2017 est.)
- Deaths: 3,100 (2017 est.)
Children under the age of 5 years underweight
- 28.8% (2015)
Major infectious diseases
- Degree of risk: very high
- Food or waterborne diseases: bacterial and protozoal diarrhea, hepatitis A, and typhoid fever
- Vectorborne disease: malaria
- Water contact disease: schistosomiasis
- Respiratory disease: meningococcal meningitis (2005)
Nationality
- Noun: Chadian(s)
- Adjective: Chadian
Ethnic groups
The peoples of Chad carry significant ancestry from Eastern, Central, Western, and Northern Africa.[2]
- 200 distinct groups
- In the north and center: Arabs, Tubu (Daza, Teda), Zaghawa, Kanembu, Wadai, Baguirmi, Hadjarai, Fulani, Kotoko, Hausa, Bulala, and Maba, most of whom are Muslim
- In the south: Sara (Ngambaye, Mbaye, Goulaye), Mundang, Mussei, Massa, most of whom are Christian or animist
About 5,000 French citizens live in Chad.
Religions
- Islam 51.8%
- Roman Catholic 20.3%
- Protestant 23.5%
- Animist 0.6%
- Other Christians 0.3%
- Unknown 0.6%
- None 2.9% [11]
Languages
- Arabic (official), French (official), Sara (in south), more than 120 different languages and dialects
Literacy
- Definition: age 15 and over can read and write French or Arabic
- total population: 22.3% (2016 est.)
- male: 31.3% (2016 est.)
- female: 14% (2016 est.)
School life expectancy (primary to tertiary education)
- total: 8 years (2014)
- male: 9 years (2014)
- female: 6 years (2014)
References
| Wikimedia Commons has media related to Demographics of Chad. |
- "Chad Demographics Profile 2016". indexmundi.com. Retrieved 18 January 2017.
- Haber, Marc; Mezzavilla, Massimo; Bergström, Anders; Prado-Martinez, Javier; Hallast, Pille; Saif-Ali, Riyadh; Al-Habori, Molham; Dedoussis, George; Zeggini, Eleftheria; Blue-Smith, Jason; Wells, R. Spencer; Xue, Yali; Zalloua, Pierre A.; Tyler-Smith, Chris (2016-12-01). "Chad Genetic Diversity Reveals an African History Marked by Multiple Holocene Eurasian Migrations". The American Journal of Human Genetics. 99 (6): 1316–1324. doi:10.1016/j.ajhg.2016.10.012. ISSN 0002-9297. PMC 5142112. PMID 27889059.
- ""World Population prospects – Population division"". population.un.org. United Nations Department of Economic and Social Affairs, Population Division. Retrieved November 9, 2019.
- ""Overall total population" – World Population Prospects: The 2019 Revision" (xslx). population.un.org (custom data acquired via website). United Nations Department of Economic and Social Affairs, Population Division. Retrieved November 9, 2019.
- Population Division of the Department of Economic and Social Affairs of the United Nations Secretariat, World Population Prospects: The 2010 Revision
- "MEASURE DHS: Demographic and Health Surveys". worldbank.org. Retrieved 18 January 2017.
- http://dhsprogram.com/pubs/pdf/FR317/FR317.pdf
- "World Population Prospects - Population Division - United Nations". esa.un.org. Retrieved 2018-08-26.
- "Chad Population 2019", World Population Review
- "The World FactBook - Chad", The World Factbook, July 12, 2018

- "Tchad: Enquête Démographique et de Santé, 2014-2015" (PDF) (in French). Institut National de la Statistique, des Études Économiques et Démographiques. p. 34. Retrieved 21 April 2018.
Works cited
- ""U.S. Census Bureau." Census Bureau Home Page". census.gov. 29 January 2010. Archived from the original on 10 October 2013. Retrieved 6 December 2017.
![]()