List of national capitals by population
This is a list of national capitals, ordered according to population. Capitals of dependent territories and disputed territories are marked in italics. The population statistics given refer only to the official capital area, and do not include the wider metropolitan/urban district.
List

Taipei, Taiwan
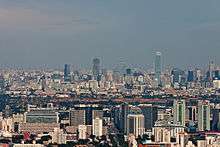
Beijing, China
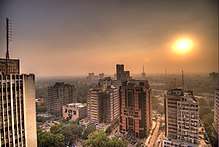
New Delhi, India
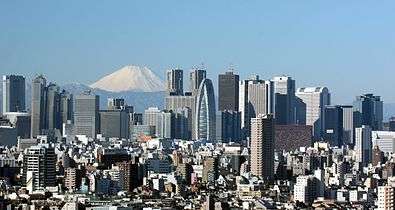
Tokyo, Japan
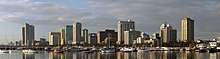
Manila, Philippines
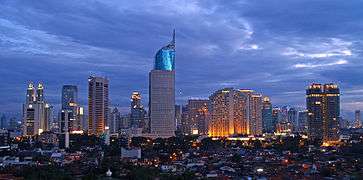
Jakarta, Indonesia
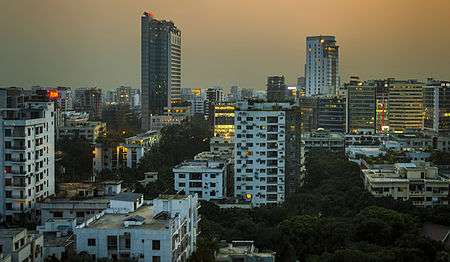
Dhaka, Bangladesh
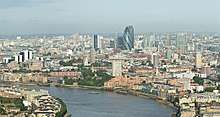
London, United Kingdom
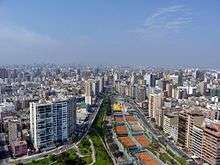
Lima, Peru

Berlin, Germany
Kyiv, Ukraine
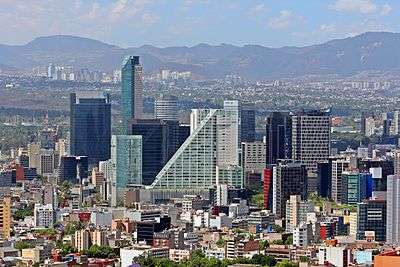
Mexico City, Mexico
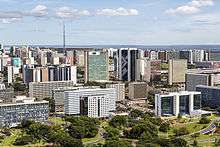
Brasilia, Brazil
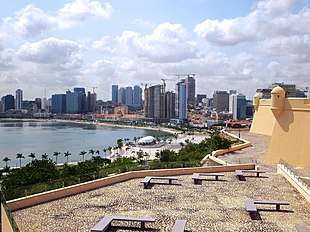
Luanda, Angola

Pretoria, South Africa

Paris, France

Phnom Penh, Cambodia

Tashkent, Uzbekistan

Stockholm, Sweden

Bucharest, Romania
_2015-01.jpg)
Budapest, Hungary
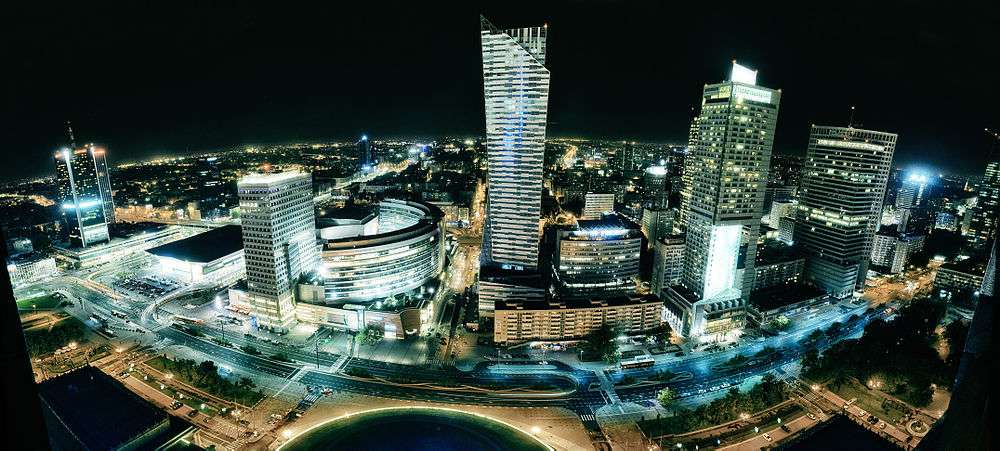
Warsaw, Poland
Minsk, Belarus
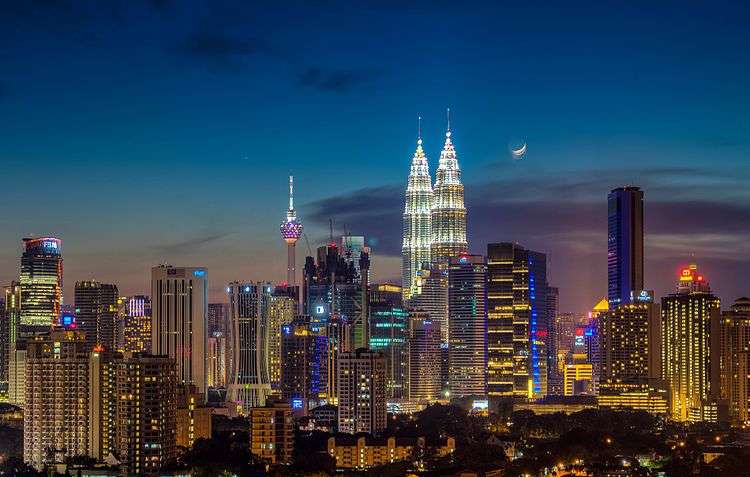
Kuala Lumpur, Malaysia
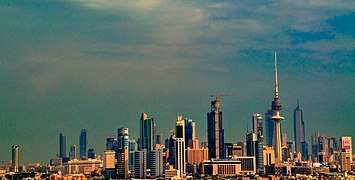
Kuwait City, Kuwait

Ottawa, Ontario, Canada
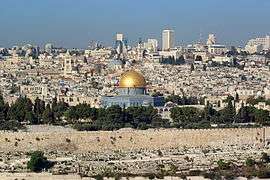
Jerusalem, Israel

Kingston, Jamaica

(Washington) District of Columbia, United States
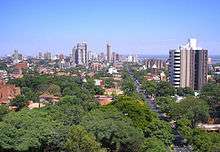
Asuncion, Paraguay
Riga, Latvia
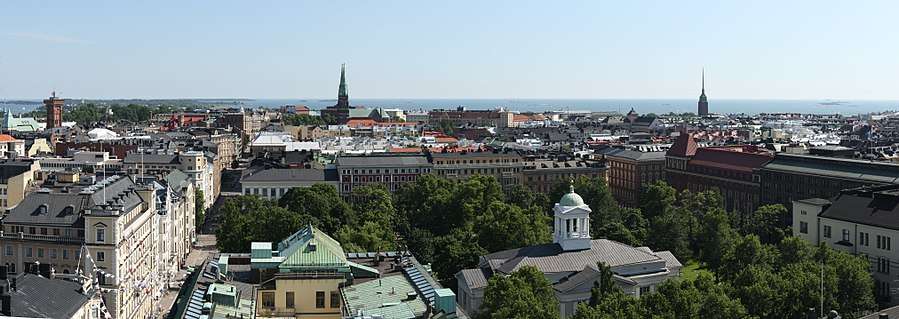
Helsinki, Finland

Vilnius, Lithuania

Tallinn, Estonia
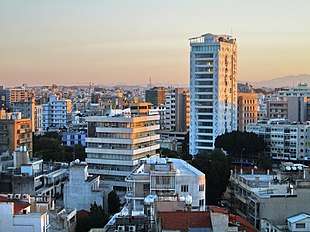
Nicosia, Cyprus
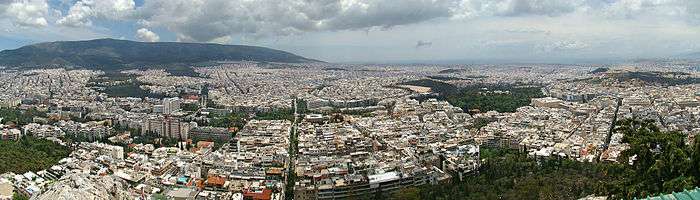
Athens, Greece
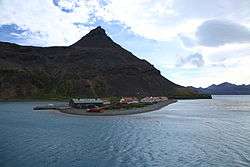
King Edward Point, South Georgia and the South Sandwich Islands
.jpg)
Sofia, Bulgaria
| Rank | Country/Territory | Capital | Population | Year | % of country's population |
|---|---|---|---|---|---|
| 1 | Beijing | 21,542,000[1] | 2010 | 1.5% | |
| 2 | New Delhi | 14,200,004 | 2011 | 1.05% | |
| 3 | Tokyo | 13,929,286[2] | 2017 | 11.03% | |
| 4 | Moscow | 12,506,468[3] | 2011 | 8.52% | |
| 5 | Kinshasa | 11,855,000[4] | 2012 | 12.9% | |
| 6 | Jakarta | 10,075,310[5] | 2011 | 3.76% | |
| 7 | Seoul | 9,838,892[6] | 2015 | 19.03% | |
| 8 | Cairo | 9,500,000 | 2012 | 9.54% | |
| 9 | Mexico City | 8,918,653[7] | 2015 | 7.05% | |
| 10 | London | 8,908,081[8] | 2015 | 13.19% | |
| 11 | Dhaka | 8,906,039 [9] | 2011 | 5.52% | |
| 12 | Lima | 8,852,000[10] | 2012 | 26.74% | |
| 13 | Tehran | 8,693,706 | 2014 | 10.53% | |
| 14 | Bangkok | 8,305,218[11] | 2010 | 11.96% | |
| 15 | Hanoi | 7,781,631[12] | 2014 | 8.14% | |
| 16 | Riyadh | 7,676,654[13] | 2009 | 22.43% | |
| 17 | Hong Kong | 7,482,500[14] | 2018 | 100% | |
| 18 | Bogotá | 7,181,469[15] | 2011 | 14.88% | |
| 19 | Baghdad | 6,719,500[16] | 17.48% | ||
| 20 | Santiago | 6,310,000[17] | 2012 | 35.9% | |
| 21 | Singapore | 5,638,700[18] | 2015 | 100% | |
| 22 | Ankara | 5,445,026 | 2014 | 6.64% | |
| 23 | Berlin | 3,748,148[19] | 2012 | 4.51% | |
| 24 | Damascus | 3,500,000 | 15.32% | ||
| 25 | Algiers | 3,415,811 | 8.45% | ||
| 26 | Madrid | 3,233,527[20] | 2012 | 6.84% | |
| 27 | Pyongyang | 3,144,005 | 12.63% | ||
| 28 | Kabul | 3,140,853 | 10.28% | ||
| 29 | Nairobi | 3,138,369 | 2010 | 7.67% | |
| 30 | Addis Ababa | 3,040,740[21] | 2012 | 3.31% | |
| 31 | Buenos Aires | 2,891,082[22] | 2010 | 7.16% | |
| 32 | Rome | 2,868,104[23] | 2014 | 4.72% | |
| 33 | Kiev | 2,847,200[24] | 2013 | 6.26% | |
| 34 | Yaoundé | 2,765,568 [25] | 2015 | 11.65% | |
| 35 | Taipei | 2,668,572[26] | 2018 | 11.31% | |
| 36 | Brasília | 2,648,532[27] | 2012 | 1.33% | |
| 37 | Amman | 2,600,603 | 40.26% | ||
| 38 | Luanda | 2,453,779 | 11.43% | ||
| 39 | Guatemala City | 2,450,212 | 2008 | 11.11% | |
| 40 | Pretoria | 2,345,908 | 4.43% | ||
| 41 | Paris | 2,241,346[28] | 2014 | 3.38% | |
| 42 | Tashkent | 2,207,850 | 7.30% | ||
| 43 | Baku | 2,204,200[29] | 2015 | 22.96% | |
| 44 | Havana | 2,135,498[30] | 2010 | 18.93% | |
| 45 | Phnom Penh | 2,011,725 | 13.29% | ||
| 46 | Islamabad | 2,001,579 | 1% | ||
| 47 | Bucharest | 1,942,254[31] | 9.73% | ||
| 48 | Khartoum | 1,840,661 | 4.59% | ||
| 49 | Caracas | 1,838,939 | 6.05% | ||
| 50 | Brazzaville | 1,827,000 | 2014 | 39.19% | |
| 51 | Rabat | 1,789,635 | 5.42% | ||
| 52 | Manila | 1,780,148[32] | 2015 | 1.64% | |
| 53 | Vienna | 1,749,673[33] | 2013 | 20.65% | |
| 54 | Budapest | 1,729,040[34] | 2011 | 17.34% | |
| 55 | Warsaw | 1,711,324[35] | 2012 | 4.42% | |
| 56 | Minsk | 1,702,061 | 17.98% | ||
| 57 | Kampala | 1,659,600 | 4.42% | ||
| 58 | Accra | 1,640,507 | 6.33% | ||
| 59 | Antananarivo | 1,613,375[36] | 7.04% | ||
| 60 | Beirut | 1,574,387 | 35.25% | ||
| 61 | Quito (de jure) Guayaquil (de facto) seat-of-government | 1,504,991 | 9.65% | ||
| 62 | Harare | 1,487,028 | 10.51% | ||
| 63 | Doha | 1,450,000 | 92%[37] | ||
| 64 | Sana'a | 1,431,649 | 5.87% | ||
| 65 | Conakry | 1,399,981 | 11.91% | ||
| 66 | Kuala Lumpur | 1,381,830 | 4.65% | ||
| 67 | Montevideo | 1,369,797 | 40.21% | ||
| 68 | Lusaka | 1,331,254 | 9.16% | ||
| 69 | Bamako | 1,289,626 | 8.43% | ||
| 70 | Sofia | 1,277,000 | 2019 | 15.02% | |
| 71 | Prague | 1,241,664[38] | 2011 | 11.83% | |
| 72 | Port-au-Prince | 1,235,227 | 11.97% | ||
| 73 | Tripoli | 1,184,045 | 19.09% | ||
| 74 | Dublin | 1,173,179 | 24.63% | ||
| 75 | Kuwait City | 1,171,880 | 34.78% | ||
| 76 | Belgrade | 1,154,589 | 16.12% | ||
| 77 | Santo Domingo | 1,111,838[39] | 2010 | 11.10% | |
| 78 | Mogadishu | 1,097,133 | 10.45% | ||
| 79 | Yerevan | 1,080,487[36] | 36.29% | ||
| 80 | Maputo | 1,076,689 | 4.17% | ||
| 81 | Freetown | 1,070,200 | 17.57% | ||
| 82 | Tbilisi | 1,044,993 | 23.34% | ||
| 83 | Dakar | 1,030,594 | 7.29% | ||
| 84 | Nur-Sultan | 1,029,556 | 2017 | 5.67% | |
| 85 | Monrovia | 1,010,970 | 23.54% | ||
| 86 | Ouagadougou | 1,005,231 | 5.94% | ||
| 87 | Kathmandu | 1,003,285 | 2011[40] | 3.69% | |
| 88 | Stockholm | 962,154[41] | 2018 | 9.41% | |
| 89 | Ottawa | 934,243[42] | 2016 | 2.55% | |
| 90 | Jerusalem[43] | 927,000[44] | 10.1% | ||
| 91 | Managua | 926,883 | 15.24% | ||
| 92 | Naypyidaw[45] | 925,000[46] | 1.74% | ||
| 93 | Ulaanbaatar | 907,802 | 31.98% | ||
| 94 | Lilongwe | 902,388 | 5.52% | ||
| 95 | Amsterdam | 855,965[47] | 4.97% | ||
| 96 | Bishkek | 843,240 | 14.74% | ||
| 97 | Lomé | 824,738 | 12.10% | ||
| 98 | Panama City | 813,097 | 21.04% | ||
| 99 | Zagreb | 804,200[48] | 18.91% | ||
| 100 | Muscat | 797,000[49] | 21.94% | ||
| 101 | Niamey | 794,814[50] | 4.46% | ||
| 102 | Chişinău | 794,800 [51] | 22.33% | ||
| 103 | Copenhagen | 794,128[52] | 2020 | 13.64% | |
| 104 | Abuja | 778,567 | [53] | 0.45% | |
| 105 | Tunis | 767,629 | 7.05% | ||
| 106 | Tirana | 763,634 | 27.53% | ||
| 107 | Ashgabat | 763,537 | 14.57% | ||
| 108 | N'Djamena | 751,288 | 5.86% | ||
| 109 | Tegucigalpa | 735,982 | 9.09% | ||
| 110 | Bangui | 731,548 | 14.79% | ||
| 111 | Nouakchott | 719,167 | 18.49% | ||
| 112 | Kigali | 718,414 | 6.10% | ||
| 113 | Riga | 713,016 | 35.42% | ||
| 114 | Kingston | 701,063 | 25.82% | ||
| 115 | Asmara | 694,000 | 14.49% | ||
| 116 | Athens | 664,046 | 2011 | 6.17% | |
| 117 | Washington, D.C. | 658,893 | 2014 | 0.21% | |
| 118 | Oslo | 645,701[54] | 2013 | 12.70% | |
| 119 | Helsinki | 635,591[55] | 2016 | 11.55% | |
| 120 | Abu Dhabi | 585,097[56] | 6.27% | ||
| 121 | Dushanbe | 582,496 | 7.10% | ||
| 122 | Lisbon | 564,657 | 5.40% | ||
| 123 | Vilnius | 556,723 | 18.83% | ||
| 124 | Libreville | 556,425 | 33.28% | ||
| 125 | San Salvador | 521,366 | 8.22% | ||
| 126 | Skopje | 521,000 | 25% | ||
| 127 | Asunción | 520,722 | 7.66% | ||
| 128 | Macau | 520,400[57] | 100% | ||
| 129 | Djibouti (city) | 475,332 | 54.45% | ||
| 130 | Yamoussoukro | 454,929 | 2.24% | ||
| 131 | Bissau | 452,640 | 26.56% | ||
| 132 | Tallinn | 440,206[58] | 33.22% | ||
| 133 | Bratislava | 424,207 | 7.84% | ||
| 134 | San Juan | 421,356 | 12.37% | ||
| 135 | Canberra | 410,301 | 2017 | 1.61% | |
| 136 | Sarajevo | 395,133 | 2013 | 11.19% | |
| 137 | Juba | 372,410 | 3.30% | ||
| 138 | San José | 328,195 | 6.74% | ||
| 139 | Port Moresby | 299,396[59] | 4.09% | ||
| 140 | Vientiane | 287,579 | 4.25% | ||
| 141 | Dodoma | 287,200 | 2002 est.[60] | 0.80% | |
| 142 | Ljubljana | 280,140 | 13.60% | ||
| 143 | Nicosia | 270,000 | late 2004[61] | 26.57% | |
| 144 | Maseru | 267,652[59] | 12.91% | ||
| 145 | Sucre | 261,201[62] | 2.52% | ||
| 146 | Paramaribo | 254,147 | 47.13% | ||
| 147 | Windhoek | 252,721 | 10.97% | ||
| 148 | Nassau | 248,948 | 65.97% | ||
| 149 | Gaborone | 225,656[63] | 11.17% | ||
| 150 | Porto-Novo | 223,552 | [64] | 2.17% | |
| 151 | Wellington | 215,400 | June 2019[65] | 4.38% | |
| 152 | Prishtina | 198,214 | 10.32% | ||
| 153 | El Aaiún (claimed) Tifariti (factual) | 194,668 3,000 [66] | 2009 |
--- | |
| 154 | Tiraspol | 159,163 | 28.53% | ||
| 155 | Brussels | 148,873[67] | 1.40% | ||
| 156 | Port Louis | 147,251[68] | 12.28% | ||
| 157 | Podgorica | 141,854 | 22.83% | ||
| 158 | Manama | 140,616 | 10.56% | ||
| 159 | Georgetown | 134,599 | 16.83% | ||
| 160 | Praia | 125,464 | 25.15% | ||
| 161 | Berne (de facto) | 121,631 | [69] | 1.51% | |
| 162 | Luxembourg | 119,214[70] | 19.41% | ||
| 163 | Sri Jayawardenepura Kotte | 115,826[71] | 0.53% | ||
| 164 | Reykjavík | 115,000[72] | 35.60% | ||
| 165 | Bridgetown | 110,000 | 39.06% | ||
| 166 | Malé | 103,693 | 30.05% | ||
| 167 | Thimphu | 101,259 | 13.43% | ||
| 168 | Malabo | 100,677 [73] | 13.30% | ||
| 169 | Nouméa | 89,207[74] | 32.03% | ||
| 170 | Suva | 84,410[74] | 9.58% | ||
| 171 | Mbabane | 81,594 | 6.53% | ||
| 172 | Castries | 70,000[75] | 38.40% | ||
| 173 | Saipan | 62,392 (2000)[76] | 100% | ||
| 174 | Moroni | 60,200 | 8.19% | ||
| 175 | Honiara | 59,288[74] | 10.56% | ||
| 176 | Dili | 59,069 | 5.01% | ||
| 177 | São Tomé | 56,166 | 29.10% | ||
| 178 | Pago Pago | 52,000 (2003)[77] | 6.57% | ||
| 179 | Port of Spain | 50,479 | 3.76% | ||
| 180 | Stepanakert | 49,986 | 36.57% | ||
| 181 | Willemstad | 49,885 [78] | 93.74% | ||
| 182 | Gitega | 41,944[79] | 2008 | 0.40% | |
| 183 | Kingstown | 40,020 | 36.59% | ||
| 184 | Apia | 39,813[80] | 20.91% | ||
| 185 | Port Vila | 38,000 [81] | 15.03% | ||
| 186 | Monaco | 35,986[82] | 2011 est. | 100% | |
| 187 | Banjul | 34,828 | 1.88% | ||
| 188 | Tarawa | 30,000[83] | 29.31% | ||
| 189 | Oranjestad | 29,998[84] | --- | ||
| 190 | Victoria | 29,298 | 32.86% | ||
| 191 | Gibraltar | 29,286 | --- | ||
| 192 | Saint Helier | 28,380 | --- | ||
| 193 | Bandar Seri Begawan | 28,135 | 6.73% | ||
| 194 | George Town | 26,798 | 41.1% | ||
| 195 | Douglas | 26,600 | --- | ||
| 196 | Papeete | 26,200 [85] | --- | ||
| 197 | Ramallah (de facto) | 25,500[86] | 0.53% | ||
| 198 | Majuro | 25,400 | 48.26% | ||
| 199 | Andorra la Vella | 22,884 | 28.89% | ||
| 200 | St. John's | 22,679[87] | 25.20% | ||
| 201 | Nukuʻalofa | 22,400 | 21.27% | ||
| 202 | Tórshavn | 18,573 [88] | --- | ||
| 203 | St. Peter Port | 16,701 | --- | ||
| 204 | Belmopan | 16,451[89] | 4.96% | ||
| 205 | Nuuk (Godthåb) | 15,469 | 31.85% | ||
| 206 | Roseau | 14,847 [90] | 20.62% | ||
| 207 | Basseterre | 13,043 | 24.07% | ||
| 208 | Mariehamn | 11,296 [91] | --- | ||
| 209 | Charlotte Amalie | 10,817 | --- | ||
| 210 | Palikir | 9,900 | 9.56% | ||
| 211 | Road Town | 9,400 | --- | ||
| 212 | St. George's | 7,500 | 7.08% | ||
| 213 | Valletta | 6,444[92] | 2014 | 1.45% | |
| 214 | Gustavia | 6,000 | --- | ||
| 215 | Collectivity of Saint Martin (France) | Marigot | 5,700 | --- | |
| 216 | Saint-Pierre | 5,509 | --- | ||
| 217 | Avarua | 5,445 | --- | ||
| 218 | Vaduz | 5,248 | 14.21% | ||
| 219 | City of San Marino | 4,493 | 13.47% | ||
| 220 | Funafuti | 4,492 | 45.48% | ||
| 221 | Cockburn Town | 3,700 | --- | ||
| 222 | Stanley | 2,115 [93] | --- | ||
| 223 | Longyearbyen | 2,075 | --- | ||
| 224 | Flying Fish Cove | 1,493 [94] | --- | ||
| 225 | Philipsburg | 1,338 | --- | ||
| 226 | Mata-Utu | 1,191 | --- | ||
| 227 | The Valley | 1,169 | --- | ||
| 228 | Yaren (de facto) | 1,100 | 10.91% | ||
| 229 | Hagåtña | 1,100 | --- | ||
| 230 | Hamilton | 854 [95] | 2016 | 1.34% | |
| 231 | Vatican City (city-state) | 826 (2009 est.)[96] | 100% | ||
| 232 | Jamestown | 714 | --- | ||
| 233 | Alofi | 616 | --- | ||
| 234 | Atafu | 524 | 34.96% | ||
| 235 | Brades (de facto) | 391 | --- | ||
| 236 | Ngerulmud | 271 | 1.87% | ||
| 237 | West Island | 120 | 22.06% | ||
| 238 | Adamstown | 56 | 100% | ||
| 239 | King Edward Point | 22 | 69% | ||
| 240 | Kingston (de facto) | n/a[97] |
See also
- Capital (political)
- List of countries whose capital is not their largest city
- List of capitals outside the territories they serve
- List of national capitals by latitude
- List of countries by population
- List of towns and cities with 100,000 or more inhabitants
- List of population concern organizations
- List of national capitals
Notes and references
- "China Statistical Yearbook 2018". www.stats.gov.cn. Retrieved 2019-07-24.
- "Tokyo Statistical Yearbook". Tokyo Metropolitan Government.
- "Russia 2012 Statistical Pocketbook" (PDF). Federal State Statistics Service (Rosstat). p. 5. Retrieved 21 December 2012.
- "DemographiaWorld Urban Areas - 8th Annual Edition" (PDF). Demographia. April 2012. Retrieved 25 June 2012.
- "Jumlah Penduduk Provinsi DKI Jakarta" (in Indonesian). Dinas Kependudukan dan Catatan Sipil Provinsi DKI Jakarta. Archived from the original on 26 June 2013. Retrieved 21 December 2012.
- "Seoul Statistics". Seoul Metropolitan Government. Retrieved 3 December 2015.
- "México en Cifras" (in Spanish). Instituto Nacional de Estadística y Geografía (INEGI). Retrieved 5 September 2019.
- "Population Growth in London, 1939-2015". London Datastore. Greater London Authority. Archived from the original on February 19, 2015. Retrieved 7 July 2015. Alt URL
- "Population & Housing Census-2011" (PDF). Bangladesh Bureau of Statistics. p. 41. Archived from the original (PDF) on 8 December 2015. Retrieved 20 October 2015.
- "Estado de la población peruana 2012" (PDF) (in Spanish). INEI - Instituto Nacional de Estadística e Informática. Retrieved 16 May 2013.
- "Table 1: Number of population and sex ratio (males per 100 females) by region, province and area" (PDF). National Statistics Office of the Kingdom of Thailand. Archived from the original (PDF) on 1 May 2016. Retrieved 21 December 2012.
- VnExpress – Ha Noi co 3,4 trieu nguoi Archived 2010-01-04 at the Wayback Machine Also aligns with who.int figure.
- "ArRiyadh Urban Indicators 2009 / 1430 H". Ar-Riyadh Development Authority. 24 September 2012. Retrieved 22 December 2012.
- "Hong Kong Statistics". Census and Statistics Department. The Government of the Hong Kong Special Administrative Region.
- "Reloj de Poblacion" (in Spanish). secretaria distrital de planeacion (SDP). Retrieved 21 December 2012.
- Estimates of total population differ substantially. The Encyclopædia Britannica gives a 2001 population of 4,950,000, the 2006 Lancet Report states a population of 7,216,040 in 2011.
- "Baghdad" Encyclopædia Britannica. 2006. Encyclopædia Britannica Online. 13 November 2006.
- "Mortality after the 2003 invasion of Iraq: a cross-sectional cluster sample survey" (PDF). (242 KB). By Gilbert Burnham, Riyadh Lafta, Shannon Doocy, and Les Roberts. The Lancet, October 11, 2006
- Baghdad from GlobalSecurity.org
- "Santiago: Población total estimada al 30 de Junio, por sexo. 1990-2020" (in Spanish). Instituto Nacional de Estadística de Chile (INE). Retrieved 5 January 2013.
- "Population & Land Area (Mid-Year Estimates)". Statistics Singapore. Archived from the original on 2015-11-29. Retrieved 4 December 2015.
- "Population - Berlin". Federal Statistical Office and the statistical Offices of the Länder. Archived from the original on 17 September 2016. Retrieved 5 January 2013.
- "Madrid: Población por municipios y sexo". Instituto Nacional de Estadística (INE). Archived from the original on 7 January 2013. Retrieved 5 January 2013.
- "Population Size of Towns by Sex, Region, Zone and Wereda : July 2012". Central Statistical Agency of Ethiopia. Archived from the original on 30 March 2013. Retrieved 6 January 2013.
- "Censo 2010. Resultados provisionales: cuadros y gráficos" (in Spanish). Instituto Nacional de Estadística y Censos (INDEC). Archived from the original on 20 December 2010. Retrieved 5 January 2013.
- "Demographic Balance for the year 2014 May (provisional data)". Istat - Istituto Nazionale di Statistica. Retrieved 21 November 2014.
- "Соціально-економічне становище м.Києва: Січень–липень 2013 року". Department of Statistics, Kiev City State Administration. July 2013. Retrieved 1 September 2013.
- "Cameroun • Fiche pays • PopulationData.net". populationdata.net.
- "Monthly Bulletin of Interior Statistics, Republic of China (Taiwan)". Taiwan Ministry of Interior.
- "IBGE divulga as estimativas populacionais dos municípios em 2012" (in Portuguese). Instituto Brasileiro de Geografia e Estatística (IBGE). Retrieved 22 December 2012.
- "Évolution de la population au 1er janvier 2014". INSEE. Retrieved 4 December 2015.
- Bölmə 2: Demoqrafik göstəricilər, səhifə 89. // Azərbaycanın Statistik Göstəriciləri 2015 (statistik məcmuə). Müəllifi: Azərbaycan Respublikası Dövlət Statistika Komitəsi. Məcmuənin ümumi rəhbəri: Həmid Bağırov; Məcmuənin hazırlanması üçün məsul şəxs: Rafael Süleymanov. Bakı — 2015, 814 səhifə.
- "Población por municipios y por ciento respecto a la provincia, en orden descendente, año 2010" (in Spanish). Oficina Nacional de Estadísticas (Cuba). Retrieved 2 January 2012.
- "Largest Romanian cities in 2010" (in Romanian). evz.ro. August 28, 2011. Retrieved August 28, 2011.
- "Philippine Population Density (Based on the 2015 Census of Population)". Philippine Statistics Authority. Retrieved November 2, 2017.
- "Bevölkerung zu Quartalsbeginn seit 2002 nach Bundesland" (in German). Statistik Austria. Retrieved 10 August 2013.
- "Regional data – Budapest". Hungarian Central Statistics Office. Retrieved 10 August 2013.
- "Population in Poland. Size and Structure By Territorial Division" (PDF). Central Statistics Office of Poland. 30 June 2012. Retrieved 10 August 2013.
- "World cities with more than 1 million people in 2005". mongabay.com.
- "Ministry of Development Planning and Statistics". Retrieved 2019-12-07.
- "Statistical Yearbook of Prague 2012: 4-1. Selected demographic data in the Capital City of Prague". Czech Statistical Office. Retrieved 15 August 2013.
- "Poblacion estimada y proyectada región provincia y municipio 2000-2010" (in Spanish). Oficina Nacional de Estadística (ONE). Archived from the original on 24 June 2012. Retrieved 15 August 2013.
- "Archived copy" (PDF). Archived from the original (PDF) on 2016-03-26. Retrieved 2016-04-12.CS1 maint: archived copy as title (link)
- http://www.statistikdatabasen.scb.se/pxweb/en/ssd/START__BE__BE0101__BE0101A/FolkmangdNov/
- "Census Profile, 2016 Census - Ottawa, Census division". 2.statcan.gc.ca. Retrieved 2019-03-05.
- The Jerusalem Law states that "Jerusalem, complete and united, is the capital of Israel" and the city serves as the seat of the government, home to the President's residence, government offices, supreme court, and parliament. The United Nations and most countries do not accept the Jerusalem Law (see Kellerman 1993, p. 140) and maintain their embassies in other cities such as Tel Aviv, Ramat Gan, and Herzliya (see the CIA Factbook and Map of Israel) The Palestinian Authority sees East Jerusalem as the capital of a future Palestinian state and the city's final status awaits future negotiations between Israel and the Palestinian Authority (see "Negotiating Jerusalem", University of Maryland Archived 2006-05-14 at the Wayback Machine). See Positions on Jerusalem for more information.
- "Population of Localities Numbering Above 1,000 Residents" (PDF). Israel Central Bureau of Statistics. 2008-12-31. Retrieved 2009-06-03.
- "Burma's new capital stages parade". BBC News. 2006-03-27. Retrieved 2006-06-24.
- "Business big in Myanmar capital". FIN24. 29 April 2007. Retrieved 2 January 2010.
- Gemeente Amsterdam; Onderzoek, Informatie en Statistiek. "Onderzoek, Informatie en Statistiek". Ois.amsterdam.nl. Retrieved 2019-03-05.CS1 maint: multiple names: authors list (link)
- "Archived copy". Archived from the original on 2008-09-10. Retrieved 2008-08-29.CS1 maint: archived copy as title (link)
- "Population Of Muscat". population-of.com.
- http://www.mongabay.com/igapo/2005_world_city_populations/2005_city_population_02.htm%5B%5D
- Statistică, Biroul Naţional de (22 March 2012). "// Comunicate de presă". www.statistica.md.
- "Population at the first day of the quarter by region and time". Statistics Denmark. 1 January 2020. Retrieved 18 February 2020.
- "Archived copy" (PDF). Archived from the original (PDF) on 2007-07-04. Retrieved 2007-06-29.CS1 maint: archived copy as title (link)
- Statistisk Sentrabyrå 2014Q4 https://www.ssb.no/statistikkbanken/selectout/ShowTable.asp?FileformatId=2&Queryfile=201532325922714528369Rd1222Kv&PLanguage=0&MainTable=Rd1222Kv&potsize=1%5B%5D
- http://pxnet2.stat.fi/PXWeb/pxweb/fi/StatFin/StatFin__vrm__vamuu/005_vamuu_tau_101.px/table/tableViewLayout1/?rxid=c15f3d65-7401-4057-9ae4-3454248f451c%5B%5D
- "World cities with 400,000 to 600,000 people in 2005". mongabay.com.
- http://www.dsec.gov.mo/index.asp?src=/english/indicator/e_dem_indicator_1.html Archived 2008-10-02 at the Wayback Machine
- "Tallinna elanike arv". www.tallinn.ee.
- "World cities with 250,000 to 300,000 people in 2005". mongabay.com.
- "Archived copy". Archived from the original on 2008-11-18. Retrieved 2009-02-18.CS1 maint: archived copy as title (link)
- "The press statement of Prime Minister Ferdi Sabit Soyer on the tentative results of 2006 population and housing census (5 May 2006)" (PDF). devplan.org.
- es:Departamento de Chuquisaca#cite note-8
- "World cities with 200,000 to 250,000 people in 2005". mongabay.com.
- "Vermiculture for organic waste processing: mini-livestock in Rosario, Argentina". ruaf.org. 5 February 2014. Archived from the original on 11 August 2017. Retrieved 20 February 2009.
- "Subnational Population Estimates: At 30 June 2019". Statistics New Zealand. 22 October 2019. Retrieved 11 January 2020.
- "Archived copy". Archived from the original on 2007-10-01. Retrieved 2010-02-03.CS1 maint: archived copy as title (link)
- City of Brussels Municipality
- "World cities with 125,000 to 150,000 people in 2005". mongabay.com.
- "Population Of Bern". population-of.com.
- {{cite web|url="Statisiques sur la Ville de Luxembourg: Etat de Population - 2018" (PDF). www.vdl.lu (in French). Ville de Luxembourg. Retrieved 25 January 2019.
- "Population of Cities in Sri Lanka (2019)". worldpopulationreview.com.
- "Archived copy". Archived from the original on 2007-07-09. Retrieved 2009-04-03.CS1 maint: archived copy as title (link)
- "World cities with 100,000 to 110,000 people in 2005". mongabay.com.
- "World cities with 80,000 to 90,000 people in 2005". mongabay.com.
- "Saint Lucia Facts - Saint Lucia Information - Saint Lucia Statistics - Saint Lucia". www.phrasebase.com.
- Census Bureau Releases, Census 2000 Population Counts for the Commonwealth of the Northern Mariana Islands Archived 2010-03-27 at the Wayback Machine, July 3, 2001.
- American Samoa at the MSN Encyclopedia. Archived from the original on 2009-10-29.
- "World cities with 45,000 to 50,000 people in 2005". mongabay.com.
- "Burundi Annual Statistics 2017" (PDF). isteebu.bi/index.php/publications/annuaires-statistiques.
- "World cities with 35,000 to 40,000 people in 2005". mongabay.com.
- "Port Vila – Vanuatu: An Overview". zimbio.com.
- "Monaco". CIA World Factbook. Archived from the original on 2009-03-11.
- "Kiribati". state.gov.
- "Selected cities with 25,000 to 30,000 people in 2005". mongabay.com.
- "Answers - The Most Trusted Place for Answering Life's Questions". Answers.com.
- Palestinian Central Bureau of Statistics "Archived copy". Archived from the original on 2009-03-04. Retrieved 2009-04-14.CS1 maint: archived copy as title (link)
- "Selected cities with 20,000 to 25,000 people in 2005". mongabay.com.
- "Selected cities with 15,000 to 20,000 people in 2005". mongabay.com.
- Grønlands Statistik; see especially this pdf.
- "Selected cities with 10,000 to 15,000 people in 2005". mongabay.com.
- "Archived copy". Archived from the original on 2012-08-01. Retrieved 2012-03-27.CS1 maint: archived copy as title (link)
- "Estimated Population by Locality 31st March, 2014". Government of Malta. 16 May 2014. Archived from the original on 21 June 2015.
- Falkland Islands Government Archived 2008-10-24 at the Wayback Machine
- DOO, CP Development. "and comparison". www.citycomparator.com.
- "2016 Population and Housing Census Report" (PDF). Government of Bermuda, Department of Statistics. Retrieved 11 March 2020.
- "The World Factbook — Central Intelligence Agency". www.cia.gov.
- The population of the locality of Kingston is not reported by the Australian Bureau of Statistics.
Bibliography
- Kellerman, Aharon (1993). Society and Settlement: Jewish Land of Israel in the Twentieth Century. State University of New York Press. ISBN 978-0-7914-1295-4.CS1 maint: ref=harv (link)
This article is issued from Wikipedia. The text is licensed under Creative Commons - Attribution - Sharealike. Additional terms may apply for the media files.