Demographics of Costa Rica
This article is about the demographic features of the population of Costa Rica, including population density, ethnicity, education level, health of the populace, economic status, religious affiliations and other aspects of the population.
| Demographics of Costa Rica | |
|---|---|
| Population | 4,999,441[1][2] |
According to the United Nations, in 2018 Costa Rica had an estimated population of 4,999,441 people. White and Mestizos make up 83.4% of the population, 7% are black people (including mixed race), 2.4% Amerindians, 0.2% Asians, and 7% other/none.[3]
In 2010, just under 3% of the population is of black African descent who are called Afro-Costa Ricans or West Indians and are English-speaking descendants of 19th-century black Jamaican immigrant workers. Another 1% is composed of ethnic Chinese, and less than 1% are Middle Easterners, mainly of Lebanese descent but also Palestinians. The 2011 Census provided the following data: whites and mestizos make up 83.4% of the population, 7% are black people (including mixed race), 2.4% Amerindians, 0.2% Asians, and 7% other/none.[3]
There is also a community of North American retirees from the United States and Canada, followed by fairly large numbers of European Union expatriates (esp. Scandinavians and from Germany) come to retire as well, and Australians. Immigration to Costa Rica made up 9% of the population in 2012. This included permanent settlers as well as migrants who were hoping to reach the U.S.[4] In 2015, there were some 420,000 immigrants in Costa Rica[5] and the number of asylum seekers (mostly from Honduras, El Salvador, Guatemala and Nicaragua) rose to more than 110,000.[6] An estimated 10% of the Costa Rican population in 2014 was made up of Nicaraguans.[7]
The indigenous population today numbers about 60,000 (just over 1% of the population) with some Miskito and Garifuna (a population of mixed black African and Carib Indian descent) living in the coastal regions.
Costa Rica's emigration is the smallest in the Caribbean Basin and is among the smallest in the Americas. By 2015 about just 133,185 (2.77%) of the country's people live in another country as immigrants. The main destination countries are the United States (85,924), Nicaragua (10,772), Panama (7,760), Canada (5,039), Spain (3,339), Mexico (2,464), Germany (1,891), Italy (1,508), Guatemala (1,162) and Venezuela (1,127).[8]
Population and ancestry
| Costa Rican Censuses | ||
|---|---|---|
| Year | Population | %± |
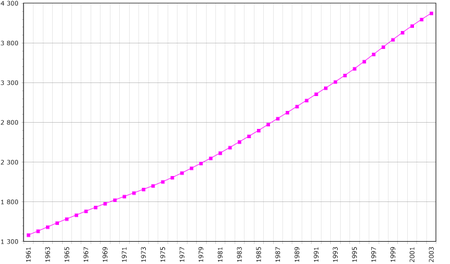
| 1864 | 120,499 | — |
| 1883 | 182,073 | 51.1 |
| 1892 | 243,205 | 33.6 |
| 1927 | 471,524 | 93.9 |
| 1950 | 800,875 | 69.8 |
| 1963 | 1,336,274 | 66.9 |
| 1973 | 1,871,780 | 40.1 |
| 1984 | 2,416,809 | 29.1 |
| 2000 | 3,810,179 | 57.7 |
| 2011 | 4,301,712 | 12.9 |
In 2018, Costa Rica had a population of 4,999,441. The population is increasing at a rate of 1.5% per year. At current trends the population will increase to 9,158,000 in about 46 years.[9] The population density is 94 people per square km, the third highest in Central America.
Approximately 40% lived in rural areas and 60% in urban areas. The rate of urbanization estimated for the period 2005–2015 is 2.74% per annum,[10] one of the highest among developing countries. About 75% of the population live in the upper lands (above 500 meters) where temperature is cooler and milder.
The 2011 census counted a population of 4.3 million people[11] distributed among the following groups: 83.6% whites or mestizos, 6.7% black mixed race, 2.4% Native American, 1.1% black or Afro-Caribbean; the census showed 1.1% as Other, 2.9% (141,304 people) as None, and 2.2% (107,196 people) as unspecified.[12]
In 2011, there were over 104,000 Native American or indigenous inhabitants, representing 2.4% of the population. Most of them live in secluded reservations, distributed among eight ethnic groups: Quitirrisí (in the Central Valley), Matambú or Chorotega (Guanacaste), Maleku (northern Alajuela), Bribri (southern Atlantic), Cabécar (Cordillera de Talamanca), Guaymí (southern Costa Rica, along the Panamá border), Boruca (southern Costa Rica) and Térraba (southern Costa Rica).
The population includes European Costa Ricans (of European ancestry), primarily of Spanish descent,[13] with significant numbers of Italian, German, English, Dutch, French, Irish, Portuguese, and Polish families, as well a sizable Jewish community. The majority of the Afro-Costa Ricans are Creole English-speaking descendants of 19th century black Jamaican immigrant workers.
The 2011 census classified 83.6% of the population as white or Mestizo; the latter are persons of combined European and Amerindian descent. The Mulatto segment (mix of white and black) represented 6.7% and indigenous people made up 2.4% of the population.[13] Native and European mixed blood populations are far less than in other Latin American countries. Exceptions are Guanacaste, where almost half the population is visibly mestizo, a legacy of the more pervasive unions between Spanish colonists and Chorotega Amerindians through several generations, and Limón, where the vast majority of the Afro-Costa Rican community lives.
| Province | Province population | City | City population |
|---|---|---|---|
| San José Province | 1,345,750 | San José | 350,535 |
| Alajuela Province | 716,286 | Alajuela | 46,554 |
| Cartago Province | 432,395 | Cartago | 156,600 |
| Puntarenas Province | 357,483 | Puntarenas | 102,504 |
| Heredia Province | 354,732 | Heredia | 42,600 |
| Limón Province | 339,395 | Puerto Limon | 105,000 |
| Guanacaste Province | 264,238 | Liberia | 98,751 |
Education
According to the United Nations, Costa Rica's literacy rate stands at 95.8%,[14] the fifth highest among American countries. Costa Rica's Education Index in 2006 was 0.882; higher than that of richer countries, such as Singapore and Mexico. Costa Rica's gross enrolment ratio is 73.0%, smaller than that of the neighbors countries of El Salvador and Honduras.[15]
All students must complete primary school and secondary school, between 6 and 15 years. Some students drop out because they must work to help support their families. In 2007 there were 536,436 pupils enrolled in 3,771 primary schools and 377,900 students attended public and private secondary schools.[16]
Costa Rica's main universities are the University of Costa Rica, in San Pedro and the National University of Costa Rica, in Heredia. Costa Rica also has several small private universities.
Emigration
Costa Rica's emigration is among the smallest in the Caribbean Basin. About 3% of the country's people live in another country as immigrants. The main destination countries are the United States, Spain, Mexico and other Central American countries. In 2005, there were 127,061 Costa Ricans living in another country as immigrants. Remittances were $513,000,000 in 2006 and they represented 2.3% of the country's GDP.
Immigration
Costa Rica's immigration is among the largest in the Caribbean Basin. According to the 2011 census 385,899 residents were born abroad.[17] The vast majority were born in Nicaragua (287,766). Other countries of origin were Colombia (20,514), United States (16,898), Spain (16,482) and Panama (11,250). Outward Remittances were $246,000,000 in 2006.
Migrants
According to the World Bank, about 489,200 migrants lived in the country in 2010 mainly from Nicaragua, Panama, El Salvador, Honduras, Guatemala, and Belize, while 125,306 Costa Ricans live abroad in the United States, Panama, Nicaragua, Spain, Mexico, Canada, Germany, Venezuela, Dominican Republic, and Ecuador.[18] The number of migrants declined in later years but in 2015, there were some 420,000 immigrants in Costa Rica[5] and the number of asylum seekers (mostly from Honduras, El Salvador, Guatemala and Nicaragua) rose to more than 110,000, a fivefold increase from 2012.[6] In 2016, the country was called a "magnet" for migrants from South and Central America and other countries who were hoping to reach the U.S.[19][20]
European Costa Ricans
| Total population | |
|---|---|
| c. 3,597,000[21][22] | |
| Languages | |
| Costa Rican Spanish, English | |
| Religion | |
| Roman Catholic 76.3%, Evangelical 13.7%, other 4.8%, none 3.2%, Buddhism 2%[23] | |
| Related ethnic groups | |
| White Latin Americans, White Caribbeans |
European Costa Ricans are people from Costa Rica whose ancestry lies within the continent of Europe, most notably Spain. According to DNA studies, around 75%[24] of the population have some level of European ancestry.[21]
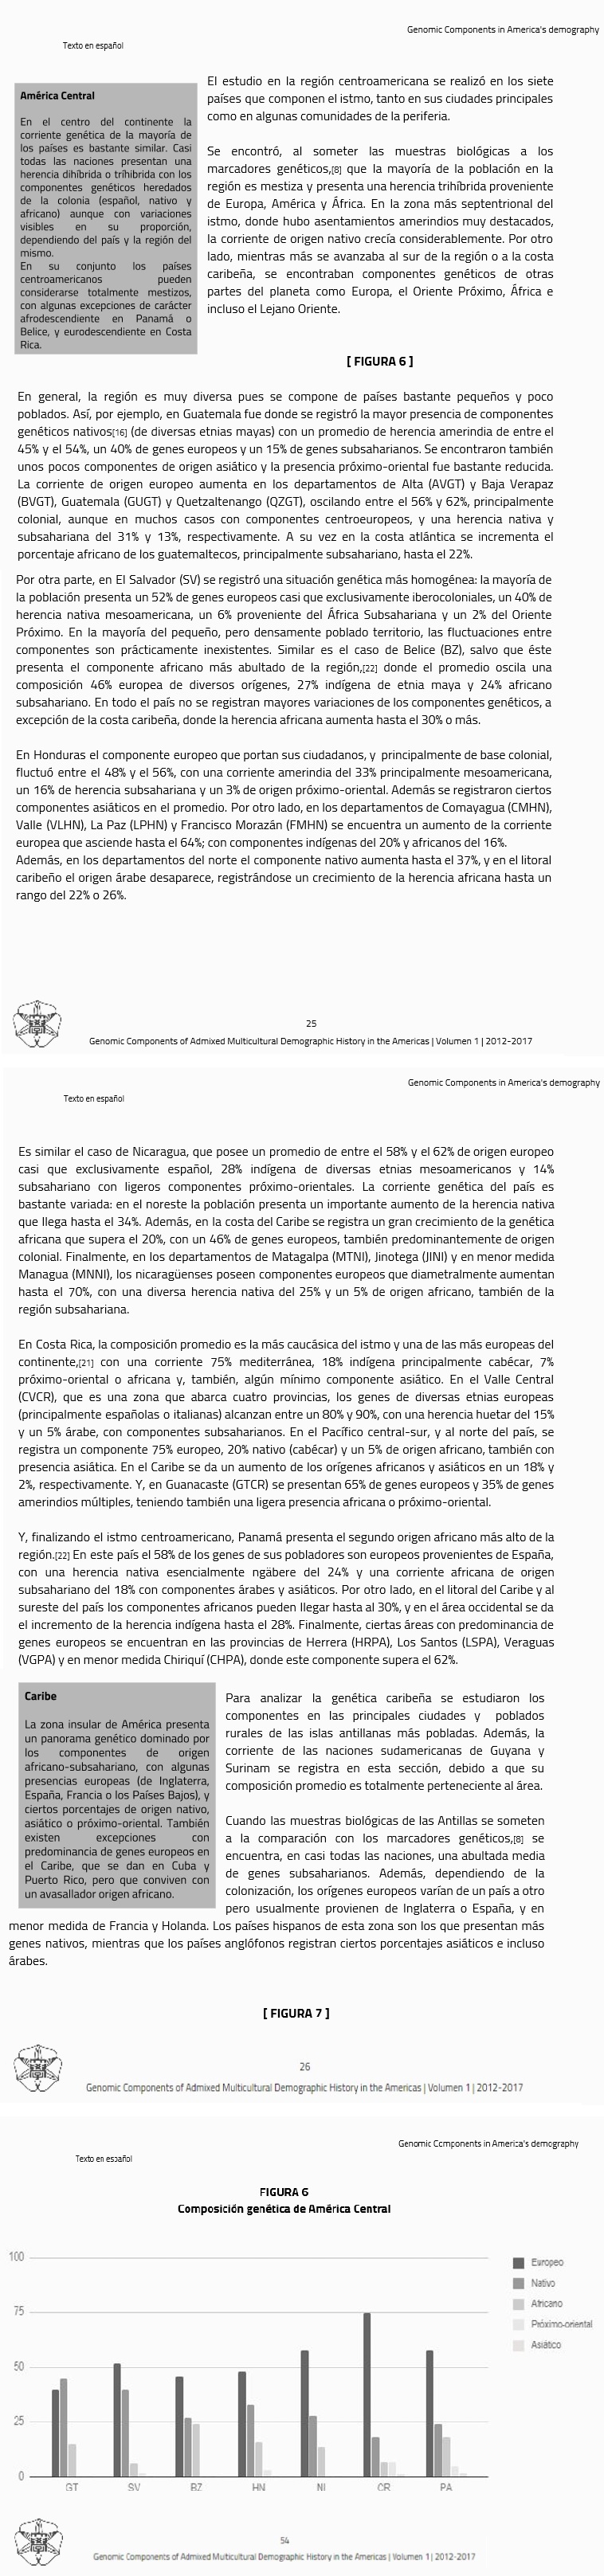
Percentages of the Costa Rican population by race are known as the national census does have the question of ethnicity included in its form. As for 2012 65.80% of Costa Ricans identify themselves as white/castizo and 13.65% as mestizo, giving around 80% of Caucasian population. This, however, is based in self-identification and not in scientific studies. According to PLoS Genetics Geographic Patterns of Genome Admixture in Latin American Mestizos study of 2012, Costa Ricans have 68% of European ancestry, 29% aboriginal and 3% African.[25] According to CIA Factbook, Costa Rica has white or mestizo population of the 83.6%.[13]
Cristopher Columbus and crew were the first Europeans ever to set foot on what is now Costa Rica in Columbus last trip when he arrived to Uvita Island (modern day Limón province) in 1502.[26] Costa Rica was part of the Spanish Empire and colonized by Spaniards mostly Castilians, Basque and Sefardi Jews. After the independence large migrations of wealthy Americans, Germans, French and British businessmen[26] came to the country encouraged by the government and followed by their families and employees (many of them technicians and professionals) creating colonies and mixing with the population, especially the high and middle classes.[27] Later, more humble migrations of Italians, Spanish (mostly Catalans) and Arab (mostly Lebanese and Syrians) migrants visit the country escaping economical crisis in their home countries, setting in large, more closed colonies.[26] Polish migrants, mostly Ashkenazi Jews escaping anti-Semitism and nazi persecution in Europe also migrated to the country in large numbers.[26] In 1901 president Ascensión Esquivel Ibarra closes the country to all non-white immigration forbidding the entrance of all Black African, Chinese, Arab, Turkish or Gypsy migration in the country. After the beginning of the Spanish Civil War large migration of Republican refugees also settle in the country, mostly Castilians, Galicians and Asturians,[27] as later Chilean, Mexican and Colombian[26] migrants would leave their countries traveling to Costa Rica escaping from war or dictatorships as Costa Rica is the longest running democracy in Latin America and unlike most of its neighbors had no dictatorship during the 20th century.[26][27]
Ethnic groups
The following listing is taken from a publication of the Costa Rica 2011 Census:[28]
- Mestizos and Whites - 3,597,847 = 83.64%
- Mulatto - 289,209 = 6.72%
- Indigenous - 104,143 = 2.42%
- Black/Afro-Caribbean - 45,228 = 1.05%
- Chinese/Asian - 9 170 = 0.21%
- Other - 36 334 = 0.84%
- Did not state - 95,140 = 2.21%
Vital statistics
| Average population [29][30] | Live births | Deaths | Natural change | Crude birth rate (per 1000) | Crude death rate (per 1000) | Natural change (per 1000) | TFR | |
|---|---|---|---|---|---|---|---|---|
| 1934 | 558,000 | 23,858 | 10,020 | 13,838 | 44.2 | 18.6 | 25.6 | |
| 1935 | 572,000 | 24,934 | 12,630 | 12,304 | 45.2 | 22.9 | 22.3 | |
| 1936 | 585,000 | 25,450 | 11,811 | 13,639 | 45.2 | 21.0 | 24.2 | |
| 1937 | 599,000 | 25,624 | 11,032 | 14,592 | 44.5 | 19.2 | 25.3 | |
| 1938 | 615,000 | 26,839 | 10,422 | 16,417 | 45.5 | 17.7 | 27.8 | |
| 1939 | 631,000 | 27,027 | 11,687 | 15,340 | 44.7 | 19.3 | 25.4 | |
| 1940 | 648,000 | 28,004 | 11,211 | 16,793 | 45.3 | 18.1 | 27.2 | |
| 1941 | 664,000 | 28,823 | 11,429 | 17,394 | 45.5 | 18.1 | 27.4 | |
| 1942 | 680,000 | 28,263 | 13,559 | 14,704 | 43.7 | 21.0 | 22.7 | |
| 1943 | 697,000 | 30,468 | 11,734 | 18,734 | 46.1 | 17.7 | 28.4 | |
| 1944 | 716,000 | 29,935 | 11,295 | 18,640 | 44.2 | 16.7 | 27.5 | |
| 1945 | 736,000 | 32,529 | 10,768 | 21,761 | 46.8 | 15.5 | 31.3 | |
| 1946 | 759,000 | 32,159 | 9,971 | 22,188 | 45.0 | 13.9 | 31.1 | |
| 1947 | 787,000 | 32,600 | 10,967 | 21,633 | 44.7 | 14.9 | 29.8 | |
| 1948 | 808,000 | 35,956 | 10,666 | 25,290 | 44.5 | 13.2 | 31.3 | |
| 1949 | 832,000 | 36,774 | 10,566 | 26,208 | 44.2 | 12.7 | 31.5 | |
| 1950 | 966,000 | 39,943 | 10,480 | 29,463 | 41.3 | 10.8 | 30.5 | |
| 1951 | 994,000 | 43,068 | 10,390 | 32,678 | 43.3 | 10.5 | 32.9 | |
| 1952 | 1,025,000 | 45,816 | 10,672 | 35,144 | 44.7 | 10.4 | 34.3 | |
| 1953 | 1,058,000 | 45,697 | 11,353 | 34,344 | 43.2 | 10.7 | 32.5 | |
| 1954 | 1,093,000 | 48,857 | 10,681 | 38,176 | 44.7 | 9.8 | 34.9 | |
| 1955 | 1,129,000 | 49,800 | 11,000 | 39,269 | 44.1 | 9.7 | 34.8 | |
| 1956 | 1,167,000 | 51,350 | 10,476 | 40,874 | 44.0 | 9.0 | 35.1 | |
| 1957 | 1,206,000 | 52,860 | 11,544 | 41,316 | 43.9 | 9.6 | 34.3 | |
| 1958 | 1,246,000 | 53,919 | 10,608 | 43,311 | 43.3 | 8.5 | 34.8 | |
| 1959 | 1,289,000 | 57,801 | 11,160 | 46,641 | 44.8 | 8.7 | 36.2 | |
| 1960 | 1,334,000 | 59,701 | 11,035 | 48,666 | 44.8 | 8.3 | 36.5 | |
| 1961 | 1,382,000 | 60,641 | 10,644 | 49,997 | 43.9 | 7.7 | 36.2 | |
| 1962 | 1,431,000 | 60,750 | 11,953 | 48,797 | 42.5 | 8.4 | 34.1 | |
| 1963 | 1,482,000 | 62,821 | 12,519 | 50,302 | 42.4 | 8.5 | 34.0 | |
| 1964 | 1,533,000 | 61,870 | 13,527 | 48,343 | 40.4 | 8.8 | 31.6 | |
| 1965 | 1,583,000 | 62,400 | 12,814 | 49,586 | 39.4 | 8.1 | 31.3 | |
| 1966 | 1,633,000 | 62,330 | 11,403 | 50,927 | 38.2 | 7.0 | 31.2 | |
| 1967 | 1,681,000 | 61,229 | 11,289 | 49,940 | 36.4 | 6.7 | 29.7 | |
| 1968 | 1,729,000 | 60,902 | 10,653 | 50,249 | 35.2 | 6.2 | 29.1 | |
| 1969 | 1,776,000 | 59,636 | 11,599 | 48,037 | 33.6 | 6.5 | 27.1 | |
| 1970 | 1,822,000 | 59,557 | 11,504 | 48,053 | 32.7 | 6.3 | 26.4 | |
| 1971 | 1,867,000 | 58,138 | 10,575 | 47,563 | 31.2 | 5.7 | 25.5 | |
| 1972 | 1,911,000 | 59,274 | 10,855 | 48,419 | 31.0 | 5.7 | 25.4 | |
| 1973 | 1,956,000 | 58,177 | 9,702 | 48,475 | 29.8 | 5.0 | 24.8 | |
| 1974 | 2,002,000 | 57,749 | 9,512 | 48,237 | 28.9 | 4.8 | 24.1 | |
| 1975 | 2,052,000 | 59,175 | 9,615 | 49,560 | 28.9 | 4.7 | 24.2 | |
| 1976 | 2,105,000 | 60,668 | 9,356 | 51,312 | 28.8 | 4.4 | 24.4 | |
| 1977 | 2,162,000 | 64,190 | 8,907 | 55,283 | 29.7 | 4.1 | 25.6 | |
| 1978 | 2,222,000 | 67,722 | 8,625 | 59,097 | 30.5 | 3.9 | 26.6 | |
| 1979 | 2,284,000 | 69,318 | 9,143 | 60,175 | 30.4 | 4.0 | 26.4 | |
| 1980 | 2,348,000 | 70,048 | 9,268 | 61,780 | 29.8 | 3.9 | 26.3 | |
| 1981 | 2,415,000 | 72,294 | 8,990 | 63,304 | 30.0 | 3.7 | 26.2 | |
| 1982 | 2,483,000 | 73,168 | 9,168 | 64,000 | 29.5 | 3.7 | 25.8 | |
| 1983 | 2,554,000 | 72,944 | 9,432 | 63,536 | 28.6 | 3.7 | 24.9 | |
| 1984 | 2,626,000 | 76,878 | 9,931 | 66,217 | 29.0 | 3.8 | 25.2 | |
| 1985 | 2,699,000 | 84,337 | 10,493 | 73,841 | 31.3 | 3.9 | 27.4 | |
| 1986 | 2,773,000 | 83,194 | 10,449 | 72,745 | 30.0 | 3.8 | 26.3 | |
| 1987 | 2,848,000 | 80,326 | 10,687 | 69,639 | 28.2 | 3.8 | 24.5 | |
| 1988 | 2,924,000 | 81,376 | 10,944 | 70,432 | 27.8 | 3.7 | 24.1 | |
| 1989 | 3,001,000 | 83,460 | 11,272 | 72,188 | 27.8 | 3.8 | 24.1 | |
| 1990 | 3,079,000 | 81,939 | 11,366 | 70,573 | 26.6 | 3.7 | 22.9 | |
| 1991 | 3,156,000 | 81,110 | 11,792 | 69,318 | 25.7 | 3.7 | 22.0 | |
| 1992 | 3,234,000 | 80,164 | 12,253 | 67,911 | 24.8 | 3.8 | 21.0 | |
| 1993 | 3,312,000 | 79,714 | 12,544 | 67,170 | 24.1 | 3.8 | 20.3 | |
| 1994 | 3,394,000 | 80,391 | 13,313 | 67,078 | 23.7 | 3.9 | 19.8 | |
| 1995 | 3,478,000 | 80,306 | 14,061 | 66,245 | 23.1 | 4.0 | 19.0 | |
| 1996 | 3,567,000 | 79,203 | 13,993 | 65,210 | 22.2 | 3.9 | 18.3 | |
| 1997 | 3,658,000 | 78,018 | 14,260 | 63,758 | 21.3 | 3.9 | 17.4 | |
| 1998 | 3,751,000 | 76,982 | 14,708 | 62,274 | 20.5 | 3.9 | 16.6 | |
| 1999 | 3,842,000 | 78,526 | 15,052 | 63,474 | 20.4 | 3.9 | 16.5 | |
| 2000 | 3,930,000 | 78,178 | 14,944 | 63,234 | 19.9 | 3.8 | 16.1 | |
| 2001 | 4,013,000 | 76,401 | 15,608 | 60,793 | 19.0 | 3.9 | 15.1 | |
| 2002 | 4,094,000 | 71,144 | 15,004 | 56,140 | 17.4 | 3.7 | 13.7 | |
| 2003 | 4,171,000 | 72,938 | 15,800 | 57,138 | 17.5 | 3.8 | 13.7 | |
| 2004 | 4,246,000 | 72,247 | 15,949 | 56,298 | 17.0 | 3.8 | 13.3 | |
| 2005 | 4,320,000 | 71,548 | 16,139 | 55,409 | 16.6 | 3.7 | 12.8 | |
| 2006 | 4,392,000 | 71,291 | 16,766 | 54,525 | 16.2 | 3.8 | 12.4 | |
| 2007 | 4,463,000 | 73,144 | 17,071 | 56,073 | 16.4 | 3.8 | 12.6 | 1.984 |
| 2008 | 4,533,000 | 75,187 | 18,021 | 57,166 | 16.6 | 4.0 | 12.6 | 1.974 |
| 2009 | 4,601,000 | 75,000 | 18,560 | 56,440 | 16.2 | 4.0 | 12.2 | 1.950 |
| 2010 | 4,670,000 | 70,922 | 19,077 | 51,845 | 15.5 | 4.2 | 11.4 | 1.810 |
| 2011 | 4,738,000 | 73,459 | 18,801 | 54,658 | 15.9 | 4.1 | 11.8 | 1.858 |
| 2012 | 4,652,000 | 73,326 | 19,200 | 54,126 | 15.7 | 4.1 | 11.6 | 1.840 |
| 2013 | 4,713,000 | 70,550 | 19,647 | 50,903 | 15.0 | 4.2 | 10.8 | 1.756 |
| 2014 | 4,773,000 | 71,793 | 20,553 | 51,240 | 15.0 | 4.3 | 10.7 | 1.774 |
| 2015 | 4,832,000 | 71,819 | 21,039 | 50,780 | 14.9 | 4.3 | 10.6 | 1.763 |
| 2016 | 4,890,000 | 70,004 | 22,603 | 47,401 | 14.3 | 4.6 | 9.7 | 1.706 |
| 2017 | 4,947,000 | 68,816 | 23,251 | 45,565 | 13.9 | 4.7 | 9.2 | 1.671 |
| 2018 | 5,003,000 | 68,449 | 23,806 | 44,643 | 13.7 | 4.8 | 8.9 | 1.661 |
| 2019 | 5,058,000 | 64,287 | 24,237 | 40,050 | 12.7 | 4.8 | 7.9 |
Current vital statistics
- Births January–June 2018 =

- Births January–June 2019 =
- Deaths January–June 2018 =

- Deaths January–June 2019 =
- Natural growth January–June 2018 =
- Natural growth January–June 2019 =
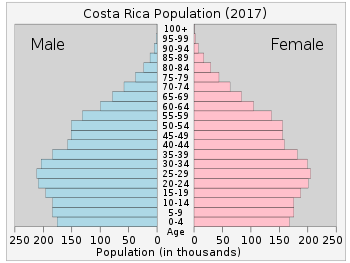
Structure of the population[32]
Structure of the population (01.07.2017) (Estimates - the source of data is the national household survey):
| Age Group | Male | Female | Total | % |
|---|---|---|---|---|
| Total | 2 405 636 | 2 541 064 | 4 946 700 | 100 |
| 0-4 | 153 647 | 153 302 | 306 949 | 6,20 |
| 5-9 | 180 403 | 179 809 | 360 212 | 7,28 |
| 10-14 | 200 123 | 174 821 | 374 944 | 7,57 |
| 15-19 | 216 776 | 211 077 | 427 853 | 8,64 |
| 20-24 | 215 301 | 205 588 | 420 889 | 8,50 |
| 25-29 | 188 815 | 198 789 | 387 604 | 7,83 |
| 30-34 | 176 356 | 198 185 | 373 541 | 7,55 |
| 35-39 | 161 288 | 174 851 | 336 139 | 7,40 |
| 40-44 | 145 430 | 164 672 | 310 102 | 6,26 |
| 45-49 | 136 591 | 163 412 | 300 003 | 6,06 |
| 50-54 | 146 253 | 168 407 | 314 660 | 6,36 |
| 55-59 | 133 924 | 144 718 | 278 642 | 5,63 |
| 60-64 | 108 422 | 126 063 | 234 485 | 4,74 |
| 65-69 | 83 152 | 92 321 | 175 473 | 3,54 |
| 70-74 | 55 495 | 75 098 | 130 593 | 2,64 |
| 75-79 | 50 799 | 45 514 | 96 313 | 1,94 |
| 80-84 | 28 176 | 31 126 | 59 302 | 1,20 |
| 85-89 | 16 164 | 20 771 | 36 935 | 0,74 |
| 90-94 | 6 159 | 10 188 | 16 347 | 0,33 |
| 95+ | 2 362 | 3 352 | 5 714 | 0,11 |
| unknown | 3 000 | 2 158 | 5 158 | 0,10 |
| Age group | Male | Female | Total | Percent |
|---|---|---|---|---|
| 0-14 | 522 072 | 498 520 | 1 020 592 | 21,63 |
| 15-64 | 1 580 192 | 1 676 121 | 3 256 313 | 69,02 |
| 65+ | 187 174 | 248 444 | 435 618 | 9,23 |
Life expectancy at birth
| Period | Life expectancy in
Years |
Period | Life expectancy in
Years |
|---|---|---|---|
| 1950–1955 | 56.0 | 1985–1990 | 75.1 |
| 1955–1960 | 58.8 | 1990–1995 | 76.1 |
| 1960–1965 | 62.4 | 1995–2000 | 77.0 |
| 1965–1970 | 65.2 | 2000–2005 | 77.8 |
| 1970–1975 | 67.7 | 2005–2010 | 78.4 |
| 1975–1980 | 70.5 | 2010–2015 | 79.2 |
| 1980–1985 | 73.4 |
Source: UN World Population Prospects[33]
Demographic statistics
Demographic statistics according to the World Population Review in 2019.[34]
- One birth every 8 minutes
- One death every 21 minutes
- One net migrant every 160 minutes
- Net gain of one person every 11 minutes
Demographic statistics according to the CIA World Factbook, unless otherwise indicated.[35]
Population
- 4,987,142 (July 2018 est.)
- 4,872,543 (July 2016 est.)
Ethnic groups
- Whites and Mestizos 83.6%
- Mulatto 6.7%
- Indigenous 2.4%
- Black of African descent 1.1%
- Other 1.1%
- None 2.9%
- Unspecified 2.2% (2011 est.)
Age structure
- 0-14 years: 22.43% (male 572,172 /female 546,464)
- 15-24 years: 15.94% (male 405,515 /female 389,433)
- 25-54 years: 44.04% (male 1,105,944 /female 1,090,434)
- 55-64 years: 9.48% (male 229,928 /female 242,696)
- 65 years and over: 8.11% (male 186,531 /female 218,025) (2018 est.)
Median age
- Total: 31.7 years. Country comparison to the world: 109th
- Male: 31.2 years
- Female: 32.2 years (2018 est.)
- Total: 30.9 years
- Male: 30.4 years
- Female: 31.3 years (2016 est.)
Birth rate
- 15.3 births/1,000 population (2018 est.) Country comparison to the world: 121st
Death rate
- 4.8 deaths/1,000 population (2018 est.) Country comparison to the world: 200th
Total fertility rate
- 1.89 children born/woman (2018 est.) Country comparison to the world: 135th
Net migration rate
- 0.8 migrant(s)/1,000 population (2018 est.) Country comparison to the world: 65th
Population growth rate
- 1.13% (2018 est.) Country comparison to the world: 95th
Contraceptive prevalence rate
- 76.2% (2011)
Religions
Roman Catholic 71.8%, Evangelical and Pentecostal 12.3%, other Protestant 2.6%, Jehovah's Witness 0.5%, other 2.4%, none 10.4% (2016 est.)
Dependency ratios
- Total dependency ratio: 45.4 (2015 est.)
- Youth dependency ratio: 32.4 (2015 est.)
- Elderly dependency ratio: 12.9 (2015 est.)
- Potential support ratio: 7.7 (2015 est.)
Urbanization
- Urban population: 79.3% of total population (2018)
- Rate of urbanization: 1.5% annual rate of change (2015-20 est.)
Infant mortality rate
- Total: 8.3 deaths/1,000 live births
- Male: 9 deaths/1,000 live births
- Female: 7.4 deaths/1,000 live births (2016 est.)
Life expectancy at birth
- Total population: 78.9 years. Country comparison to the world: 55th
- Male: 76.2 years
- Female: 81.7 years (2018 est.)
- Total population: 78.6 years
- Male: 75.9 years
- Female: 81.3 years (2016 est.)
HIV/AIDS
- Adult prevalence rate: 0.33%
- People living with HIV/AIDS: 10,000
- Deaths:200 (2015 est.)
Education expenditures
- 7.4% of GDP (2017) Country comparison to the world: 11th
Literacy
- Total population: 97.8%
- Male: 97.7%
- Female: 97.8% (2015 est.)
School life expectancy (primary to tertiary education)
- Total: 15 years
- Male: 15 years
- Female: 16 years (2016)
Unemployment, youth ages 15-24
- Total: 20.6%. Country comparison to the world: 61st
- Male: 17.6%
- Female: 25.9% (2017 est.)
Nationality
- Noun: Costa Rican(s)
- Adjective: Costa Rican
Sex ratio
- At birth: 1.05 male(s)/female
- 0–14 years: 1.05 male(s)/female
- 15–24 years: 1.04 male(s)/female
- 25–54 years: 1.01 male(s)/female
- 55–64 years: 0.95 male(s)/female
- 65 years and over: 0.86 male(s)/female
- Total population: 1.01 male(s)/female (2016 est.)
Languages
Nearly all Costa Ricans speak Spanish; but many blacks speak a traditional Jamaican dialect of English, also a few of the Natives speak their own language, such as the case of the Ngobes.
Religions
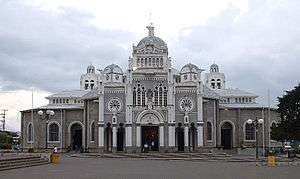
According to the World Factbook the main religions are: Roman Catholic, 76.3%; Evangelical, 13.7%; Jehovah's Witnesses, 1.3%; other Protestant, 0.7%; other, 4.8%; none, 3.2%.
The most recent nationwide survey of religion in Costa Rica, conducted in 2007 by the University of Costa Rica, found that 70.5 percent of the population identify themselves as Roman Catholics (with 44.9 percent practicing, 25.6 percent nonpracticing), 13.8 percent are Evangelical Protestants, 11.3 percent report that they do not have a religion, and 4.3 percent declare that they belong to another religion.[38]
Apart from the dominant Catholic religion, there are several other religious groups in the country.[38] Methodist, Lutheran, Episcopal, Baptist, and other Protestant groups have significant membership.[38] The Church of Jesus Christ of Latter-day Saints (LDS Church) claim more than 35,000 members and has a temple in San José that served as a regional worship center for Costa Rica, Panama, Nicaragua, and Honduras.[39]
Although they represent less than 1 percent of the population, Jehovah's Witnesses have a strong presence on the Caribbean coast.[38] Seventh-day Adventists operate a university that attracts students from throughout the Caribbean Basin.[38] The Unification Church maintains its continental headquarters for Latin America in San José.[38]
Non-Christian religious groups, including followers of Judaism, Islam, Taoism, Hare Krishna, Paganism, Wicca, Scientology, Tenrikyo, and the Bahá'í Faith, claim membership throughout the country, with the majority of worshipers residing in the Central Valley (the area of the capital).[38] While there is no general correlation between religion and ethnicity, indigenous peoples are more likely to practice animism than other religions.[38]
Article 75 of the Costa Rican Constitution states that the "Catholic, Apostolic, and Roman Religion is the official religion of the Republic".[40] That same article provides for freedom of religion, and the Government generally respects this right in practice.[38] The US government found no reports of societal abuses or discrimination based on religious belief or practice in 2007.[38]
See also
References
- ""World Population prospects – Population division"". population.un.org. United Nations Department of Economic and Social Affairs, Population Division. Retrieved November 9, 2019.
- ""Overall total population" – World Population Prospects: The 2019 Revision" (xslx). population.un.org (custom data acquired via website). United Nations Department of Economic and Social Affairs, Population Division. Retrieved November 9, 2019.
- Costa Rica es multirracial, último censo lo pone en evidencia
- "Principal". Inec.go.cr. 27 March 2012. Archived from the original on 27 March 2012. Retrieved 30 August 2017.
- "International Migrants by Country". Pewglobal.org. 10 November 2016. Retrieved 30 August 2017.
- Holpuch, Amanda (26 July 2016). "US partners with Costa Rica to protect Central American refugees". Theguardian.com. Retrieved 30 August 2017.
- Cherry, Andrew; Mary Dillon (2014). International Handbook of Adolescent Pregnancy: Medical, Psychosocial, and Public Health Responses. Springer Science & Business Media. p. 258. ISBN 978-1-4899-8026-7. Retrieved 5 November 2016.
- Costa Rica - Emigrantes totales (in Spanish) Según los últimos datos publicados Costa Rica tiene 133.185 emigrantes, lo que supone un 2,77% de la población de Costa Rica. Si miramos el ranking de emigrantes vemos que tiene un porcentaje de emigrantes medio, ya que está en el puesto 44º de los 195 del ranking de emigrantes.
- "World Population Prospects: The 2006 Revision, Highlights, Working Paper No. ESA/P/WP.202" (PDF). United Nations, Department of Economic and Social Affairs, Population Division. New York. 2007. Retrieved 4 November 2016.
- "Field listing: Urbanization: Costa Rica". The World Factbook. Retrieved 4 November 2016.
- "Costa Rica Population Statistics". Costaricalaw.com. 30 September 2016. Retrieved 30 August 2017.
- "Live Costa Rica Population Clock 2017 - Population of Costa Rica Today". Livepopulation.com. Retrieved 30 August 2017.
- Central Intelligence Agency (2011). "Costa Rica". The World Factbook. Langley, Virginia: Central Intelligence Agency. Retrieved 2011-10-04.
- "Human development indices" (PDF). Hdr.undp.org. 2008. Archived from the original (PDF) on 19 December 2008.
- "Human Development Report 2009: Costa Rica". Hdrstats.undp.org. Archived from the original on 11 October 2009.
- "Costa Rica". MSN Encarta. Archived from the original on 6 October 2009.
- Censo 2011 Archived November 20, 2015, at the Wayback Machine
- "Costa Rica country profile (from the Migration and Remittances Factbook 2011)" (PDF). World Bank. Archived from the original (PDF) on 2011-11-03. Retrieved 2011-08-17.
- "Costa Rica Becomes A Magnet For Migrants". Npr.org. Retrieved 30 August 2017.
- "Nicaragua, Trump, Deportations and the Affect on Family Remittances - Havana Times.org". Havanatimes.org. Retrieved 30 August 2017.
- "Ticos tenemos más de africanos y chinos de lo que se pensaba" [Costa Rica has more Africans and Chinese than was thought]. Nacion.com. 12 October 2014. Retrieved 18 January 2016.
- http://www.crhoy.com/costa-rica-es-multirracial-ultimo-censo-lo-pone-en-evidencia/
- "Costa Rica". The World Factbook. Retrieved 30 August 2016.
- "Genomic components in American demographic". Genetics. 1 (3): 25. 2015.
- Wang, S; Ray, N; Rojas, W; et al. (March 2008). "Geographic Patterns of Genome Admixture in Latin American Mestizos Tabla". PLoS Genetics. 4 (3): e1000037. doi:10.1371/journal.pgen.1000037. PMC 2265669. PMID 18369456.
- "Costa Rica". Lonely Planet. Retrieved 30 August 2016.
- "OVERVIEW OF THE HISTORY OF INTERNATIONAL MIGRATION (Costa Rica)". SICREM. Retrieved 30 August 2016.
- "Costa Rica: Población total por autoidentificación étnica-racial, según provincia y sexo. (Spanish)". Instituto Nacional de Estadística y Censos (Costa Rica). Retrieved 2016-11-19.
- "United Nations Demographic Yearbooks". Unstats.un.org. Retrieved 2 September 2016.
- "Principal". Inec.go.cr. Archived from the original on 27 March 2012. Retrieved 2 September 2016.
- "Estadísticas vitales". Instituto Nacional de Estadística y Censos - INEC. Retrieved 26 August 2018.
- "United Nations Statistics Division - Demographic and Social Statistics" (PDF). Retrieved 11 February 2019.
- "World Population Prospects – Population Division – United Nations". Retrieved 2017-07-15.
- "Costa Rica Population 2018", World Population Review
- "World Factbook EUROPE : FINLAND", The World Factbook, July 12, 2018
- International Religious Freedom Report 2008: Costa Rica. United States Bureau of Democracy, Human Rights and Labor (September 14, 2007)
- Johnson, Terrence (5 August 2012). "Buddhism in Costa Rica". Buddhistchannel.tv. Retrieved 4 November 2016.
- "Costa Rica: International Religious Freedom Report 2008". United States Department of State. 2008. Retrieved 4 November 2016.
- "Facts and Statistics", Church News, 2020. Retrieved on 30 March 2020.
- "Title VI: Religion: Article 75 (As amended with regard to its number by Article 1, Law No. 5703)". CostaRicaLaw.com. 6 June 1975. Archived from the original on 21 April 2001.
![]()
External links
- UNICEF Information about Costa Rica's Demographics
- INEC. National Institute of Statistics and Census (in Spanish)
| Costa Ricans | ||
|---|---|---|
| European | ||
| Afro-Costa Rican | ||
| Americas | ||
| Indigenous peoples of Costa Rica | ||
| Asians |
| |
San José (capital) | |||||
| History |  | ||||
| Geography |
| ||||
| Politics | |||||
| Economy | |||||
| Society |
| ||||