Teton County, Wyoming
| Teton County, Wyoming | ||
|---|---|---|
 | ||
| ||
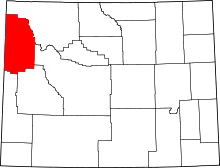 Location in the U.S. state of Wyoming | ||
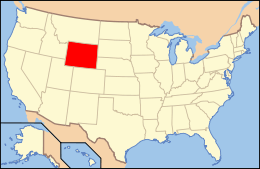 Wyoming's location in the U.S. | ||
| Founded | 1921 | |
| Named for | Teton Range | |
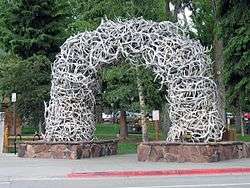
| Seat | Jackson | |
| Largest town | Jackson | |
| Area | ||
| • Total | 4,216 sq mi (10,919 km2) | |
| • Land | 3,995 sq mi (10,347 km2) | |
| • Water | 221 sq mi (572 km2), 5.2% | |
| Population (est.) | ||
| • (2016) | 23,191 | |
| • Density | 5.3/sq mi (2.0/km2) | |
| Congressional district | At-large | |
| Time zone | Mountain: UTC−7/−6 | |
| Website |
www | |

Teton County is a county located in the U.S. state of Wyoming. As of the 2010 census, the population was 21,294.[1] Its county seat is Jackson.[2] It is east from the Idaho state line.
Teton County is part of the Jackson, WY-ID Micropolitan Statistical Area.
Teton County contains the Jackson Hole ski area. In addition, the county contains all of Grand Teton National Park and 40.4% of Yellowstone National Park's total area, including over 96.6% of its water area (largely in Yellowstone Lake).[3]
History
Teton County was created February 15, 1921, with land from Lincoln County and organized the following year.[4] The county was named for the Teton Range.[5] The county was created because the inhabitants lived too far away from Kemmerer, the county seat of Lincoln County. The creation of the county required a special act of the Wyoming Legislature, because the area was too poor and had too few people to qualify for county status under the normal requirements.
Geography

According to the U.S. Census Bureau, the county has a total area of 4,216 square miles (10,920 km2), of which 3,995 square miles (10,350 km2) is land and 221 square miles (570 km2) (5.2%) is water.[6]
Adjacent counties
- Park County (northeast)
- Fremont County (east)
- Sublette County (southeast)
- Lincoln County (south)
- Bonneville County, Idaho (southwest)
- Teton County, Idaho (southwest)
- Fremont County, Idaho (west)
- Gallatin County, Montana (northwest)
Teton County, Wyoming and Teton County, Idaho, are two of twenty-two counties or parishes in the United States with the same name to border each other across state lines. The others are Big Horn County, Montana and Big Horn County, Wyoming; Bristol County, Massachusetts and Bristol County, Rhode Island; Escambia County, Alabama and Escambia County, Florida; Kent County, Delaware and Kent County, Maryland; Park County, Montana and Park County, Wyoming; Pike County, Illinois and Pike County, Missouri; Sabine County, Texas and Sabine Parish, Louisiana; San Juan County, New Mexico and San Juan County, Utah; Union Parish, Louisiana and Union County, Arkansas; and Vermilion County, Illinois and Vermillion County, Indiana (both these counties are named for the Vermilion River, despite their different spellings).
National protected areas
Demographics
| Historical population | |||
|---|---|---|---|
| Census | Pop. | %± | |
| 1930 | 2,003 | — | |
| 1940 | 2,543 | 27.0% | |
| 1950 | 2,593 | 2.0% | |
| 1960 | 3,062 | 18.1% | |
| 1970 | 4,823 | 57.5% | |
| 1980 | 9,355 | 94.0% | |
| 1990 | 11,172 | 19.4% | |
| 2000 | 18,251 | 63.4% | |
| 2010 | 21,294 | 16.7% | |
| Est. 2016 | 23,191 | [7] | 8.9% |
| U.S. Decennial Census[8] 1870–2000[9] 2010–2016[1] | |||
2000 census
As of the census[10] of 2000, there were 18,251 people, 7,688 households, and 4,174 families residing in the county. The population density was 5 people per square mile (2/km²). There were 10,267 housing units at an average density of 3 per square mile (1/km²). The racial makeup of the county was 93.59% White, 0.15% Black or African American, 0.53% Native American, 0.54% Asian, 0.03% Pacific Islander, 3.93% from other races, and 1.22% from two or more races. 6.49% of the population were Hispanic or Latino of any race. 19.2% were of German, 14.2% English, 11.7% Irish and 6.7% American ancestry.
There were 7,688 households out of which 25.60% had children under the age of 18 living with them, 45.30% were married couples living together, 5.70% had a female householder with no husband present, and 45.70% were non-families. 27.30% of all households were made up of individuals and 3.70% had someone living alone who was 65 years of age or older. The average household size was 2.36 and the average family size was 2.89.
Age range in the county was well distributed with 19.90% under the age of 18, 9.80% from 18 to 24, 38.30% from 25 to 44, 25.00% from 45 to 64, and 6.90% who were 65 years of age or older. The median age was 35 years. For every 100 females, there were 114.30 males. For every 100 females age 18 and over, there were 115.50 males.
The median income for a household in the county was $54,614, and the median income for a family was $63,916. Males had a median income of $34,570 versus $29,132 for females. The per capita income for the county was $38,260. About 2.80% of families and 6.00% of the population were below the poverty line, including 5.70% of those under age 18 and 4.40% of those age 65 or over.
2010 census
As of the 2010 United States Census, there were 21,294 people, 8,973 households, and 4,938 families residing in the county.[11] The population density was 5.3 inhabitants per square mile (2.0/km2). There were 12,813 housing units at an average density of 3.2 per square mile (1.2/km2).[12] The racial makeup of the county was 88.4% white, 1.1% Asian, 0.5% American Indian, 0.2% black or African American, 0.1% Pacific islander, 8.1% from other races, and 1.6% from two or more races. Those of Hispanic or Latino origin made up 15.0% of the population.[11] In terms of ancestry, 22.2% were German, 14.9% were English, 13.0% were Irish, and 11.1% were American.[13]
Of the 8,973 households, 25.5% had children under the age of 18 living with them, 45.7% were married couples living together, 5.6% had a female householder with no husband present, 45.0% were non-families, and 29.2% of all households were made up of individuals. The average household size was 2.34 and the average family size was 2.89. The median age was 36.9 years.[11]
The median income for a household in the county was $70,271 and the median income for a family was $90,596. Males had a median income of $40,594 versus $36,715 for females. The per capita income for the county was $42,224. About 5.1% of families and 8.2% of the population were below the poverty line, including 15.5% of those under age 18 and 0.8% of those age 65 or over.[14]
Communities
Town
- Jackson (county seat)
Census-designated places
Unincorporated communities
Politics
Previously a staunchly Republican county, which produced Governor and U.S. Senator Clifford Hansen, Teton has become the most Democratic county in Wyoming, which is one of the most Republican states in the nation. The only Republican presidential candidate since 1992 to win Teton County was George W. Bush in 2000. In the 2008 election, Barack Obama carried Teton County by a 23.6 percentage point margin over John McCain, with McCain winning statewide by a 32.2 percentage point margin over Obama, his widest margin in any state. Albany County, which includes the University of Wyoming at Laramie, was the only other county in the state to have backed Obama. In 2004, Teton was the only Wyoming county won by John F. Kerry over George W. Bush.[15] In the 2016 election, Hillary Clinton beat Donald Trump by 57.9%–31.1%.[16] The county has, however, voted at times for Republican candidates for the governorship and United States Senate.
The state's current Republican governor, Matt Mead, was born and reared in Teton County, as was his mother, Mary Mead, Clifford Hansen's daughter and the 1990 Republican gubernatorial nominee.
| Year | Republican | Democratic | Third parties |
|---|---|---|---|
| 2016 | 31.1% 3,921 | 57.9% 7,314 | 11.0% 1,392 |
| 2012 | 42.4% 4,858 | 54.2% 6,213 | 3.4% 393 |
| 2008 | 37.1% 4,565 | 60.7% 7,472 | 2.3% 279 |
| 2004 | 45.1% 5,124 | 52.6% 5,972 | 2.3% 263 |
| 2000 | 52.3% 5,454 | 38.5% 4,019 | 9.2% 958 |
| 1996 | 43.5% 3,918 | 44.9% 4,042 | 11.5% 1,038 |
| 1992 | 34.1% 2,854 | 37.2% 3,120 | 28.7% 2,408 |
| 1988 | 61.0% 3,616 | 37.4% 2,217 | 1.6% 93 |
| 1984 | 67.9% 3,487 | 30.5% 1,565 | 1.7% 87 |
| 1980 | 57.6% 3,004 | 26.1% 1,361 | 16.3% 847 |
| 1976 | 67.4% 2,667 | 30.4% 1,204 | 2.2% 86 |
| 1972 | 70.0% 2,182 | 26.0% 810 | 4.0% 124 |
| 1968 | 69.3% 1,419 | 22.5% 461 | 8.3% 169 |
| 1964 | 52.8% 1,081 | 47.2% 968 | |
| 1960 | 66.5% 1,158 | 33.5% 583 | |
| 1956 | 77.7% 1,089 | 22.3% 312 | |
| 1952 | 78.6% 1,166 | 21.4% 317 | |
| 1948 | 55.8% 719 | 43.1% 556 | 1.1% 14 |
| 1944 | 56.1% 637 | 43.9% 499 | |
| 1940 | 46.1% 623 | 53.8% 728 | 0.2% 2 |
| 1936 | 37.1% 501 | 58.8% 795 | 4.1% 56 |
| 1932 | 36.4% 406 | 62.7% 699 | 0.9% 10 |
| 1928 | 64.3% 495 | 35.1% 270 | 0.7% 5 |
| 1924 | 54.6% 342 | 27.6% 173 | 17.7% 111 |
See also
References
- 1 2 "State & County QuickFacts". United States Census Bureau. Retrieved January 25, 2014.
- ↑ "Find a County". National Association of Counties. Retrieved 2011-06-07.
- ↑ "American FactFinder". United States Census Bureau. Retrieved 2008-04-30.
- ↑ Long, John H., ed. (2004). "Wyoming: Individual County Chronologies". Wyoming Atlas of Historical County Boundaries. The Newberry Library. Retrieved August 19, 2015.
- ↑ Urbanek, Mae (1988). Wyoming Place Names. Missoula, MT: Mountain Press Publishing Company. ISBN 0-87842-204-8.
- ↑ "2010 Census Gazetteer Files". United States Census Bureau. August 22, 2012. Retrieved August 18, 2015.
- ↑ "Population and Housing Unit Estimates". Retrieved June 9, 2017.
- ↑ "U.S. Decennial Census". United States Census Bureau. Retrieved August 18, 2015.
- ↑ "Historical Decennial Census Population for Wyoming Counties, Cities, and Towns". Wyoming Department of Administration & Information, Division of Economic Analysis. Retrieved January 25, 2014.
- ↑ "American FactFinder". United States Census Bureau. Retrieved 2011-05-14.
- 1 2 3 "DP-1 Profile of General Population and Housing Characteristics: 2010 Demographic Profile Data". United States Census Bureau. Retrieved 2016-01-12.
- ↑ "Population, Housing Units, Area, and Density: 2010 - County". United States Census Bureau. Retrieved 2016-01-12.
- ↑ "DP02 SELECTED SOCIAL CHARACTERISTICS IN THE UNITED STATES – 2006-2010 American Community Survey 5-Year Estimates". United States Census Bureau. Retrieved 2016-01-12.
- ↑ "DP03 SELECTED ECONOMIC CHARACTERISTICS – 2006-2010 American Community Survey 5-Year Estimates". United States Census Bureau. Retrieved 2016-01-12.
- ↑ Leip, David. "Dave Leip's Atlas of U.S. Presidential Elections". uselectionatlas.org. Retrieved December 19, 2016.
- ↑ "2016 election results: Wyoming". www.cnn.com. Retrieved November 26, 2016.
- ↑ Dave Leip’s U.S. Election Atlas; 2016 Presidential General Election Results – Wyoming: Teton County (and earlier years)
External links
| Wikimedia Commons has media related to Teton County, Wyoming. |
Places adjacent to Teton County, Wyoming | |
|---|---|
Municipalities and communities of Teton County, Wyoming, United States | ||
|---|---|---|
| Town | | |
| CDPs | ||
| Unincorporated communities | ||