List of states and territories of the United States by population
.svg.png)
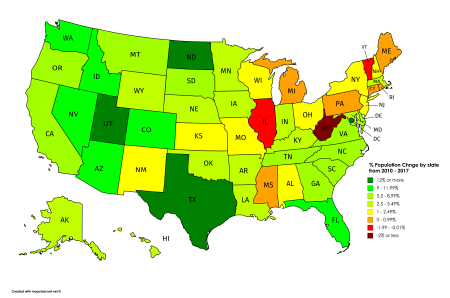
As of April 1, 2010, the date of the 2010 United States Census, the nine most populous U.S. states contain slightly more than half of the total population. The 25 least populous states contain less than one-sixth of the total population. California, the most populous state, contains more people than the 21 least populous states combined, and Wyoming is the least populous state, with a population less than the 31 most populous U.S. cities.
Methodology
The United States Census counts total persons residing in the United States including citizens, non-citizen permanent residents, and non-citizen long-term visitors.[1] Civilian and military federal employees serving abroad and their dependents are counted in their home state.[2]
Electoral apportionment
Based on data from the decennial census, each state is allocated a proportion of the 435 seats in the United States House of Representatives, although each state is guaranteed a minimum of one seat, regardless of population. This apportionment is based on the proportion of each state's population to that of the fifty states together (without regard to the populations of the District of Columbia, AS, GU, MP, PR, or VI). The Electoral College is the body that, every four years, elects the President and Vice President of the United States. Each state's representation in the Electoral College is equal to that state's total number of members in both houses of the United States Congress. The Twenty-third Amendment to the United States Constitution effectively grants the District of Columbia, which is separate from any state, three votes. More precisely, the district gets as many votes in the Electoral College as it would have if it were a state, with the caveat that the district can have no more votes than the least populous state (which is currently Wyoming). Currently, this caveat is a moot point since the District of Columbia would only be entitled to one representative if it were a state, and is more populous than only two of the seven states with a single member in the House since 2013. Since the Constitution guarantees every state at least one U.S. Representative and two U.S. Senators, it effectively guarantees every state (and, since the ratification of the 23rd Amendment, the District of Columbia) at least three electoral votes. Thus, the total representation in the Electoral College is 538 members (equal to 100 senators plus 435 representatives, plus 3 members for the District of Columbia).[3]
State rankings
| Rank in the fifty U.S. states, 2017 | Rank in all U.S. states and territories, 2010 | State or territory | Population estimate, July 1, 2017[4] | Census population, April 1, 2010 | Percent increase from 2010-2017[note 1] | Total seats in the U.S. House of Representatives, 2013–2023 | Estimated population per electoral vote, 2017[note 2] | Estimated population per House seat, 2017 | Census population per House seat, 2010 | Percent of the total U.S. population, 2017[note 3] |
|---|---|---|---|---|---|---|---|---|---|---|
| 1 | 1 | 39,536,653 | 37,252,895 | 6.13% | 53 | 718,848 | 745,974 | 702,885 | 12.14% | |
| 2 | 2 | 28,304,596 | 25,146,105 | 12.56% | 36 | 744,858 | 786,238 | 698,503 | 8.69% | |
| 3 | 4 | 20,984,400 | 18,804,623 | 11.59% | 27 | 734,904 | 777,200 | 696,468 | 6.44% | |
| 4 | 3 | 19,849,399 | 19,378,087 | 2.43% | 27 | 684,462 | 735,163 | 717,707 | 6.09% | |
| 5 | 6 | 12,805,537 | 12,702,887 | 0.81% | 18 | 640,277 | 711,419 | 705,715 | 3.93% | |
| 6 | 5 | 12,802,023 | 12,831,549 | -0.23% | 18 | 640,101 | 711,224 | 712,864 | 3.93% | |
| 7 | 7 | 11,658,609 | 11,536,725 | 1.06% | 16 | 647,701 | 728,663 | 721,032 | 3.58% | |
| 8 | 9 | 10,429,379 | 9,688,681 | 7.64% | 14 | 651,836 | 744,956 | 691,975 | 3.20% | |
| 9 | 10 | 10,273,419 | 9,535,692 | 7.74% | 13 | 684,895 | 790,263 | 733,498 | 3.15% | |
| 10 | 8 | 9,962,311 | 9,884,129 | 0.79% | 14 | 622,644 | 711,594 | 705,974 | 3.06% | |
| 11 | 11 | 9,005,644 | 8,791,936 | 2.43% | 12 | 643,260 | 750,470 | 732,658 | 2.76% | |
| 12 | 12 | 8,470,020 | 8,001,045 | 5.86% | 11 | 651,540 | 770,002 | 727,366 | 2.60% | |
| 13 | 13 | 7,405,743 | 6,724,543 | 10.13% | 10 | 617,145 | 740,574 | 672,454 | 2.27% | |
| 14 | 16 | 7,016,270 | 6,392,307 | 9.76% | 9 | 637,843 | 779,586 | 710,224 | 2.15% | |
| 15 | 14 | 6,859,819 | 6,547,817 | 4.76% | 9 | 623,620 | 762,202 | 727,514 | 2.11% | |
| 16 | 17 | 6,715,984 | 6,346,275 | 5.83% | 9 | 610,544 | 746,220 | 705,123 | 2.06% | |
| 17 | 15 | 6,666,818 | 6,484,229 | 2.82% | 9 | 606,074 | 740,758 | 720,422 | 2.05% | |
| 18 | 18 | 6,113,532 | 5,988,927 | 2.08% | 8 | 611,353 | 764,192 | 748,615 | 1.88% | |
| 19 | 19 | 6,052,177 | 5,773,785 | 4.82% | 8 | 605,218 | 756,522 | 721,694 | 1.86% | |
| 20 | 20 | 5,795,483 | 5,687,289 | 1.90% | 8 | 579,548 | 724,435 | 710,873 | 1.78% | |
| 21 | 22 | 5,607,154 | 5,029,324 | 11.49% | 7 | 623,017 | 801,022 | 720,704 | 1.72% | |
| 22 | 21 | 5,576,606 | 5,303,925 | 5.14% | 8 | 557,661 | 697,076 | 662,991 | 1.71% | |
| 23 | 24 | 5,024,369 | 4,625,401 | 8.63% | 7 | 558,263 | 717,767 | 660,766 | 1.54% | |
| 24 | 23 | 4,874,747 | 4,780,127 | 1.98% | 7 | 541,639 | 696,392 | 682,819 | 1.50% | |
| 25 | 25 | 4,684,333 | 4,533,479 | 3.33% | 6 | 585,542 | 780,722 | 755,562 | 1.44% | |
| 26 | 26 | 4,454,189 | 4,339,349 | 2.65% | 6 | 556,774 | 742,365 | 723,228 | 1.37% | |
| 27 | 27 | 4,142,776 | 3,831,073 | 8.14% | 5 | 591,825 | 828,555 | 766,215 | 1.27% | |
| 28 | 28 | 3,930,864 | 3,751,616 | 4.78% | 5 | 561,552 | 786,173 | 750,270 | 1.21% | |
| 29 | 30 | 3,588,184 | 3,574,118 | 0.39% | 5 | 512,598 | 717,637 | 714,824 | 1.10% | |
| — | 29 | 3,337,177 | 3,726,157 | -10.44% | 1 (non-voting) | — | — | — | 1.01% | |
| 30 | 31 | 3,145,711 | 3,046,869 | 3.24% | 4 | 524,285 | 786,428 | 761,717 | 0.97% | |
| 31 | 35 | 3,101,833 | 2,763,888 | 12.23% | 4 | 516,972 | 775,458 | 690,972 | 0.95% | |
| 32 | 33 | 3,004,279 | 2,915,958 | 3.03% | 4 | 500,713 | 751,070 | 728,990 | 0.92% | |
| 33 | 36 | 2,998,039 | 2,700,691 | 11.01% | 4 | 499,673 | 749,510 | 675,173 | 0.92% | |
| 34 | 32 | 2,984,100 | 2,968,103 | 0.54% | 4 | 497,350 | 746,025 | 742,026 | 0.92% | |
| 35 | 34 | 2,913,123 | 2,853,132 | 2.10% | 4 | 485,521 | 728,281 | 713,280 | 0.89% | |
| 36 | 37 | 2,088,070 | 2,059,192 | 1.40% | 3 | 417,614 | 696,023 | 686,393 | 0.64% | |
| 37 | 39 | 1,920,076 | 1,826,341 | 5.13% | 3 | 384,015 | 640,025 | 608,780 | 0.59% | |
| 38 | 38 | 1,815,857 | 1,853,011 | -2.01% | 3 | 363,171 | 605,285 | 617,670 | 0.56% | |
| 39 | 40 | 1,716,943 | 1,567,652 | 9.52% | 2 | 429,236 | 858,472 | 783,826 | 0.53% | |
| 40 | 41 | 1,427,538 | 1,360,301 | 4.94% | 2 | 356,885 | 713,769 | 680,151 | 0.44% | |
| 41 | 43 | 1,342,795 | 1,316,466 | 2.00% | 2 | 335,699 | 671,398 | 658,233 | 0.41% | |
| 42 | 42 | 1,335,907 | 1,328,361 | 0.57% | 2 | 333,977 | 667,954 | 664,181 | 0.41% | |
| 43 | 44 | 1,059,639 | 1,052,931 | 0.64% | 2 | 264,910 | 529,820 | 526,466 | 0.33% | |
| 44 | 45 | 1,050,493 | 989,417 | 6.17% | 1 | 350,164 | 1,050,493 | 989,417 | 0.32% | |
| 45 | 46 | 961,939 | 897,936 | 7.13% | 1 | 320,646 | 961,939 | 897,936 | 0.30% | |
| 46 | 47 | 869,666 | 814,191 | 6.81% | 1 | 289,889 | 869,666 | 814,191 | 0.27% | |
| 47 | 49 | 755,393 | 672,591 | 12.31% | 1 | 251,798 | 755,393 | 672,591 | 0.23% | |
| 48 | 48 | 739,795 | 710,249 | 4.16% | 1 | 246,598 | 739,795 | 710,249 | 0.23% | |
| — | 51 | 693,972 | 601,767 | 15.32% | 1 (non-voting) | 231,324 | — | — | 0.21% | |
| 49 | 50 | 623,657 | 625,745 | -0.33% | 1 | 207,886 | 623,657 | 625,745 | 0.19% | |
| 50 | 52 | 579,315 | 563,767 | 2.76% | 1 | 193,105 | 579,315 | 563,767 | 0.18% | |
| — | 53 | 165,718[5] | 159,358[6] | 3.99% | 1 (non-voting) | — | — | 0.06% | ||
| — | 54 | 104,914[7] | 106,405[8] | -1.40% | 1 (non-voting) | — | — | 0.04% | ||
| — | 55 | 55,641[9] | 55,519[10] | 0.22% | 1 (non-voting) | — | — | 0.01% | ||
| — | 56 | 55,194[11] | 53,883[12] | 2.43% | 1 (non-voting) | — | — | 0.00% | ||
| — | 57 | 100 | 188 | -46.81% | 0 | — | — | 0.00% | ||
| — | 58 | 20 | 20 | 0.00% | 0 | — | — | 0.00% | ||
| — | 59 | 40 | 0 | inf | 0 | — | — | 0.00% | ||
| — | — | 0 | 0 | 0.00% | 0 | — | — | 0.00% | ||
| — | — | 0 | 0 | 0.00% | 0 | — | — | 0.00% | ||
| — | — | 0 | 0 | 0.00% | 0 | — | — | 0.00% | ||
| — | — | 0 | 0 | 0.00% | 0 | — | — | 0.00% | ||
| — | — | 0 | 0 | 0.00% | 0 | — | — | 0.00% | ||
| — | — | Navassa Island | 0 | 0 | 0.00% | 0 | — | — | 0.00% | |
| — | — | Serranilla Bank | 0 | 0 | 0.00% | 0 | — | — | 0.00% | |
| — | — | Bajo Nuevo Bank | 0 | 0 | 0.00% | 0 | — | — | 0.00% | |
| — | — | Contiguous United States | 323,551,845 | 306,687,555 | 5.50% | 432 (+ 1 non-voting) | — | — | 98.18% | |
| — | — | The fifty states | 325,025,206 | 308,156,338 | 5.47% | 435 | 737,348 | 708,376 | 98.48% | |
| — | — | Fifty states + D.C. | 325,719,178 | 308,758,105 | 5.49% | 435 (+ 1 non-voting) | — | — | 98.67% | |
| — | — | Total U.S. (including D.C. and territories) | 329,431,520 | 312,913,872 | 5.28% | 435 (+ 6 non-voting) | — | — | 100.00% |
- ↑ This figure for each state compares to a national increase of 5.50%.
- ↑ Each state has a number of votes in the Electoral College equal to two more than its number of representatives in the U.S. House, while DC is granted 3 electoral votes. The Electoral College is used to elect the President of the United States.
- ↑ Because of rounding of the individual percentages, the entries in this column may not sum to 100%.
Summary of population by region
| Legend |
|---|
| Division totals – 9 divisions for 50 states and D.C. |
| Region totals – 4 regions ( 2 or 3 divisions each) |
| Individual territories |
| Total U.S. Territories |
| 50 States + District of Columbia |
| Divisions & regions as defined by U.S. Census Bureau |
| Last col. shows larger region which contains entity in col. 1 |
| State/Territory/ Division/Region |
Rank | 2017 population |
Rank | 2010 population |
Rank | 2000 population |
Rank | 2000- 2010 change |
Geographic sort |
|---|---|---|---|---|---|---|---|---|---|
| 15 | 6,859,819 | 14 | 6,547,629 | 13 | 6,349,097 | 43 | 3.1% | NEng | |
| 29 | 3,588,184 | 29 | 3,574,097 | 29 | 3,405,565 | 35 | 4.9% | NEng | |
| 42 | 1,335,907 | 41 | 1,328,361 | 40 | 1,274,923 | 39 | 4.2% | NEng | |
| 41 | 1,342,795 | 42 | 1,316,470 | 41 | 1,235,786 | 32 | 6.5% | NEng | |
| 43 | 1,059,639 | 43 | 1,052,567 | 43 | 1,048,319 | 49 | 0.4% | NEng | |
| 49 | 623,657 | 49 | 625,741 | 49 | 608,827 | 44 | 2.8% | NEng | |
| New England | 9 | 14,810,001 | 9 | 14,444,865 | 9 | 13,922,517 | 7 | 3.8% | NEast |
| 3 | 19,849,399 | 3 | 19,378,102 | 3 | 18,976,457 | 46 | 2.1% | MAtl | |
| 5 | 12,805,537 | 6 | 12,702,379 | 6 | 12,281,054 | 41 | 3.4% | MAtl | |
| 11 | 9,005,644 | 11 | 8,791,894 | 9 | 8,414,350 | 37 | 4.5% | MAtl | |
| Mid-Atlantic | 4 | 41,660,580 | 4 | 40,872,375 | 4 | 39,671,861 | 8 | 3.0% | NEast |
| Northeast | 4 | 56,470,581 | 4 | 55,317,240 | 4 | 53,594,378 | 4 | 3.2% | USA |
| 4 | 19,552,860 | 4 | 18,801,310 | 4 | 15,982,378 | 8 | 17.6% | SAtl | |
| 8 | 9,992,167 | 9 | 9,687,653 | 10 | 8,186,453 | 7 | 18.3% | SAtl | |
| 10 | 9,848,060 | 10 | 9,535,483 | 11 | 8,049,313 | 6 | 18.5% | SAtl | |
| 12 | 8,260,405 | 12 | 8,001,024 | 12 | 7,078,515 | 16 | 13.0% | SAtl | |
| 19 | 5,928,814 | 19 | 5,773,552 | 19 | 5,296,486 | 23 | 9.0% | SAtl | |
| 24 | 4,774,839 | 24 | 4,625,364 | 26 | 4,012,012 | 10 | 15.3% | SAtl | |
| 38 | 1,854,304 | 37 | 1,852,994 | 37 | 1,808,344 | 45 | 2.5% | SAtl | |
| 45 | 925,749 | 45 | 897,934 | 45 | 783,600 | 11 | 14.6% | SAtl | |
| -- | 646,449 | -- | 601,723 | -- | 572,059 | -- | 5.2% | SAtl | |
| South Atlantic | 1 | 64,705,532 | 1 | 59,777,037 | 1 | 51,769,160 | 3 | 15.5% | South |
| 17 | 6,495,978 | 17 | 6,346,105 | 16 | 5,689,283 | 19 | 11.5% | ESC | |
| 23 | 4,833,722 | 23 | 4,779,736 | 23 | 4,447,100 | 27 | 7.5% | ESC | |
| 26 | 4,395,295 | 26 | 4,339,367 | 25 | 4,041,769 | 28 | 7.4% | ESC | |
| 31 | 2,991,207 | 31 | 2,967,297 | 31 | 2,844,658 | 38 | 4.3% | ESC | |
| East South Central | 8 | 19,029,020 | 8 | 18,432,505 | 8 | 17,022,810 | 5 | 8.3% | South |
| 2 | 26,448,193 | 2 | 25,145,561 | 2 | 20,851,820 | 5 | 20.6% | WSC | |
| 25 | 4,625,470 | 25 | 4,533,372 | 22 | 4,468,976 | 48 | 1.4% | WSC | |
| 28 | 3,850,568 | 28 | 3,751,351 | 27 | 3,450,654 | 24 | 8.7% | WSC | |
| 32 | 2,959,373 | 32 | 2,915,918 | 33 | 2,673,400 | 22 | 9.1% | WSC | |
| West South Central | 5 | 39,924,072 | 5 | 36,346,202 | 5 | 31,444,850 | 2 | 15.6% | South |
| South | 1 | 123,658,624 | 1 | 114,555,744 | 1 | 100,236,820 | 1 | 14.3% | USA |
| 6 | 12,882,135 | 5 | 12,830,632 | 5 | 12,419,293 | 42 | 3.3% | ENC | |
| 7 | 11,570,808 | 7 | 11,536,504 | 7 | 11,353,140 | 47 | 1.6% | ENC | |
| 10 | 9,895,622 | 8 | 9,883,640 | 8 | 9,938,444 | 50 | -0.6% | ENC | |
| 17 | 6,570,902 | 15 | 6,483,802 | 14 | 6,080,485 | 31 | 6.6% | ENC | |
| 20 | 5,742,713 | 20 | 5,686,986 | 18 | 5,363,675 | 34 | 6.0% | ENC | |
| East North Central | 3 | 46,885,244 | 3 | 46,421,564 | 2 | 45,155,037 | 9 | 2.8% | MWest |
| 18 | 6,044,171 | 18 | 5,988,927 | 17 | 5,595,211 | 29 | 7.0% | WNC | |
| 22 | 5,420,380 | 21 | 5,303,925 | 21 | 4,919,479 | 26 | 7.8% | WNC | |
| 30 | 3,090,416 | 30 | 3,046,355 | 30 | 2,926,324 | 40 | 4.1% | WNC | |
| 34 | 2,893,957 | 33 | 2,853,118 | 32 | 2,688,418 | 33 | 6.1% | WNC | |
| 37 | 1,868,516 | 38 | 1,826,341 | 38 | 1,711,263 | 30 | 6.7% | WNC | |
| 46 | 844,877 | 46 | 814,180 | 46 | 754,844 | 25 | 7.9% | WNC | |
| 47 | 723,393 | 48 | 672,591 | 47 | 642,200 | 36 | 4.7% | WNC | |
| West North Central | 7 | 21,294,107 | 7 | 20,505,437 | 6 | 19,237,739 | 6 | 6.6% | MWest |
| Midwest | 3 | 68,179,351 | 3 | 66,927,001 | 2 | 64,392,776 | 3 | 3.9% | USA |
| 14 | 7,016,270 | 16 | 6,392,017 | 20 | 5,130,632 | 2 | 24.6% | Mtn | |
| 21 | 5,607,154 | 22 | 5,029,196 | 24 | 4,301,261 | 9 | 16.9% | Mtn | |
| 31 | 3,101,833 | 34 | 2,763,885 | 34 | 2,233,169 | 3 | 23.8% | Mtn | |
| 33 | 2,998,039 | 35 | 2,700,551 | 35 | 1,998,257 | 1 | 35.1% | Mtn | |
| 36 | 2,088,070 | 36 | 2,059,179 | 36 | 1,819,046 | 15 | 13.2% | Mtn | |
| 39 | 1,716,943 | 39 | 1,567,582 | 39 | 1,293,953 | 4 | 21.1% | Mtn | |
| 44 | 1,050,493 | 44 | 989,415 | 44 | 902,195 | 21 | 9.7% | Mtn | |
| 50 | 579,315 | 50 | 563,626 | 50 | 493,782 | 12 | 14.1% | Mtn | |
| Mountain | 6 | 24,158,117 | 6 | 22,065,451 | 7 | 18,172,295 | 1 | 21.4% | West |
| 1 | 39,536,653 | 1 | 37,253,956 | 1 | 33,871,648 | 20 | 10.0% | Pac | |
| 13 | 7,405,743 | 13 | 6,724,540 | 15 | 5,894,121 | 13 | 14.1% | Pac | |
| 27 | 4,142,776 | 27 | 3,831,074 | 28 | 3,421,399 | 18 | 12.0% | Pac | |
| 40 | 1,427,538 | 40 | 1,360,301 | 42 | 1,211,537 | 17 | 12.3% | Pac | |
| 48 | 739,795 | 47 | 710,231 | 48 | 626,932 | 14 | 13.3% | Pac | |
| Pacific | 2 | 53,252,505 | 2 | 49,880,102 | 3 | 45,025,637 | 4 | 10.8% | West |
| West | 2 | 77,410,622 | 2 | 71,945,553 | 3 | 63,197,932 | 2 | 13.8% | USA |
| -- | 325,719,178 | -- | 308,745,538 | -- | 281,421,906 | -- | 9.7% | NAmer | |
| 1 | 3,337,177 | 1 | 3,725,789 | 1 | 3,808,610 | 3 | -2.2% | Terr. | |
| 2 | [note 1] | 2 | 159,358 | 2 | 154,805 | 1 | 2.9% | Terr. | |
| 3 | [note 1] | 3 | 106,405 | 3 | 108,612 | 2 | -2.0% | Terr. | |
| 4 | [note 1] | 4 | 55,519 | 5 | 57,291 | 4 | -3.1% | Terr. | |
| 5 | [note 1] | 5 | 53,883 | 4 | 69,221 | 5 | -22.2% | Terr. | |
| Total Territories | -- | 3,712,342 | -- | 4,100,954 | -- | 4,198,539 | -- | -2.3% | USA |
See also
- Demographics of the United States
- List of United States cities by population
- List of U.S. states by African-American population
- List of U.S. states by historical population (tables of state populations since 1790)
- List of U.S. states by population density
- List of U.S. states by population growth rate
- List of U.S. states and territories by area
- List of U.S. states by vehicles per capita
- List of U.S. states by religiosity
- United States
- List of European countries by population
References
- General
- "National Totals: Vintage 2015". United States Census Bureau. Archived from the original on 23 December 2015. Retrieved 24 December 2015.
- "2010 Resident Population Data". U. S. Census Bureau. Retrieved 2010-12-26.
- "2010 Apportionment Population", U.S. Census Bureau. Retrieved January 6, 2011
- "2009 Census estimates". U. S. Census Bureau. Archived from the original on 2010-08-07. Retrieved 2010-08-13.
- Statistical Abstract of the United States, 1995, U.S. Census Bureau, Section 29: Outlying Areas, Table No. 1347. Land Area and Population Characteristics, by [Outlying] Area: 1990 (page 828). Retrieved May 28, 2011
- Specific
- ↑ "FAQ: Does the Census Bureau collect data on the number of unauthorized migrants?". U. S. Census Bureau. Retrieved 2009-05-13.
- ↑ "FAQ: Will 2010 Census apportionment population counts also include any Americans overseas?". U. S Census Bureau. Retrieved 2009-05-13.
- ↑ Office of the Federal Register. "A Procedural Guide to the Electoral College". National Archives and Records Administration. Archived from the original on 2010-05-28. Retrieved 2010-08-13.
- ↑ "Annual Estimates of the Resident Population for the United States, Regions, States, and Puerto Rico: April 1, 2010 to July 1, 2017" (XLSX). United States Census Bureau. Retrieved December 21, 2017.
- ↑ www.worldometers.info/world-population/guam-population/
- ↑ "Archived copy". Archived from the original on 2011-09-24. Retrieved 2010-09-12.
- ↑ "U.S. Virgin Islands Population (2018) - Worldometers". www.worldometers.info.
- ↑ "Archived copy". Archived from the original on 2012-11-01. Retrieved 2012-12-13.
- ↑ "American Samoa Population (2018) - Worldometers". www.worldometers.info.
- ↑ "Archived copy". Archived from the original on 2012-07-23. Retrieved 2012-09-11.
- ↑ http://worldpopulationreview.com/countries/northern-mariana-islands-population/
- ↑ "Archived copy". Archived from the original on 2010-12-23. Retrieved 2012-03-02.
External links
| Demographics | |
|---|---|
| Economy | |
| Environment | |
| Geography | |
| Government |
|
| Health | |
| History | |
| Law | |
| Miscellaneous | |
| |