Hillsborough County, New Hampshire
| Hillsborough County, New Hampshire | ||
|---|---|---|
 Hillsborough County Courthouse in Nashua | ||
| ||
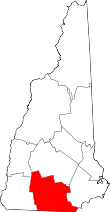 Location in the U.S. state of New Hampshire | ||
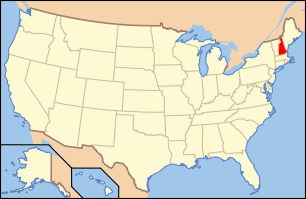 New Hampshire's location in the U.S. | ||
| Founded | 1769 | |
| Named for | The Earl of Hillsborough | |
| Seat | Manchester and Nashua | |
| Largest city |
Manchester (by population) Weare (by area) | |
| Area | ||
| • Total | 892 sq mi (2,310 km2) | |
| • Land | 876 sq mi (2,269 km2) | |
| • Water | 16 sq mi (41 km2), 1.8% | |
| Population (est.) | ||
| • (2016) | 407,761 | |
| • Density | 457/sq mi (176/km2) | |
| Congressional districts | 1st, 2nd | |
| Time zone | Eastern: UTC−5/−4 | |
| Website |
www | |

Hillsborough County is the most populous county in the U.S. state of New Hampshire. As of the 2010 census, the population was 400,721.[1] The population was estimated at 407,761 in 2016.[2] Its county seats are Manchester and Nashua. Hillsborough is northern New England's most populous county as well as its most densely populated. Hillsborough County comprises the Manchester-Nashua, NH Metropolitan Statistical Area, which in turn constitutes a portion of the Boston-Worcester-Providence, MA-RI-NH-CT Combined Statistical Area.
History
Hillsborough was one of the five original counties identified for New Hampshire in 1769, and was named for Wills Hill, the Earl of Hillsborough who was British Secretary of State for the Colonies at the time. The county was organized at Amherst on March 19, 1771. In 1823 a number of towns were removed to become part of Merrimack County. Over several years ending in 1869, county administrative functions were moved from Amherst first to Milford in 1866 then to the current seats of Manchester and Nashua.
Geography
According to the U.S. Census Bureau, the county has a total area of 892 square miles (2,310 km2), of which 876 square miles (2,270 km2) is land and 16 square miles (41 km2) (1.8%) is water.[3] The highest point in Hillsborough county is Pack Monadnock Mountain at 2,290 feet (700 m).
Adjacent counties
- Merrimack County (north)
- Rockingham County (east)
- Essex County, Massachusetts (southeast)
- Middlesex County, Massachusetts (south)
- Worcester County, Massachusetts (southwest)
- Cheshire County (west)
- Sullivan County (northwest)
National protected area
Demographics
| Historical population | |||
|---|---|---|---|
| Census | Pop. | %± | |
| 1790 | 32,883 | — | |
| 1800 | 43,899 | 33.5% | |
| 1810 | 49,249 | 12.2% | |
| 1820 | 53,884 | 9.4% | |
| 1830 | 37,724 | −30.0% | |
| 1840 | 42,494 | 12.6% | |
| 1850 | 57,478 | 35.3% | |
| 1860 | 62,140 | 8.1% | |
| 1870 | 64,238 | 3.4% | |
| 1880 | 75,634 | 17.7% | |
| 1890 | 93,247 | 23.3% | |
| 1900 | 112,640 | 20.8% | |
| 1910 | 126,072 | 11.9% | |
| 1920 | 135,512 | 7.5% | |
| 1930 | 140,165 | 3.4% | |
| 1940 | 144,888 | 3.4% | |
| 1950 | 156,987 | 8.4% | |
| 1960 | 178,161 | 13.5% | |
| 1970 | 223,941 | 25.7% | |
| 1980 | 276,608 | 23.5% | |
| 1990 | 336,073 | 21.5% | |
| 2000 | 380,841 | 13.3% | |
| 2010 | 400,721 | 5.2% | |
| Est. 2016 | 407,761 | [2] | 1.8% |
| U.S. Decennial Census[4] 1790-1960[5] 1900-1990[6] 1990-2000[7] 2010-2016[1] | |||
As of the 2010 United States Census, there were 400,721 people, 155,466 households, and 103,959 families residing in the county.[8] The population density was 457.4 inhabitants per square mile (176.6/km2). There were 166,053 housing units at an average density of 189.5 per square mile (73.2/km2).[9] The racial makeup of the county was 90.4% white, 3.2% Asian, 2.1% black or African American, 0.2% American Indian, 2.1% from other races, and 2.0% from two or more races. Those of Hispanic or Latino origin made up 5.3% of the population.[8]
Of the 155,466 households, 33.5% had children under the age of 18 living with them, 51.6% were married couples living together, 10.5% had a female householder with no husband present, 33.1% were non-families, and 25.3% of all households were made up of individuals. The average household size was 2.53 and the average family size was 3.05. The median age was 39.3 years.[8]
For the period 2011–2015, 24.8% of the county's population had French ancestry (including 9.9% of the total population with French Canadian ancestry), 20.9% had Irish, 13.1% had English, 10.2% had Italian, and 8.2% had German ancestry.[10] For the same time period, the estimated median annual income for a household in the county was $71,244, and the median income for a family was $85,966. Male full-time workers had a median income of $60,349 versus $44,270 for females. The per capita income for the county was $35,242. About 5.8% of families and 8.8% of the population were below the poverty line, including 11.7% of those under age 18 and 5.9% of those age 65 or over.[11]
Politics and government
Long the most populated county in New Hampshire, Hillsborough County has played a vital role in shaping the state's politics as a whole, although it has shifted in its own leanings over the years. Historically a Republican county going back to the 19th century, the county's more urban population made it receptive to Democrats in the early 20th century at a time when much of New England was solidly Republican. The county- and the state as a whole- voted Republican in every election since the founding of the Republican Party in 1856 until 1912, when both the county and the state were won by Democrat Woodrow Wilson. Four years later, Wilson's margin of victory in Hillsborough County enabled him to narrowly win the state as a whole despite losing the majority of counties, and making New Hampshire the only state to vote Democratic in New England and the entire Northeast in 1916.
In 1928, Hillsborough was the only county in New Hampshire to vote for Democrat Al Smith over Republican Herbert Hoover, and in the 1930s Franklin Roosevelt would solidify Democratic dominance there. In 1936, FDR would carry only 3 of New Hampshire's 10 counties, but his strong win in Hillsborough allowed him to narrowly win the state while neighboring Vermont and Maine were the only states in the nation to vote against him. In the 1940s, Roosevelt would take over 60% of the vote Hillsborough County, allowing him to win the state of New Hampshire by more comfortable margins in 1940 and 1944. The county would vote Democratic in every presidential election that followed until the 1970s, except for a win by Dwight D. Eisenhower in 1956, although it was still the only county in the state where Eisenhower failed to break 60% of the vote.
In the 1970s, shifting partisan allegiances and the growth of conservative Boston exurbs in southern New Hampshire caused a dramatic shift in Hillsborough County's politics, which also caused the state as a whole to become more conservative. Beginning in 1972, the county became reliably Republican in presidential elections, peaking in 1984, when Ronald Reagan would take over 70% of the vote there.
Although still one of the more Republican regions of the state, in the following years Democrats have made inroads and today it is an important swing county. Both Republicans George H.W. Bush and George W. Bush would win it twice each, but Democrat Bill Clinton won it in 1996, and Barack Obama has won it twice in both 2008 and 2012, bolstering his wins of the state's electoral votes each time. In the 2012 presidential election, Time had listed Hillsborough as one of five critical counties affecting the outcome in the swing state of New Hampshire. Obama ended up winning with a margin of 50%-49%.[12] Donald Trump narrowly carried the county in 2016.
| Year | Republican | Democratic | Third parties |
|---|---|---|---|
| 2016 | 46.7% 100,013 | 46.5% 99,589 | 6.8% 14,555 |
| 2012 | 48.6% 99,991 | 49.7% 102,303 | 1.6% 3,373 |
| 2008 | 47.5% 97,178 | 51.2% 104,820 | 1.3% 2,711 |
| 2004 | 51.0% 99,724 | 48.2% 94,121 | 0.8% 1,582 |
| 2000 | 48.7% 80,649 | 46.8% 77,625 | 4.5% 7,487 |
| 1996 | 40.5% 59,441 | 48.6% 71,282 | 10.9% 15,912 |
| 1992 | 39.0% 61,620 | 37.0% 58,470 | 23.9% 37,750 |
| 1988 | 65.0% 88,261 | 33.7% 45,799 | 1.3% 1,718 |
| 1984 | 70.7% 81,462 | 28.9% 33,314 | 0.4% 475 |
| 1980 | 59.8% 68,994 | 27.6% 31,789 | 12.6% 14,521 |
| 1976 | 53.1% 53,581 | 45.2% 45,544 | 1.7% 1,755 |
| 1972 | 64.4% 65,274 | 34.3% 34,739 | 1.4% 1,364 |
| 1968 | 46.0% 42,409 | 49.3% 45,423 | 4.7% 4,337 |
| 1964 | 32.9% 29,503 | 67.1% 60,236 | |
| 1960 | 42.4% 38,430 | 57.6% 52,135 | |
| 1956 | 55.5% 45,248 | 44.4% 36,234 | 0.1% 46 |
| 1952 | 49.7% 41,263 | 50.3% 41,802 | |
| 1948 | 39.9% 28,257 | 59.1% 41,789 | 1.0% 696 |
| 1944 | 38.0% 25,921 | 62.0% 42,306 | 0.0% 9 |
| 1940 | 38.1% 26,201 | 61.9% 42,580 | |
| 1936 | 38.1% 23,293 | 57.2% 34,992 | 4.7% 2,895 |
| 1932 | 41.5% 23,308 | 57.8% 32,458 | 0.7% 395 |
| 1928 | 45.2% 24,465 | 54.5% 29,457 | 0.3% 165 |
| 1924 | 51.7% 22,098 | 37.4% 16,002 | 10.9% 4,673 |
| 1920 | 54.4% 23,040 | 44.3% 18,736 | 1.3% 546 |
| 1916 | 46.3% 9,927 | 51.1% 10,939 | 2.6% 562 |
| 1912 | 35.9% 8,007 | 40.0% 8,909 | 24.1% 5,378 |
| 1908 | 57.3% 12,568 | 39.7% 8,701 | 3.1% 669 |
| 1904 | 57.5% 12,603 | 40.3% 8,831 | 2.2% 470 |
| 1900 | 58.8% 12,653 | 38.7% 8,339 | 2.5% 543 |
| 1896 | 67.8% 13,080 | 25.7% 4,965 | 6.5% 1,248 |
| 1892 | 52.1% 9,875 | 46.3% 8,785 | 1.6% 303 |
| 1888 | 52.1% 9,460 | 46.5% 8,439 | 1.5% 267 |
| 1884 | 53.3% 8,540 | 44.2% 7,075 | 2.5% 404 |
| 1880 | 55.1% 8,689 | 44.4% 7,001 | 0.5% 80 |
| 1876 | 54.6% 8,190 | 45.2% 6,790 | 0.2% 29 |
County Commission
The executive power of Hillsborough County's government is held by three county commissioners, each representing one of the three commissioner districts within the county.[14]
| Districts | Name | Hometown | Party |
|---|---|---|---|
| District 1 | Toni Pappas (Chair) | Manchester, NH | Republican |
| District 2 | Paul Bergeron (Clerk) | Nashua, NH | Democratic |
| District 3 | Robert Rowe (Vice Chair) | Amherst, NH | Republican |
In addition to the County Commission, there are five directly-elected officials: they include County Attorney, Register of Deeds, County Sheriff, Register of Probate, and County Treasurer.[15]
| Office | Name |
|---|---|
| County Attorney | Dennis Hogan (R) |
| Register of Deeds | Pamela Coughlin (R) |
| County Sheriff | Jim Hardy (R) |
| Register of Probate | B.J Perry (R) |
| County Treasurer | David Fredette (R) |
Legislative branch
The legislative branch of Hillsborough County is made up of all of the members of the New Hampshire House of Representatives from the county. In total, as of August 2018 there are 122 members from 45 different districts.
| Affiliation | Members | Voting share | |
|---|---|---|---|
| Democratic Party | 53 | 43.4% | |
| Republican Party | 67 | 54.9% | |
| Libertarian Party | 1 | 0.08% | |
| Vacant | 1 | 0.08% | |
| Total | 122 | 100% | |
Communities
Cities
- Manchester (county seat)
- Nashua (county seat)
Towns
Census-designated places
Villages
Former towns
See also
References
- 1 2 "State & County QuickFacts". United States Census Bureau. Retrieved September 24, 2013.
- 1 2 "Population and Housing Unit Estimates". Retrieved June 9, 2017.
- ↑ "2010 Census Gazetteer Files". United States Census Bureau. August 22, 2012. Archived from the original on December 27, 2014. Retrieved December 27, 2014.
- ↑ "U.S. Decennial Census". United States Census Bureau. Archived from the original on May 12, 2015. Retrieved December 27, 2014.
- ↑ "Historical Census Browser". University of Virginia Library. Retrieved December 27, 2014.
- ↑ "Population of Counties by Decennial Census: 1900 to 1990". United States Census Bureau. Retrieved December 27, 2014.
- ↑ "Census 2000 PHC-T-4. Ranking Tables for Counties: 1990 and 2000" (PDF). United States Census Bureau. Retrieved December 27, 2014.
- 1 2 3 "DP-1 Profile of General Population and Housing Characteristics: 2010 Demographic Profile Data". United States Census Bureau. Retrieved 2016-01-12.
- ↑ "Population, Housing Units, Area, and Density: 2010 - County". United States Census Bureau. Retrieved 2016-01-12.
- ↑ "DP02 SELECTED SOCIAL CHARACTERISTICS IN THE UNITED STATES – 2011-2015 American Community Survey 5-Year Estimates". United States Census Bureau. Retrieved March 7, 2017.
- ↑ "DP03 SELECTED ECONOMIC CHARACTERISTICS – 2011-2015 American Community Survey 5-Year Estimates". United States Census Bureau. Retrieved March 7, 2017.
- ↑ "The White House - Obama's Path to Victory", Time, pp. 16–17, November 19, 2012
- ↑ Leip, David. "Dave Leip's Atlas of U.S. Presidential Elections". uselectionatlas.org. Retrieved 2018-06-09.
- ↑ http://sos.nh.gov/2016CountyGen.aspx?id=8589963641
- ↑ http://hcnh.org/Departments
External links
| Wikimedia Commons has media related to Hillsborough County, New Hampshire. |
- Hillsborough County web site
- National Register of Historic Places listing for Hillsborough County
- Hillsborough County Sheriff Office
- Historical material in Statistics and Gazetteer of New Hampshire (1875)
Places adjacent to Hillsborough County, New Hampshire | ||||||||||
|---|---|---|---|---|---|---|---|---|---|---|
| ||||||||||
Municipalities and communities of Hillsborough County, New Hampshire, United States | ||
|---|---|---|
| Cities | | |
| Towns | ||
| CDPs | ||
| Other villages | ||