Kent County, Rhode Island
| Kent County, Rhode Island | |
|---|---|
| County of Rhode Island | |
| County of Kent | |
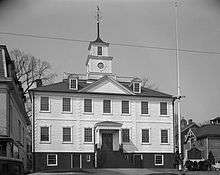 Kent County Courthouse | |
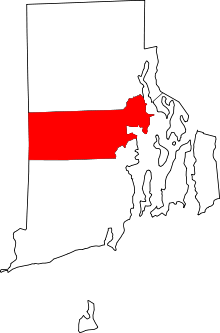 Location in the U.S. state of Rhode Island | |
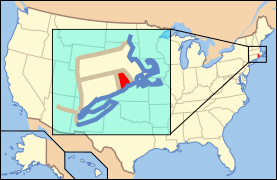 Rhode Island's location in the U.S. | |
| Founded | June 11, 1750 |
| Seat | East Greenwich |
| Largest city | Warwick |
| Area | |
| • Total | 188 sq mi (487 km2) |
| • Land | 169 sq mi (438 km2) |
| • Water | 20 sq mi (52 km2), 10% |
| Population (est.) | |
| • (2015) | 164,801 |
| • Density | 986/sq mi (381/km2) |
| Congressional district | 2nd |
| Time zone | Eastern: UTC−5/−4 |
Kent County is a county located in the U.S. state of Rhode Island. As of the 2010 census, the population was 166,158[1] making it the second-most populous county in Rhode Island. The county was formed in 1750 from the southern third of Providence County.[2] It was named after the county of Kent, England.[3] Kent County, like other counties in Rhode Island, no longer has governmental functions (other than as court administrative and sheriff corrections boundaries). Kent County is included in the Providence-Warwick, RI-MA Metropolitan Statistical Area, which in turn constitutes a portion of the greater Boston-Worcester-Providence, MA-RI-NH-CT Combined Statistical Area.
Geography
According to the U.S. Census Bureau, the county has a total area of 188 square miles (490 km2), of which 169 square miles (440 km2) is land and 20 square miles (52 km2) (10%) is water.[4]
Adjacent counties
- Providence County - north
- Bristol County - east
- Washington County - south
- New London County, Connecticut - southwest
- Windham County, Connecticut - west
- Newport County - southeast
Major highways
Demographics
| Historical population | |||
|---|---|---|---|
| Census | Pop. | %± | |
| 1790 | 8,851 | — | |
| 1800 | 8,487 | −4.1% | |
| 1810 | 9,834 | 15.9% | |
| 1820 | 10,228 | 4.0% | |
| 1830 | 12,789 | 25.0% | |
| 1840 | 13,083 | 2.3% | |
| 1850 | 15,068 | 15.2% | |
| 1860 | 17,303 | 14.8% | |
| 1870 | 18,595 | 7.5% | |
| 1880 | 20,588 | 10.7% | |
| 1890 | 26,754 | 29.9% | |
| 1900 | 29,976 | 12.0% | |
| 1910 | 36,378 | 21.4% | |
| 1920 | 38,269 | 5.2% | |
| 1930 | 51,390 | 34.3% | |
| 1940 | 58,311 | 13.5% | |
| 1950 | 77,763 | 33.4% | |
| 1960 | 112,619 | 44.8% | |
| 1970 | 142,382 | 26.4% | |
| 1980 | 154,163 | 8.3% | |
| 1990 | 161,135 | 4.5% | |
| 2000 | 167,090 | 3.7% | |
| 2010 | 166,158 | −0.6% | |
| Est. 2016 | 164,614 | [5] | −0.9% |
| U.S. Decennial Census[6] 1790-1960[7] 1900-1990[8] 1990-2000[9] 2010-2015[1] | |||
2000 census
As of the census[10] of 2000, there were 167,090 people, 67,320 households, and 44,969 families residing in the county. The population density was 982 people per square mile (379/km²). There were 70,365 housing units at an average density of 414 per square mile (160/km²). The racial makeup of the county was 95.54% White, 0.93% Black or African American, 0.23% Native American, 1.34% Asian, 0.02% Pacific Islander, 0.65% from other races, and 1.28% from two or more races. 1.69% of the population were Hispanic or Latino of any race. 20.1% were of Italian, 18.9% Irish, 11.1% English, 10.1% French, 6.1% French Canadian and 6.1% Portuguese ancestry according to Census 2000. 92.0% spoke English, 1.9% Spanish, 1.5% French, 1.4% Portuguese and 1.1% Italian as their first language.
There were 67,320 households out of which 29.90% had children under the age of 18 living with them, 52.70% were married couples living together, 10.50% had a female householder with no husband present, and 33.20% were non-families. 27.60% of all households were made up of individuals and 11.40% had someone living alone who was 65 years of age or older. The average household size was 2.45 and the average family size was 3.02.
In the county, the population was spread out with 23.20% under the age of 18, 7.00% from 18 to 24, 30.50% from 25 to 44, 24.20% from 45 to 64, and 15.10% who were 65 years of age or older. The median age was 39 years. For every 100 females, there were 92.30 males. For every 100 females age 18 and over, there were 88.70 males.
The median income for a household in the county was $47,617, and the median income for a family was $57,491. Males had a median income of $40,052 versus $29,130 for females. The per capita income for the county was $23,833. About 4.80% of families and 6.60% of the population were below the poverty line, including 7.90% of those under age 18 and 8.10% of those age 65 or over.
2010 census
As of the 2010 United States Census, there were 166,158 people, 68,645 households, and 43,747 families residing in the county.[11] The population density was 985.9 inhabitants per square mile (380.7/km2). There were 73,701 housing units at an average density of 437.3 per square mile (168.8/km2).[12] The racial makeup of the county was 93.4% white, 2.0% Asian, 1.4% black or African American, 0.3% American Indian, 1.0% from other races, and 1.8% from two or more races. Those of Hispanic or Latino origin made up 3.2% of the population.[11] The largest ancestry groups were:
![]()
![]()
![]()
![]()
![]()
![]()
![]()
![]()
![]()
![]()
![]()
![]()
![]()
Of the 68,645 households, 28.7% had children under the age of 18 living with them, 48.1% were married couples living together, 11.1% had a female householder with no husband present, 36.3% were non-families, and 29.2% of all households were made up of individuals. The average household size was 2.40 and the average family size was 2.98. The median age was 42.7 years.[11]
The median income for a household in the county was $61,088 and the median income for a family was $77,100. Males had a median income of $53,458 versus $41,380 for females. The per capita income for the county was $31,221. About 4.9% of families and 7.9% of the population were below the poverty line, including 9.5% of those under age 18 and 8.6% of those age 65 or over.[14]
Communities
City
Towns
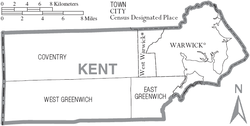
- Coventry
- East Greenwich (traditional county seat)
- West Greenwich
- West Warwick
Census-designated place
Other villages
Politics
Kent County, like most of Rhode Island, has been strongly Democratic for the last half century. In 2016, Donald Trump became the first Republican to win the county since Ronald Reagan in 1984.
| Year | Republican | Democratic | Third parties |
|---|---|---|---|
| 2016 | 46.7% 38,336 | 46.1% 37,788 | 7.2% 5,929 |
| 2012 | 40.0% 31,567 | 57.7% 45,564 | 2.3% 1,792 |
| 2008 | 40.2% 33,780 | 57.6% 48,406 | 2.3% 1,888 |
| 2004 | 43.2% 33,699 | 54.9% 42,830 | 1.9% 1,489 |
| 2000 | 34.4% 25,291 | 58.9% 43,265 | 6.7% 4,914 |
| 1996 | 28.0% 19,992 | 57.4% 41,018 | 14.7% 10,516 |
| 1992 | 30.6% 25,217 | 43.6% 35,934 | 25.8% 21,274 |
| 1988 | 47.8% 34,314 | 51.8% 37,221 | 0.4% 266 |
| 1984 | 56.2% 40,427 | 43.6% 31,352 | 0.3% 214 |
| 1980 | 39.9% 28,331 | 44.2% 31,350 | 16.0% 11,324 |
| 1976 | 48.6% 34,131 | 51.1% 35,855 | 0.3% 227 |
| 1972 | 58.2% 40,534 | 41.6% 29,004 | 0.2% 115 |
| 1968 | 37.1% 22,493 | 58.7% 35,609 | 4.2% 2,576 |
| 1964 | 21.7% 12,297 | 78.3% 44,476 | |
| 1960 | 44.3% 24,344 | 55.7% 30,662 | |
| 1956 | 65.9% 31,548 | 34.1% 16,298 | |
| 1952 | 60.9% 27,745 | 39.1% 17,824 | 0.1% 24 |
| 1948 | 51.3% 16,299 | 48.1% 15,287 | 0.6% 199 |
| 1944 | 49.3% 13,710 | 50.5% 14,059 | 0.2% 57 |
| 1940 | 50.7% 14,790 | 49.2% 14,333 | 0.1% 28 |
| 1936 | 48.4% 13,550 | 47.3% 13,238 | 4.4% 1,231 |
| 1932 | 51.0% 11,096 | 47.7% 10,398 | 1.3% 286 |
| 1928 | 60.4% 11,487 | 39.3% 7,460 | 0.3% 58 |
| 1924 | 65.8% 11,100 | 32.2% 5,429 | 2.0% 331 |
| 1920 | 70.0% 8,474 | 28.0% 3,394 | 2.0% 242 |
| 1916 | 59.4% 4,038 | 38.7% 2,632 | 1.9% 129 |
| 1912 | 38.9% 2,170 | 36.4% 2,030 | 24.7% 1,379 |
| 1908 | 65.4% 3,617 | 30.8% 1,700 | 3.8% 212 |
| 1904 | 60.3% 2,981 | 37.6% 1,859 | 2.1% 104 |
| 1900 | 66.2% 2,613 | 28.5% 1,126 | 5.3% 209 |
| 1896 | 77.4% 2,817 | 17.7% 645 | 4.9% 179 |
| 1892 | 58.8% 2,244 | 38.5% 1,469 | 2.7% 103 |
| 1888 | 60.0% 1,988 | 38.1% 1,261 | 2.0% 65 |
| 1884 | 62.2% 1,602 | 34.4% 886 | 3.5% 89 |
| 1880 | 60.0% 1,759 | 39.3% 1,153 | 0.7% 20 |
See also
References
- 1 2 "State & County QuickFacts". United States Census Bureau. Archived from the original on July 13, 2011. Retrieved November 22, 2013.
- ↑ "Rhode Island: Individual County Chronologies". Rhode Island Atlas of Historical County Boundaries. The Newberry Library. 2009. Retrieved March 15, 2015.
- ↑ Gannett, Henry (1905). The Origin of Certain Place Names in the United States. Govt. Print. Off. p. 173.
- ↑ "2010 Census Gazetteer Files". United States Census Bureau. August 22, 2012. Retrieved March 14, 2015.
- ↑ "Population and Housing Unit Estimates". Retrieved June 9, 2017.
- ↑ "U.S. Decennial Census". United States Census Bureau. Archived from the original on May 12, 2015. Retrieved March 14, 2015.
- ↑ "Historical Census Browser". University of Virginia Library. Retrieved March 14, 2015.
- ↑ Forstall, Richard L., ed. (March 27, 1995). "Population of Counties by Decennial Census: 1900 to 1990". United States Census Bureau. Retrieved March 14, 2015.
- ↑ "Census 2000 PHC-T-4. Ranking Tables for Counties: 1990 and 2000" (PDF). United States Census Bureau. April 2, 2001. Retrieved March 14, 2015.
- ↑ "American FactFinder". United States Census Bureau. Retrieved 2011-05-14.
- 1 2 3 "DP-1 Profile of General Population and Housing Characteristics: 2010 Demographic Profile Data". United States Census Bureau. Retrieved 2016-01-12.
- ↑ "Population, Housing Units, Area, and Density: 2010 - County". United States Census Bureau. Retrieved 2016-01-12.
- ↑ "DP02 SELECTED SOCIAL CHARACTERISTICS IN THE UNITED STATES – 2006-2010 American Community Survey 5-Year Estimates". United States Census Bureau. Retrieved 2016-01-12.
- ↑ "DP03 SELECTED ECONOMIC CHARACTERISTICS – 2006-2010 American Community Survey 5-Year Estimates". United States Census Bureau. Retrieved 2016-01-12.
- ↑ Leip, David. "Dave Leip's Atlas of U.S. Presidential Elections". uselectionatlas.org. Retrieved 2018-06-09.
Places adjacent to Kent County, Rhode Island | ||||||||||
|---|---|---|---|---|---|---|---|---|---|---|
| ||||||||||
Municipalities and communities of Kent County, Rhode Island, United States | ||
|---|---|---|
| City | | |
| Towns | ||
| CDP | ||
| Villages | ||
Providence (capital) | |
| Topics |
|
| Society |
|
| Regions | |
| Cities | |
| Towns |
|