United States presidential election in New Hampshire, 1944
|
| ||||||||||||||||||||||||||
| ||||||||||||||||||||||||||
| ||||||||||||||||||||||||||
| ||||||||||||||||||||||||||
(small).jpg)
| Elections in New Hampshire |
|---|
 |
The 1944 United States presidential election in New Hampshire took place on November 7, as part of the 1944 United States presidential election. State voters chose four electors to the Electoral College, which selected the president and vice president.
New Hampshire was won by the Democratic candidate, incumbent President Franklin D. Roosevelt, who won the state over New York governor Thomas E. Dewey by a narrow margin of 4.24 percent. A Democrat would not carry New Hampshire again in a presidential election until 1964.[1]
Results
| United States presidential election in New Hampshire, 1944[2] | ||||||||
|---|---|---|---|---|---|---|---|---|
| Party | Candidate | Running mate | Popular vote | Electoral vote | ||||
| Count | % | Count | % | |||||
| Democratic | Franklin Delano Roosevelt of New York | Harry S. Truman of Missouri | 119,663 | 52.11% | 4 | 100.00% | ||
| Republican | Thomas Edmund Dewey of New York | John William Bricker of Ohio | 109,916 | 47.87% | 0 | 0.00% | ||
| Socialist | Norman Thomas of New York | Darlington Hoopes of Pennsylvania | 48 | 0.02% | 0 | 0.00% | ||
| Total | 229,627 | 100.00% | 4 | 100.00% | ||||
Results by county
| County | Roosevelt# | Roosevelt% | Dewey# | Dewey% | Thomas# | Thomas% | Total votes cast[3] |
|---|---|---|---|---|---|---|---|
| Belknap | 5,325 | 46.24% | 6,188 | 53.74% | 2 | 0.02% | 11,515 |
| Carroll | 2,461 | 31.91% | 5,251 | 68.08% | 1 | 0.01% | 7,713 |
| Cheshire | 7,098 | 46.00% | 8,334 | 54.00% | 0 | 0.00% | 15,432 |
| Coös | 8,709 | 58.36% | 6,209 | 41.61% | 4 | 0.03% | 14,922 |
| Grafton | 8,743 | 44.39% | 10,947 | 55.58% | 7 | 0.04% | 19,697 |
| Hillsborough | 42,306 | 62.00% | 25,921 | 37.99% | 9 | 0.01% | 68,236 |
| Merrimack | 13,382 | 47.82% | 14,599 | 52.17% | 2 | 0.01% | 27,983 |
| Rockingham | 13,170 | 43.44% | 17,144 | 56.55% | 2 | 0.01% | 30,316 |
| Strafford | 12,497 | 57.07% | 9,388 | 42.87% | 13 | 0.06% | 21,898 |
| Sullivan | 5,972 | 50.13% | 5,935 | 49.82% | 6 | 0.05% | 11,913 |
| Totals | 119,663 | 52.11% | 109,916 | 47.87% | 46 | 0.02% | 229,625 |
References
- ↑ Dave Leip’s Atlas of U.S. Presidential Elections; Presidential General Election Results Comparison – New Hampshire
- ↑ "1944 Presidential General Election Results - New Hampshire". U.S. Election Atlas. Retrieved 23 December 2013.
- ↑ Scammon, Richard M. (compiler); America at the Polls: A Handbook of Presidential Election Statistics 1920-1964; p. 294 ISBN 0405077114
| Candidates | 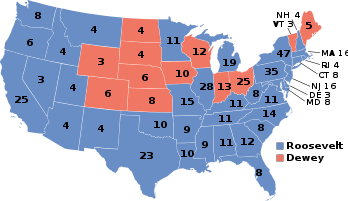 | |
|---|---|---|
| General articles |
| |
| Local results |
| |
| Other 1944 elections | ||
This article is issued from
Wikipedia.
The text is licensed under Creative Commons - Attribution - Sharealike.
Additional terms may apply for the media files.