Benzie County, Michigan
Benzie County is a county in the U.S. state of Michigan. As of the 2010 census, the population was 17,525.[2] The county seat is Beulah.[3] The county was initially set off in 1863 and organized in 1869.[1][4]
Benzie County | |
|---|---|
 | |
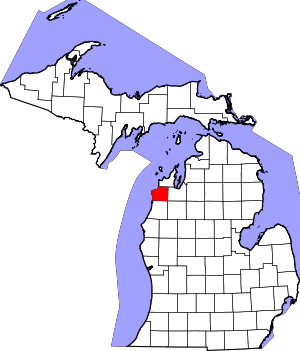 Location within the U.S. state of Michigan | |
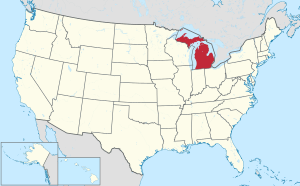 Michigan's location within the U.S. | |
| Coordinates: 44°38′N 86°15′W | |
| Country | |
| State | |
| Founded | 1863 (created) 1869 (organized)[1] |
| Named for | Betsie River |
| Seat | Beulah |
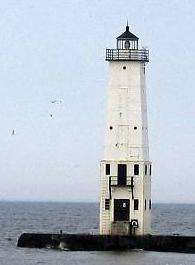
| Largest city | Frankfort |
| Area | |
| • Total | 860 sq mi (2,200 km2) |
| • Land | 320 sq mi (800 km2) |
| • Water | 540 sq mi (1,400 km2) 63%% |
| Population | |
| • Estimate (2018) | 17,753 |
| • Density | 55/sq mi (21/km2) |
| Time zone | UTC−5 (Eastern) |
| • Summer (DST) | UTC−4 (EDT) |
| Congressional district | 1st |
| Website | www |
The name Benzie is derived from the French la rivière aux Bec-scies, "the river of sawbills", bec-scie ("bill-saw") being a type of ducks. Americans altered the pronunciation of the river's name, which became known as the "Betsie River". A similar alteration in pronunciation produced "Benzie".[1] At 321 square miles (831 km²), Benzie County is the smallest of the 83 counties in Michigan in terms of land area.
Benzie County is part of the Traverse City Micropolitan Statistical Area.
Geography
According to the U.S. Census Bureau, the county has a total area of 860 square miles (2,200 km2), of which 320 square miles (830 km2) is land and 540 square miles (1,400 km2) (63%) is water.[5] It is the smallest county in Michigan by land area.
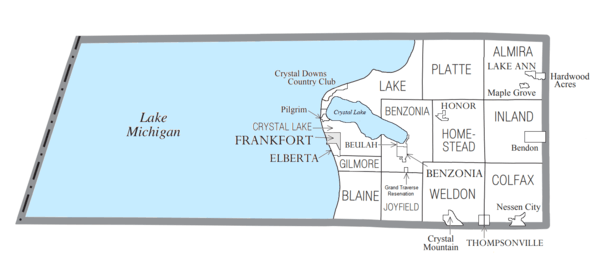
Benzie County is located in the northwest of the Lower Peninsula, in the "little finger" position of the mitten-shaped peninsula and is considered to be part of the Northern Michigan region. Lake Michigan is to the west, Leelanau County and the Leelanau Peninsula are to the north. Grand Traverse County and Traverse City are to the east. Wexford County is to the southeast and Manistee County to the south. The Sleeping Bear Dunes National Lakeshore extends into the northwest portion of the county. Crystal Lake is a prominent physical feature of the area. The Platte River rises out of a lake district around Lake Ann in the northeast of the county and flows southwest and the northwest into Big Platte Lake before emptying into Lake Michigan at Platte River Point. The Betsie River rises in neighboring Grand Traverse County, flowing southwest across the southeast corner of the county into Manistee County, where it bends northwest until just south of Benzonia where it receives the outflow of Crystal Lake and then flows mostly west through Elberta and Frankfort and into Lake Michigan.
Portions of the Pere Marquette State Forest lie within the county and offer several trails including a 10-mile (16 km) route along the Betsie River and a 5.8-mile (9.3 km) trail near Lake Ann. There are state forest campgrounds at Platte River and Lake Ann. The Betsie River State Game Area is located just east of Elberta. 50 miles (80 km) of the Betsie River is a state-designated Natural River from Grass Lake, just west of the Grand Traverse County line, to its inlet into Lake Betsie just east of Elberta. The natural and scenic richness of the area has made it a host to a variety of conservation, education, and recreation programs, including Crystalaire, the Grand Traverse Regional Land Conservancy, and others.
Major highways


Adjacent counties
- Leelanau County - north
- Grand Traverse County - east
- Manistee County - south
Demographics
| Historical population | |||
|---|---|---|---|
| Census | Pop. | %± | |
| 1870 | 2,184 | — | |
| 1880 | 3,433 | 57.2% | |
| 1890 | 5,237 | 52.5% | |
| 1900 | 9,685 | 84.9% | |
| 1910 | 10,638 | 9.8% | |
| 1920 | 6,947 | −34.7% | |
| 1930 | 6,587 | −5.2% | |
| 1940 | 7,800 | 18.4% | |
| 1950 | 8,306 | 6.5% | |
| 1960 | 7,834 | −5.7% | |
| 1970 | 8,593 | 9.7% | |
| 1980 | 11,205 | 30.4% | |
| 1990 | 12,200 | 8.9% | |
| 2000 | 15,998 | 31.1% | |
| 2010 | 17,525 | 9.5% | |
| Est. 2018 | 17,753 | [7] | 1.3% |
| U.S. Decennial Census[8] 1790-1960[9] 1900-1990[10] 1990-2000[11] 2010-2018[2] | |||
As of the 2000 census,[12] there were 15,998 people, 6,500 households, and 4,595 families residing in the county. The population density was 50 people per square mile (19/km²). There were 10,312 housing units at an average density of 32 per square mile (12/km²). The racial makeup of the county was 96.39% White, 0.28% Black or African American, 1.59% Native American, 0.16% Asian, 0.01% Pacific Islander, 0.39% from other races, and 1.19% from two or more races. 1.46% of the population were Hispanic or Latino of any race. 24.0% were of German, 13.5% Polish, 9.2% Irish, 7.6% American, 6.0% British and 5.0% French ancestry. 96.8% spoke English and 1.9% Spanish as a first language.
There were 6,500 households out of which 28.8% had children under the age of 18 living with them, 59.2% were married couples living together, 7.7% had a female householder with no husband present, and 29.30% were non-families. 24.1% of all households were made up of individuals and 10.80% had someone living alone who was 65 years of age or older. The average household size was 2.42 and the average family size was 2.86.
In the county, the population was spread out with 23.4% under the age of 18, 6.2% from 18 to 24, 27.1% from 25 to 44, 25.8% from 45 to 64, and 17.5% who were 65 years of age or older. The median age was 41 years. For every 100 females, there were 98.1 males. For every 100 females age 18 and over, there were 96.4 males.
The median income for a household in the county was $37,350, and the median income for a family was $42,716. Males had a median income of $30,218 versus $21,730 for females. The per capita income for the county was $18,524. About 4.7% of families and 7.0% of the population were below the poverty line, including 8.2% of those under age 18 and 5.2% of those age 65 or over.
Religion
- It is part of the Roman Catholic Diocese of Gaylord.[13]
Government
For most of its history, Benzie County has primarily supported Republican presidential candidates, with the only times they failed to carry to the county prior to 1992 being in 1912 & 1964. Starting with the 1992 election, the county has become more of a swing county, with 2012 being the only presidential election it did not vote for the national winner from 1980 on as of 2016.
| Year | Republican | Democratic | Third Parties |
|---|---|---|---|
| 2016 | 54.2% 5,539 | 40.2% 4,108 | 5.7% 581 |
| 2012 | 51.3% 5,075 | 47.3% 4,685 | 1.4% 141 |
| 2008 | 45.5% 4,687 | 52.9% 5,451 | 1.7% 171 |
| 2004 | 54.0% 5,284 | 44.8% 4,383 | 1.1% 111 |
| 2000 | 51.7% 4,172 | 43.9% 3,546 | 4.4% 354 |
| 1996 | 42.1% 2,856 | 45.4% 3,081 | 12.5% 848 |
| 1992 | 35.6% 2,438 | 39.6% 2,715 | 24.8% 1,699 |
| 1988 | 56.5% 3,240 | 42.5% 2,437 | 1.0% 55 |
| 1984 | 65.3% 3,590 | 33.9% 1,866 | 0.8% 46 |
| 1980 | 55.6% 3,054 | 33.5% 1,842 | 11.0% 602 |
| 1976 | 61.2% 3,085 | 37.5% 1,891 | 1.2% 62 |
| 1972 | 66.3% 2,686 | 32.3% 1,310 | 1.4% 58 |
| 1968 | 60.9% 2,138 | 32.7% 1,147 | 6.4% 225 |
| 1964 | 45.7% 1,674 | 54.2% 1,983 | 0.1% 5 |
| 1960 | 65.5% 2,484 | 34.4% 1,306 | 0.1% 5 |
| 1956 | 71.2% 2,620 | 28.4% 1,046 | 0.4% 15 |
| 1952 | 73.0% 2,752 | 26.0% 980 | 1.0% 36 |
| 1948 | 65.2% 2,013 | 31.2% 964 | 3.6% 112 |
| 1944 | 64.5% 2,026 | 34.5% 1,084 | 1.0% 32 |
| 1940 | 61.6% 2,320 | 38.0% 1,429 | 0.4% 16 |
| 1936 | 47.6% 1,742 | 46.1% 1,686 | 6.3% 230 |
| 1932 | 50.2% 1,595 | 45.1% 1,432 | 4.7% 149 |
| 1928 | 84.3% 1,849 | 14.6% 321 | 1.1% 24 |
| 1924 | 73.8% 1,922 | 7.6% 198 | 18.6% 483 |
| 1920 | 72.0% 1,520 | 20.0% 422 | 8.0% 169 |
| 1916 | 47.2% 900 | 40.4% 770 | 12.4% 237 |
| 1912 | 29.7% 568 | 17.0% 326 | 53.3% 1,019 |
| 1908 | 63.0% 1,437 | 24.2% 551 | 12.9% 294 |
| 1904 | 74.1% 1,582 | 13.8% 295 | 12.1% 259 |
| 1900 | 66.3% 1,472 | 28.2% 626 | 5.5% 123 |
| 1896 | 60.4% 1,366 | 35.5% 803 | 4.1% 93 |
| 1892 | 52.5% 774 | 33.8% 498 | 13.8% 203 |
| 1888 | 57.6% 710 | 33.4% 412 | 9.0% 111 |
| 1884 | 54.9% 556 | 37.5% 380 | 7.6% 77 |
The county government operates the jail, maintains rural roads, operates the major local courts, keeps files of deeds and mortgages, maintains vital records, administers public health regulations, and participates with the state in the provision of welfare and other social services. The county board of commissioners controls the budget but has only limited authority to make laws or ordinances. In Michigan, most local government functions — police and fire, building and zoning, tax assessment, street maintenance, etc. — are the responsibility of individual cities and townships.
Elected officials
- Prosecuting Attorney: Sara Swanson
- Sheriff: Ted Schendel
- County Clerk: Dawn Olney
- County Treasurer: Michelle L. Thompson
- Register of Deeds: Amy Bissell
- Drain Commissioner: Edward Hoogterp
- County Surveyor: John Smendzuik
(information as of September 2005)
Historic locations
There are eight historical markers in the County:[16]
- Benzonia College
- Benzonia Congregational Church
- Bruce Catton
- Car Ferries on Lake Michigan
- Joyfield Cemetery
- Marquette's Death
- Mills Community House
- Pacific Salmon
Communities
City
Census-designated places
Townships
Indian reservations
- The Grand Traverse Indian Reservation, which has territory in five counties, occupies a small area in southern Joyfield Township in Benzie County.
Ghost towns
- Allyn Station (Pratts)
- Almira
- Aral
- Cedar Run
- Edgewater
- Gilmore
- Grant House (Homestead)
- Homestead
- Inland
- Joyfield
- Kentville
- Melva
- Osborn
- Oviat
- Platte
- Playtte River (Melva)
- Pratts
- Stormer
- Success (Ransom Creek)
- Wallin
- Weldon
Source:[17]
See also
- List of Michigan State Historic Sites in Benzie County, Michigan
- National Register of Historic Places listings in Benzie County, Michigan
- USS Benzie County (LST-266)
References
- "Bibliography on Benzie County". Clarke Historical Library, Central Michigan University. Retrieved January 19, 2013.
- "State & County QuickFacts". United States Census Bureau. Retrieved August 26, 2013.
- "Find a County". National Association of Counties. Archived from the original on May 31, 2011. Retrieved June 7, 2011.
- County place names Archived July 28, 2009, at the Wayback Machine
- "2010 Census Gazetteer Files". United States Census Bureau. August 22, 2012. Archived from the original on November 13, 2013. Retrieved September 19, 2014.
- "M-168 Endpoint Photos". state-ends.com. Archived from the original on December 11, 2007.
- "Population and Housing Unit Estimates". Retrieved May 18, 2019.
- "U.S. Decennial Census". United States Census Bureau. Archived from the original on April 26, 2015. Retrieved September 19, 2014.
- "Historical Census Browser". University of Virginia Library. Retrieved September 19, 2014.
- "Population of Counties by Decennial Census: 1900 to 1990". United States Census Bureau. Retrieved September 19, 2014.
- "Census 2000 PHC-T-4. Ranking Tables for Counties: 1990 and 2000" (PDF). United States Census Bureau. Retrieved September 19, 2014.
- Statistical profile of Benzie County, Michigan Archived April 10, 2008, at the Wayback Machine, United States Census Bureau, Census 2000
- "The Diocese of Gaylord, Michigan : A Diocese of the Roman Catholic Church - Diocese of Gaylord". dioceseofgaylord.org.
- http://uselectionatlas.org/RESULTS
- http://www.benzieco.net/
- "Michigan Historical Markers". michmarkers.com. Archived from the original on 2010-03-15. Retrieved 2008-04-10.
- Dodge, Roy L., Michigan Ghost Towns of the Lower Peninsula ISBN 0-932212-64-6 ISBN 978-0-932212-64-1
Further reading
External links
Places adjacent to Benzie County, Michigan | ||||||||||
|---|---|---|---|---|---|---|---|---|---|---|
| ||||||||||
Municipalities and communities of Benzie County, Michigan, United States | ||
|---|---|---|
| City | Map of Michigan highlighting Benzie County.svg | |
| Villages | ||
| Civil townships | ||
| CDPs | ||
| Indian reservation | ||
| Footnotes | ‡This populated place also has portions in an adjacent county or counties | |
| Central cities | |
|---|---|
| Counties | |
| Geography | |
| Transportation | |
| Economy | |
| |
| Authority control |
|
|---|