Lake County, Michigan
Lake County is a county located in the U.S. state of Michigan. As of the 2010 census, the population was 11,539.[2] The county seat is Baldwin.[3]
Lake County | |
|---|---|
 Lake County Courthouse | |
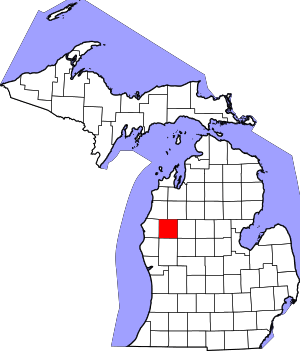 Location within the U.S. state of Michigan | |
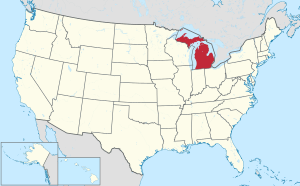 Michigan's location within the U.S. | |
| Coordinates: 43°59′N 85°49′W | |
| Country | |
| State | |
| Founded | 1840, organized 1871.[1] |
| Seat | Baldwin |
| Largest village | Baldwin |
| Area | |
| • Total | 574 sq mi (1,490 km2) |
| • Land | 567 sq mi (1,470 km2) |
| • Water | 6.9 sq mi (18 km2) 1.2%% |
| Population | |
| • Estimate (2018) | 11,881 |
| • Density | 20/sq mi (8/km2) |
| Time zone | UTC−5 (Eastern) |
| • Summer (DST) | UTC−4 (EDT) |
| Congressional district | 2nd |
| Website | www |
History
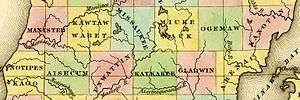
The county was created by the Michigan Legislature in 1840 as Aishcum County, then renamed Lake County in 1843, for its many lakes. It was administered by a succession of other Michigan counties prior to the organization of county government in 1871.[1][4]
Geography
According to the U.S. Census Bureau, the county has a total area of 574 square miles (1,490 km2), of which 567 square miles (1,470 km2) is land and 6.9 square miles (18 km2) (1.2%) is water.[5]
Adjacent counties
- Manistee County (northwest)
- Wexford County (northeast)
- Osceola County (east)
- Newaygo County (south)
- Mason County (west)
National protected area
- Manistee National Forest (part)
Demographics
| Historical population | |||
|---|---|---|---|
| Census | Pop. | %± | |
| 1870 | 548 | — | |
| 1880 | 3,233 | 490.0% | |
| 1890 | 6,505 | 101.2% | |
| 1900 | 4,957 | −23.8% | |
| 1910 | 4,939 | −0.4% | |
| 1920 | 4,437 | −10.2% | |
| 1930 | 4,066 | −8.4% | |
| 1940 | 4,798 | 18.0% | |
| 1950 | 5,257 | 9.6% | |
| 1960 | 5,338 | 1.5% | |
| 1970 | 5,661 | 6.1% | |
| 1980 | 7,711 | 36.2% | |
| 1990 | 8,583 | 11.3% | |
| 2000 | 11,333 | 32.0% | |
| 2010 | 11,539 | 1.8% | |
| Est. 2018 | 11,881 | [6] | 3.0% |
| U.S. Decennial Census[7] 1790-1960[8] 1900-1990[9] 1990-2000[10] 2010-2018[2] | |||
As of the census[11] of 2000, there were 11,333 people, 4,704 households, and 3,052 families residing in the county. The population density was 20 people per square mile (8/km²). There were 13,498 housing units at an average density of 24 per square mile (9/km²). The racial makeup of the county was 84.66% White, 11.17% Black or African American, 1.01% Native American, 0.15% Asian, 0.04% Pacific Islander, 0.57% from other races, and 2.40% from two or more races. 1.69% of the population were Hispanic or Latino of any race. 20.2% were of English ancestry, 20.0% were of German ancestry, 8.4% were of Irish ancestry, and 6.1% were of Dutch ancestry. 97.5% spoke English and 1.3% Spanish as their first language.
There were 4,704 households out of which 23.00% had children under the age of 18 living with them, 52.40% were married couples living together, 8.70% had a female householder with no husband present, and 35.10% were non-families. 29.60% of all households were made up of individuals and 13.80% had someone living alone who was 65 years of age or older. The average household size was 2.28 and the average family size was 2.79.
In the county, the population was spread out with 21.90% under the age of 18, 8.00% from 18 to 24, 22.70% from 25 to 44, 27.60% from 45 to 64, and 19.70% who were 65 years of age or older. The median age was 43 years. For every 100 females there were 109.10 males. For every 100 females age 18 and over, there were 107.60 males.
The median income for a household in the county was $26,622, and the median income for a family was $32,086. Males had a median income of $30,124 versus $21,886 for females. The per capita income for the county was $14,457. About 14.70% of families and 19.40% of the population were below the poverty line, including 28.30% of those under age 18 and 12.00% of those age 65 or over. 24/7 Wall St. reported that Lake County is the poorest county in Michigan.[12]
Government
| Year | Republican | Democratic | Third Parties |
|---|---|---|---|
| 2016 | 59.0% 3,159 | 36.2% 1,939 | 4.9% 260 |
| 2012 | 46.8% 2,487 | 51.8% 2,752 | 1.3% 71 |
| 2008 | 42.9% 2,269 | 55.2% 2,919 | 2.0% 104 |
| 2004 | 47.7% 2,503 | 51.0% 2,675 | 1.3% 68 |
| 2000 | 41.8% 1,961 | 55.1% 2,584 | 3.2% 148 |
| 1996 | 27.6% 1,213 | 59.3% 2,606 | 13.1% 575 |
| 1992 | 26.3% 1,194 | 51.7% 2,351 | 22.0% 1,001 |
| 1988 | 46.3% 1,713 | 53.0% 1,958 | 0.7% 27 |
| 1984 | 53.1% 2,125 | 46.1% 1,845 | 0.8% 33 |
| 1980 | 43.2% 1,730 | 51.0% 2,041 | 5.8% 232 |
| 1976 | 42.0% 1,598 | 57.2% 2,179 | 0.8% 31 |
| 1972 | 48.9% 1,532 | 49.4% 1,548 | 1.6% 51 |
| 1968 | 39.1% 1,094 | 53.0% 1,482 | 7.9% 222 |
| 1964 | 28.6% 791 | 71.4% 1,978 | 0.0% 1 |
| 1960 | 52.3% 1,441 | 47.6% 1,313 | 0.1% 3 |
| 1956 | 59.8% 1,614 | 40.1% 1,083 | 0.1% 2 |
| 1952 | 57.5% 1,549 | 41.8% 1,127 | 0.7% 20 |
| 1948 | 54.1% 1,348 | 43.3% 1,077 | 2.6% 65 |
| 1944 | 58.8% 1,145 | 40.8% 794 | 0.4% 7 |
| 1940 | 56.6% 1,413 | 42.9% 1,070 | 0.5% 12 |
| 1936 | 43.8% 1,091 | 53.6% 1,337 | 2.6% 65 |
| 1932 | 42.9% 991 | 53.7% 1,241 | 3.5% 80 |
| 1928 | 73.1% 1,147 | 26.1% 409 | 0.9% 14 |
| 1924 | 68.8% 1,069 | 20.1% 313 | 11.1% 172 |
| 1920 | 74.8% 926 | 21.1% 261 | 4.1% 51 |
| 1916 | 60.7% 588 | 35.8% 347 | 3.5% 34 |
| 1912 | 24.0% 227 | 19.7% 186 | 56.3% 532 |
| 1908 | 68.9% 673 | 25.9% 253 | 5.2% 51 |
| 1904 | 79.4% 907 | 18.5% 211 | 2.1% 24 |
| 1900 | 68.9% 841 | 28.7% 350 | 2.5% 30 |
| 1896 | 60.6% 888 | 37.3% 547 | 2.1% 30 |
| 1892 | 47.8% 648 | 45.0% 610 | 7.2% 98 |
| 1888 | 54.2% 1,061 | 41.3% 807 | 4.5% 88 |
| 1884 | 55.4% 951 | 38.2% 656 | 6.4% 109 |
The county government operates the jail, maintains rural roads, operates the major local courts, keeps files of deeds and mortgages, maintains vital records, administers public health regulations, and participates with the state in the provision of welfare and other social services. The county board of commissioners controls the budget but has only limited authority to make laws or ordinances. In Michigan, most local government functions — police and fire, building and zoning, tax assessment, street maintenance, etc. — are the responsibility of individual cities and townships.
Elected officials
- Chief Trial Court Judge: Mark S. Wickens
- Prosecuting Attorney: Craig Cooper
- Sheriff: Richard L. Martin
- County Clerk/Register of Deeds: Patti Pacola
- County Treasurer: Brenda Kutchinski
- County Surveyor: Patrick Johnson
(information as of December 2016)
Communities
See also
- List of Michigan State Historic Sites in Lake County, Michigan
- National Register of Historic Places listings in Lake County, Michigan
References
- "Bibliography on Lake County". Clarke Historical Library, Central Michigan University. Retrieved November 4, 2016.
- "State & County QuickFacts". United States Census Bureau. Archived from the original on July 17, 2011. Retrieved August 28, 2013.
- "Find a County". National Association of Counties. Retrieved June 7, 2011.
- Newberry Library. "Michigan: Individual County Chronologies". Atlas of County Historical Boundaries. Retrieved November 4, 2016.
- "2010 Census Gazetteer Files". United States Census Bureau. August 22, 2012. Archived from the original on November 13, 2013. Retrieved September 26, 2014.
- "Population and Housing Unit Estimates". Retrieved May 17, 2019.
- "U.S. Decennial Census". United States Census Bureau. Retrieved September 26, 2014.
- "Historical Census Browser". University of Virginia Library. Retrieved September 26, 2014.
- "Population of Counties by Decennial Census: 1900 to 1990". United States Census Bureau. Retrieved September 26, 2014.
- "Census 2000 PHC-T-4. Ranking Tables for Counties: 1990 and 2000" (PDF). United States Census Bureau. Retrieved September 26, 2014.
- "U.S. Census website". United States Census Bureau. Retrieved 2008-01-31.
- Frohlich, Thomas C.; Kent, Alexander; Sauter, Michael B.; Stebbins, Sam (January 27, 2016). "The Poorest County in Every State". 24/7 Wall St. Retrieved January 27, 2016.
- Leip, David. "Dave Leip's Atlas of U.S. Presidential Elections". uselectionatlas.org. Retrieved 10 April 2018.
External links
- Lake County Road Commission Website
- "Bibliography on Lake County". Clarke Historical Library, Central Michigan University. Retrieved January 19, 2013.
- Lake County Website
- Lake County Chamber of Commerce
Places adjacent to Lake County, Michigan | ||||||||||
|---|---|---|---|---|---|---|---|---|---|---|
| ||||||||||
Municipalities and communities of Lake County, Michigan, United States | ||
|---|---|---|
| Villages | Map of Michigan highlighting Lake County.svg | |
| Townships | ||
| Unincorporated communities | ||
| Central cities | |
|---|---|
| Counties | |
| Geography | |
| Transportation | |
| Economy | |
| |
| Central cities | |||
|---|---|---|---|
| Counties |
| ||
| Geography | |||
| Transportation | |||
| Economy | |||
| |||

| Authority control |
|
|---|