Kalamazoo County, Michigan
Kalamazoo County is a county located in the U.S. state of Michigan. As of 2019, the population was 265,066.[2] The county seat is Kalamazoo.[3]
Kalamazoo County | |
|---|---|
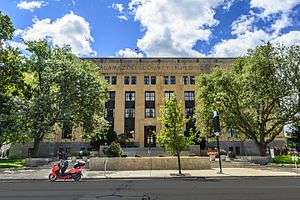 Kalamazoo County Courthouse | |
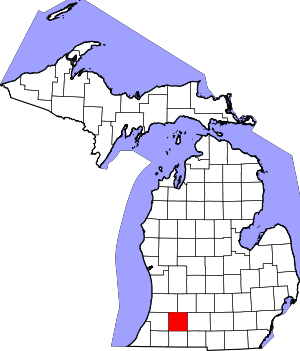 Location within the U.S. state of Michigan | |
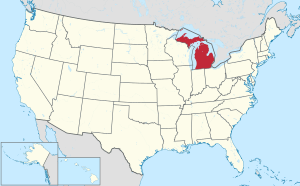 Michigan's location within the U.S. | |
| Coordinates: 42°14′N 85°32′W | |
| Country | |
| State | |
| Founded | May 7, 1830[1] |
| Seat | Kalamazoo |
| Largest city | Kalamazoo |
| Area | |
| • Total | 580 sq mi (1,500 km2) |
| • Land | 562 sq mi (1,460 km2) |
| • Water | 19 sq mi (50 km2) 3.2%% |
| Population | |
| • Estimate (2019) | 265,066 |
| • Density | 446/sq mi (172/km2) |
| Time zone | UTC−5 (Eastern) |
| • Summer (DST) | UTC−4 (EDT) |
| Congressional district | 6th |
| Website | www |
Kalamazoo County is included in the Kalamazoo–Portage, MI Metropolitan Statistical Area.
History
Kalamazoo County was organized in 1830, although its set off date is unknown.[1] The village of Kalamazoo (then known as Bronson) was made the county seat in 1831.[4]
The name purportedly means "the mirage or reflecting river" and the original Indian name was "Kikalamazoo".[1] See, Etymology of Kalamazoo for detail on the origin of the name. See also, List of Michigan county name etymologies.
Geography
According to the U.S. Census Bureau, the county has a total area of 580 square miles (1,500 km2), of which 562 square miles (1,460 km2) is land and 19 square miles (49 km2) (3.2%) is water.[5]
Geographic features
- Kalamazoo River
- Portage River
Adjacent counties
- Barry County - northeast
- Allegan County - northwest
- Calhoun County - east
- Van Buren County - west
- Branch County - southeast
- St. Joseph County - south
- Cass County - southwest
Transportation
Air service
- The Kalamazoo & Battle Creek Metro Area is served by Kalamazoo/Battle Creek International Airport.
Highways


Demographics
| Historical population | |||
|---|---|---|---|
| Census | Pop. | %± | |
| 1840 | 7,380 | — | |
| 1850 | 13,179 | 78.6% | |
| 1860 | 24,646 | 87.0% | |
| 1870 | 32,054 | 30.1% | |
| 1880 | 34,342 | 7.1% | |
| 1890 | 39,273 | 14.4% | |
| 1900 | 44,310 | 12.8% | |
| 1910 | 60,327 | 36.1% | |
| 1920 | 71,225 | 18.1% | |
| 1930 | 91,368 | 28.3% | |
| 1940 | 100,085 | 9.5% | |
| 1950 | 126,707 | 26.6% | |
| 1960 | 169,712 | 33.9% | |
| 1970 | 201,550 | 18.8% | |
| 1980 | 212,378 | 5.4% | |
| 1990 | 223,411 | 5.2% | |
| 2000 | 238,603 | 6.8% | |
| 2010 | 250,331 | 4.9% | |
| Est. 2019 | 265,066 | [6] | 5.9% |
| U.S. Decennial Census[7] 1790-1960[8] 1900-1990[9] 1990-2000[10] 2010-2019[11] | |||
As of the 2010 United States Census,[12] there were 250,331 people living in the county. 80.1% were non-Hispanic White, 11.1% Black or African American, 2.2% Asian, 0.5% Native American, and 3.0% of two or more races. 4.0% were Hispanic or Latino (of any race).
As of the 2000 United States Census,[13] there were 238,603 people, 93,479 households, and 57,956 families living in the county. The population density was 425 people per square mile (164/km²). There were 99,250 housing units at an average density of 177 per square mile (68/km²). The racial makeup of the county was 84.57% White, 9.73% Black or African American, 0.41% Native American, 1.83% Asian, 0.03% Pacific Islander, 1.27% from other races, and 2.15% from two or more races. 2.64% of the population were Hispanic or Latino of any race. 18.3% were of German, 11.5% Dutch, 10.3% English, 8.4% Irish and 7.2% American ancestry according to Census 2000. 93.7% spoke English and 2.8% Spanish as their first language.
There were 93,479 households out of which 30.40% had children under the age of 18 living with them, 47.70% were married couples living together, 11.00% had a female householder with no husband present, and 38.00% were non-families. 28.00% of all households were made up of individuals and 8.50% had someone living alone who was 65 years of age or older. The average household size was 2.43 and the average family size was 3.00.
The county population contained 24.10% under the age of 18, 15.20% from 18 to 24, 28.20% from 25 to 44, 21.10% from 45 to 64, and 11.40% who were 65 years of age or older. The median age was 33 years. For every 100 females, there were 93.60 males. For every 100 females age 18 and over, there were 90.50 males.
The median income for a household in the county was $42,022, and the median income for a family was $53,953. Males had a median income of $39,611 versus $27,965 for females. The per capita income for the county was $21,739. About 6.50% of families and 12.00% of the population were below the poverty line, including 12.30% of those under age 18 and 6.30% of those age 65 or over.
Government
Kalamazoo County was a bastion of the Republican Party following the Civil War. From 1884 until 1988, voters selected the Republican Party nominee all but three times–in 1912, 1936 and 1964. However, since 1992 the county has voted Democratic in national elections (through 2016).
| Year | Republican | Democratic | Third Parties |
|---|---|---|---|
| 2016 | 40.4% 51,034 | 53.2% 67,148 | 6.4% 8,117 |
| 2012 | 42.6% 52,662 | 55.8% 69,051 | 1.6% 1,977 |
| 2008 | 39.3% 51,554 | 58.8% 77,051 | 1.9% 2,456 |
| 2004 | 47.7% 57,147 | 51.3% 61,462 | 1.0% 1,174 |
| 2000 | 47.9% 48,254 | 48.5% 48,807 | 3.6% 3,595 |
| 1996 | 43.7% 40,703 | 49.0% 45,644 | 7.3% 6,788 |
| 1992 | 36.6% 38,035 | 42.0% 43,568 | 21.4% 22,255 |
| 1988 | 55.6% 50,205 | 43.7% 39,457 | 0.6% 573 |
| 1984 | 63.8% 58,327 | 35.5% 32,460 | 0.7% 601 |
| 1980 | 50.9% 48,669 | 36.1% 34,528 | 13.0% 12,420 |
| 1976 | 59.1% 51,462 | 38.4% 33,411 | 2.5% 2,212 |
| 1972 | 58.8% 50,405 | 38.9% 33,324 | 2.4% 2,041 |
| 1968 | 53.9% 39,796 | 35.8% 26,437 | 10.3% 7,599 |
| 1964 | 39.8% 27,100 | 59.9% 40,789 | 0.3% 215 |
| 1960 | 63.5% 42,800 | 36.0% 24,286 | 0.5% 348 |
| 1956 | 70.5% 43,305 | 29.0% 17,808 | 0.5% 320 |
| 1952 | 66.8% 38,847 | 32.6% 18,967 | 0.6% 371 |
| 1948 | 57.3% 23,799 | 39.5% 16,393 | 3.2% 1,325 |
| 1944 | 60.0% 24,974 | 39.0% 16,223 | 1.1% 457 |
| 1940 | 58.7% 25,596 | 40.7% 17,733 | 0.7% 293 |
| 1936 | 47.7% 17,824 | 47.8% 17,870 | 4.5% 1,686 |
| 1932 | 55.0% 18,584 | 41.4% 13,974 | 3.6% 1,227 |
| 1928 | 79.2% 23,626 | 19.9% 5,946 | 0.9% 258 |
| 1924 | 75.3% 18,451 | 14.6% 3,587 | 10.1% 2,462 |
| 1920 | 67.5% 13,765 | 25.9% 5,271 | 6.6% 1,348 |
| 1916 | 42.0% 5,951 | 50.6% 7,164 | 7.5% 1,058 |
| 1912 | 21.5% 2,642 | 29.7% 3,660 | 48.8% 6,006 |
| 1908 | 54.6% 6,511 | 37.6% 4,477 | 7.8% 930 |
| 1904 | 62.3% 7,163 | 28.4% 3,264 | 9.3% 1,064 |
| 1900 | 53.6% 6,010 | 42.0% 4,707 | 4.4% 492 |
| 1896 | 51.2% 5,891 | 47.2% 5,434 | 1.7% 190 |
| 1892 | 50.6% 4,968 | 40.9% 4,018 | 8.5% 839 |
| 1888 | 54.7% 5,437 | 39.7% 3,950 | 5.6% 560 |
| 1884 | 51.8% 4,515 | 43.0% 3,750 | 5.2% 455 |
The county government operates the jail, provides law enforcement in unincorporated areas, maintains rural roads, operates the major local courts, keeps files of deeds and mortgages, maintains vital records, administers public health regulations, and participates with the state in the provision of welfare and other social services. The county board of commissioners controls the budget but has only limited authority to make laws or ordinances. In Michigan, most local government functions—fire, building and zoning, tax assessment, street maintenance, etc.—are the responsibility of individual cities and townships.
Elected officials
- Prosecuting Attorney: Jeffrey S. Getting (Democrat)
- Sheriff: Richard Fuller (Democrat)
- County Clerk/Register of Deeds: Timothy A. Snow (Republican)
- County Treasurer: Mary Balkema (Republican)
- Drain Commissioner: Patricia A. S. Crowley (Democrat)
- County Surveyor: Gary D. Hahn (Republican)
- County Commission or Board of Commissioners: 11 members, elected from districts (9 Democrats, 2 Republicans)[15]
- Circuit Court: 7 judges (all non-partisan)
(information current as of August 2019)
Communities
Villages
Census-designated places
- Comstock Northwest
- Eastwood
- Greater Galesburg (before 2010)
- South Gull Lake
- Westwood
Other unincorporated communities
- Adams Park[16]
- Burdick Settlement (1833)
- Comstock
- Cooper Center
- East Comstock
- Fulton
- Lawndale
- Gull Lake
- Midland Park
- Milwood[16]
- Scotts
- Shirland (proposed 1831)
- Yorkville
Townships
- Alamo Township
- Brady Township
- Charleston Township
- Climax Township
- Comstock Charter Township
- Cooper Charter Township
- Kalamazoo Charter Township
- Oshtemo Charter Township
- Pavilion Township
- Prairie Ronde Township
- Richland Township
- Ross Township
- Schoolcraft Township
- Texas Charter Township
- Wakeshma Township
See also
- List of Michigan State Historic Sites in Kalamazoo County, Michigan
- National Register of Historic Places listings in Kalamazoo County, Michigan
References
- "Bibliography on Kalamazoo County". Clarke Historical Library, Central Michigan University. Retrieved January 19, 2013.
- "U.S. Census website". United States Census Bureau. Retrieved April 18, 2019.
- "Find a County". National Association of Counties. Archived from the original on May 31, 2011. Retrieved June 7, 2011.
- [No author] (1880). History of Kalamazoo County, Michigan, pp. 99-101. Everts & Abbott.
- "2010 Census Gazetteer Files". United States Census Bureau. August 22, 2012. Archived from the original on November 13, 2013. Retrieved September 26, 2014.
- "Population and Housing Unit Estimates". Retrieved March 26, 2020.
- "U.S. Decennial Census". United States Census Bureau. Retrieved September 26, 2014.
- "Historical Census Browser". University of Virginia Library. Retrieved September 26, 2014.
- "Population of Counties by Decennial Census: 1900 to 1990". United States Census Bureau. Retrieved September 26, 2014.
- "Census 2000 PHC-T-4. Ranking Tables for Counties: 1990 and 2000" (PDF). United States Census Bureau. Retrieved September 26, 2014.
- "State & County QuickFacts". United States Census Bureau. Archived from the original on July 7, 2011. Retrieved August 28, 2013.
- "U.S. Census website". United States Census Bureau. Retrieved April 26, 2016.
- "U.S. Census website". United States Census Bureau. Retrieved January 31, 2008.
- US Election Atlas
- Moore, Lindsay (August 27, 2019). "Newly appointed Kalamazoo County commissioner, a Democrat, flips District 6 seat". Kalamazoo Gazette. Dan Gaydou. Retrieved August 28, 2019.
- Google (October 3, 2018). "Kalamazoo County, MI" (Map). Google Maps. Google. Retrieved October 3, 2018.
External links
| Wikimedia Commons has media related to Kalamazoo County, Michigan. |
- Kalamazoo County Government
- "Bibliography on Kalamazoo County". Clarke Historical Library, Central Michigan University.
Places adjacent to Kalamazoo County, Michigan | ||||||||||
|---|---|---|---|---|---|---|---|---|---|---|
| ||||||||||
Municipalities and communities of Kalamazoo County, Michigan, United States | ||
|---|---|---|
| Cities | Map of Michigan highlighting Kalamazoo County.svg | |
| Villages | ||
| Charter townships | ||
| General law townships | ||
| CDPs | ||
| Other unincorporated communities |
| |
| Central cities | |||
|---|---|---|---|
| Counties |
| ||
| Geography | |||
| Transportation | |||
| Economy | |||
| |||