Ottawa County, Michigan
Ottawa County is a county located in the U.S. state of Michigan. As of the United States 2010 Census, the population was 263,801.[2] The county seat is Grand Haven.[3] The county is named for the Ottawa Nation. It was set off in 1831 and organized in 1837.[1]
Ottawa County | |
|---|---|
.jpg) Ottawa County Courthouse in Grand Haven | |
Logo | |
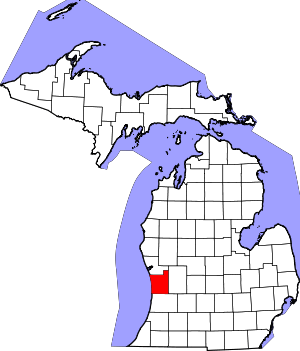 Location within the U.S. state of Michigan | |
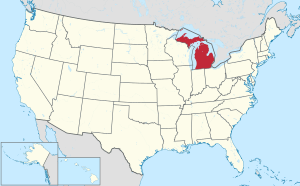 Michigan's location within the U.S. | |
| Coordinates: 42°55′N 86°14′W | |
| Country | |
| State | |
| Founded | 1831 (authorized) 1837 (organized)[1] |
| Named for | Ottawa Nation |
| Seat | Grand Haven |
| Largest city | Holland |
| Area | |
| • Total | 1,631 sq mi (4,220 km2) |
| • Land | 563 sq mi (1,460 km2) |
| • Water | 1,068 sq mi (2,770 km2) 65%% |
| Population | |
| • Estimate (2019) | 291,830 |
| • Density | 509/sq mi (197/km2) |
| Time zone | UTC−5 (Eastern) |
| • Summer (DST) | UTC−4 (EDT) |
| Congressional district | 2nd |
Ottawa County is included in the Grand Rapids-Kentwood, MI Metropolitan Statistical Area.
Geography
According to the US Census Bureau, the county has a total area of 1,631 square miles (4,220 km2), of which 563 square miles (1,460 km2) is land and 1,068 square miles (2,770 km2) (65%) is water.[4]
Bodies of water
Adjacent counties
- Muskegon County – north
- Kent County – east
- Allegan County – south
- Milwaukee County, Wisconsin – west (across Lake Michigan)
- Racine County, Wisconsin – west (across Lake Michigan)
Demographics
| Historical population | |||
|---|---|---|---|
| Census | Pop. | %± | |
| 1840 | 208 | — | |
| 1850 | 5,587 | 2,586.1% | |
| 1860 | 13,215 | 136.5% | |
| 1870 | 26,651 | 101.7% | |
| 1880 | 33,126 | 24.3% | |
| 1890 | 35,358 | 6.7% | |
| 1900 | 39,667 | 12.2% | |
| 1910 | 45,301 | 14.2% | |
| 1920 | 47,660 | 5.2% | |
| 1930 | 54,858 | 15.1% | |
| 1940 | 59,660 | 8.8% | |
| 1950 | 73,751 | 23.6% | |
| 1960 | 98,719 | 33.9% | |
| 1970 | 128,181 | 29.8% | |
| 1980 | 157,174 | 22.6% | |
| 1990 | 187,768 | 19.5% | |
| 2000 | 238,314 | 26.9% | |
| 2010 | 263,801 | 10.7% | |
| Est. 2019 | 291,830 | [5] | 10.6% |
| US Decennial Census[6] 1790-1960[7] 1900-1990[8] 1990-2000[9] 2010-2019[2] | |||
As of the 2010 United States Census, there were 263,801 people living in the county. 90.1% were White, 2.6% Asian, 1.5% Black or African American, 0.4% Native American, 3.4% of some other race and 2.0% of two or more races. 8.6% were Hispanic or Latino (of any race). 31.0% were of Dutch, 14.2% German, 5.8% English and 5.7% Irish ancestry.[10]
As of the 2000 United States Census,[11] there were 238,314 people, 81,662 households, and 61,328 families in the county. The population density was 421 people per square mile (163/km²). There were 86,856 housing units at an average density of 154 per square mile (59/km²). The racial makeup of the county was 91.52% White, 1.05% Black or African American, 0.36% Native American, 2.09% Asian, 0.02% Pacific Islander, 3.48% from other races, and 1.48% from two or more races. 7.00% of the population were Hispanic or Latino of any race. 37.3% reported being of Dutch, 14.6% German, 6.2% English, 5.6% Irish and 5.4% American ancestry, 91.5% spoke only English at home; 5.4% spoke Spanish.
There were 81,662 households out of which 39.30% had children under the age of 18 living with them, 64.60% were married couples living together, 7.50% had a female householder with no husband present, and 24.90% were non-families. 19.60% of all households were made up of individuals and 7.40% had someone living alone who was 65 years of age or older. The average household size was 2.81 and the average family size was 3.25.
The county has numerous seasonal residents during the summer. Port Sheldon Township has many lakefront homes and other inland retreats that serve as summer getaways for residents of Grand Rapids, Detroit, and Chicago. No official statistics are compiled on seasonal residents.
The county population contains 28.70% under the age of 18, 11.90% from 18 to 24, 29.30% from 25 to 44, 20.00% from 45 to 64, and 10.10% who were 65 years of age or older. The median age was 32 years. For every 100 females, there were 97.00 males. For every 100 females age 18 and over, there were 94.20 males.
The Robert Wood Johnson Foundation ranks Ottawa County as Michigan's second-healthiest county,[12] preceded only by the leisure-oriented Traverse City area.
The median income for a household in the county was $52,347, and the median income for a family was $59,896. Males had a median income of $42,180 versus $27,706 for females. The per capita income for the county was $21,676. About 3.10% of families and 5.50% of the population were below the poverty line, including 4.70% of those under age 18 and 4.90% of those age 65 or over.
Religion
- The Christian Reformed Church in North America had 67 churches and 33,700 members
- the Reformed Church in America had 47 congregations and 33,300 members
- the Catholic Church had 11 churches and 24,700 members.[13]
- The Church of Jesus Christ of Latter-day Saints has two meetinghouses in the county.[14]
- The Protestant Reformed Churches have around 10 large congregations in the county
Government
Ottawa County operates the County jail, maintains rural roads, operates the major local courts, records deeds, mortgages, and vital records, administers public health regulations, and participates with the state in the provision of social services. The county board of commissioners controls the budget and has limited authority to make laws or ordinances. In Michigan, most local government functions – police and fire, building and zoning, tax assessment, street maintenance etc. – are the responsibility of individual cities and townships.
Elected officials
- County Commissioners[15]
- Prosecuting Attorney – Ronald J. Frantz
- Sheriff – Steve Kempker
- County Clerk/Register of Deeds – Justin F. Roebuck
- County Treasurer – Bradley Slagh
- Drain Commissioner – Joe Bush
(information as of September 2018)
Local Policies
Beginning in 2012, County Administrator Alan Vanderberg and the Board of Commissioners adopted the "Four Cs" Initiative including "Cultural Intelligence." At that time, Vanderberg asserted that "discrimination is not only alive and well, but it will also negatively impact the future prosperity of Ottawa County and West Michigan if not addressed. I have listened to the CEOs of some of West Michigan’s top businesses state that access to global talent is a major determinant of their company’s solvency. Some of these same leaders disclosed that an inability to create diverse teams in the future could lead to the relocation of corporate headquarters or company divisions to larger, more diverse areas...Talent can be homegrown in some cases, but a competition to attract global talent is currently happening and it will only intensify. The future prosperity of West Michigan hinges upon pursuing and welcoming diversity."[16] The county rebranded in 2017 as a means to establish a high quality visual identity that better matched the quality organization of Ottawa County.
The County also adopted the slogan "Where you belong." Vanderberg said the slogan is intended to let everyone, regardless of color, ethnic background, sexual identity, religion or other qualifier, know they are welcome in Ottawa County.[17]
Politics
| Year | Republican | Democratic | Third Parties |
|---|---|---|---|
| 2016 | 61.5% 88,467 | 31.3% 44,973 | 7.2% 10,408 |
| 2012 | 66.4% 88,166 | 32.2% 42,737 | 1.4% 1,854 |
| 2008 | 61.0% 83,330 | 37.2% 50,828 | 1.7% 2,381 |
| 2004 | 71.6% 92,048 | 27.6% 35,552 | 0.8% 1,043 |
| 2000 | 71.2% 78,703 | 26.8% 29,600 | 2.1% 2,296 |
| 1996 | 64.4% 61,436 | 28.3% 27,024 | 7.3% 6,956 |
| 1992 | 59.1% 56,862 | 23.1% 22,180 | 17.9% 17,169 |
| 1988 | 76.2% 61,515 | 23.3% 18,769 | 0.6% 445 |
| 1984 | 79.7% 60,142 | 19.9% 15,000 | 0.4% 326 |
| 1980 | 67.9% 51,217 | 24.4% 18,435 | 7.7% 5,832 |
| 1976 | 74.1% 49,196 | 24.7% 16,381 | 1.2% 793 |
| 1972 | 72.0% 42,169 | 25.8% 15,119 | 2.2% 1,288 |
| 1968 | 67.6% 33,356 | 25.2% 12,431 | 7.2% 3,555 |
| 1964 | 54.8% 24,512 | 45.1% 20,151 | 0.2% 72 |
| 1960 | 75.3% 32,678 | 24.5% 10,617 | 0.3% 128 |
| 1956 | 74.9% 28,611 | 24.8% 9,459 | 0.3% 130 |
| 1952 | 72.8% 22,328 | 25.6% 7,835 | 1.6% 494 |
| 1948 | 63.4% 16,028 | 34.8% 8,789 | 1.9% 471 |
| 1944 | 66.2% 17,077 | 33.0% 8,511 | 0.8% 198 |
| 1940 | 62.4% 15,462 | 36.9% 9,152 | 0.7% 170 |
| 1936 | 51.4% 11,114 | 44.3% 9,579 | 4.4% 952 |
| 1932 | 58.3% 12,076 | 38.6% 7,981 | 3.1% 643 |
| 1928 | 85.5% 15,417 | 14.0% 2,524 | 0.5% 94 |
| 1924 | 78.6% 11,688 | 12.6% 1,871 | 8.9% 1,321 |
| 1920 | 78.7% 10,528 | 17.9% 2,391 | 3.4% 451 |
| 1916 | 56.2% 5,484 | 40.4% 3,941 | 3.4% 335 |
| 1912 | 20.9% 1,825 | 23.3% 2,036 | 55.9% 4,885 |
| 1908 | 66.3% 5,642 | 28.5% 2,429 | 5.2% 445 |
| 1904 | 75.3% 5,908 | 19.8% 1,553 | 4.9% 382 |
| 1900 | 62.2% 5,324 | 35.6% 3,050 | 2.2% 184 |
| 1896 | 58.1% 5,188 | 39.7% 3,550 | 2.2% 199 |
| 1892 | 50.8% 3,643 | 41.8% 2,996 | 7.4% 530 |
| 1888 | 55.0% 4,302 | 40.8% 3,191 | 4.2% 325 |
| 1884 | 53.4% 3,758 | 43.3% 3,049 | 3.4% 236 |
Ottawa County is a stronghold of the Republican Party. The last Democratic Party candidate to carry the county was George B. McClellan in 1864.[19] In 1912, the nominal Republican Party candidate did not carry the county, due to "Bull Moose Party" candidate and former Republican President Theodore Roosevelt's unsuccessful campaign, which took the county's vote.
Communities
_-_Holland%2C_Michigan.jpg)
Cities
- Coopersville
- Ferrysburg
- Grand Haven (county seat)
- Holland
- Hudsonville
- Zeeland
Village
Other unincorporated communities
- Agnew
- Bauer
- Beaverdam
- Big Spring
- Blendon
- Borculo
- Conger
- Conklin
- Crisp
- Crockery Lake
- Dennison
- Drenthe
- Eastmanville
- Finnasey
- Forest Grove
- Gooding
- Grand Valley
- Harlem Station
- Harrisburg
- Herrington
- Jamestown
- Lamont (called Steele's Landing 1851-1856)
- Lisbon
- Macatawa
- Marne
- North Blendon
- Nunica
- Ottawa Center
- Pearline (also called East Allendale)
- Port Sheldon
- Reno
- Robinson
- Spoonville
- Tallmadge
- Vriesland
- West Olive
- Wright
Townships
- Allendale Charter Township
- Blendon Township
- Chester Township
- Crockery Township
- Georgetown Charter Township
- Grand Haven Charter Township
- Holland Charter Township
- Jamestown Charter Township
- Olive Township
- Park Township
- Polkton Charter Township
- Port Sheldon Township
- Robinson Township
- Spring Lake Township
- Tallmadge Charter Township
- Wright Township
- Zeeland Charter Township
See also
- List of Michigan State Historic Sites in Ottawa County, Michigan
- National Register of Historic Places listings in Ottawa County, Michigan
References
- Clarke (accessed January 29, 2013)
- "State & County QuickFacts". U.S. Census Bureau. Archived from the original on July 7, 2011. Retrieved August 29, 2013.
- "Find a County". National Association of Counties. Retrieved June 7, 2011.
- "2010 Census Gazetteer Files". US Census Bureau. August 22, 2012. Archived from the original on November 13, 2013. Retrieved September 27, 2014.
- "Population and Housing Unit Estimates". Retrieved March 26, 2020.
- "US Decennial Census". US Census Bureau. Retrieved September 27, 2014.
- "Historical Census Browser". University of Virginia Library. Retrieved September 27, 2014.
- "Population of Counties by Decennial Census: 1900 to 1990". US Census Bureau. Retrieved September 27, 2014.
- "Census 2000 PHC-T-4. Ranking Tables for Counties: 1990 and 2000" (PDF). US Census Bureau. Retrieved September 27, 2014.
- Data Access and Dissemination Systems (DADS). "U.S. Census website". census.gov.
- "U.S. Census website". US Census Bureau. Retrieved January 31, 2008.
- "County Health Rankings & Roadmaps".
- "The Association of Religion Data Archives - Maps & Reports". thearda.com.
- "Worship With Us", ComeUntoChrist.org, 2020. Retrieved on 26 March 2020.
- "miOttawa - Ottawa County Board of Commissioners". ottawa.mi.us.
- "Cultural Intelligence Committee - Ottawa County MI". www.miottawa.org.
- "Administrator touts Ottawa County's attributes in annual address". www.mlive.com. January 26, 2018.
- Leip, David. "Dave Leip's Atlas of U.S. Presidential Elections". uselectionatlas.org.
- "Presidential election of 1864 - Map by counties". free.fr.
External links
- County of Ottawa
- Grand Haven & Tri-Cities Alumni
- "Bibliography on Ottawa County". Clarke Historical Library, Central Michigan University.
Places adjacent to Ottawa County, Michigan | ||||||||||
|---|---|---|---|---|---|---|---|---|---|---|
| ||||||||||
Municipalities and communities of Ottawa County, Michigan, United States | ||
|---|---|---|
| Cities | Map of Michigan highlighting Ottawa County | |
| Village | ||
| Charter townships | ||
| General law townships | ||
| CDPs | ||
| Other unincorporated communities |
| |
| Footnotes | ‡This populated place also has portions in an adjacent county or counties | |
| Central cities | |||
|---|---|---|---|
| Counties |
| ||
| Geography | |||
| Transportation | |||
| Economy | |||
| |||
| Authority control |
|
|---|