Lapeer County, Michigan
Lapeer County is a county located in the U.S. state of Michigan. As of the 2010 census, the population was 88,319.[3] The county seat is Lapeer.[4] The county was created on September 18, 1822, and was fully organized on February 2, 1835. The name is a corruption of the French la pierre, which means "the flint".[5]
Lapeer County | |
|---|---|
 | |
 Location within the U.S. state of Michigan | |
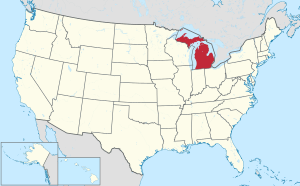 Michigan's location within the U.S. | |
| Coordinates: 43°05′N 83°13′W | |
| Country | |
| State | |
| Founded | September 18, 1822 (created) February 2, 1835 (organized)[1][2] |
| Seat | Lapeer |
| Largest city | Lapeer |
| Area | |
| • Total | 663 sq mi (1,720 km2) |
| • Land | 643 sq mi (1,670 km2) |
| • Water | 20 sq mi (50 km2) 3.0%% |
| Population | |
| • Estimate (2018) | 88,028 |
| • Density | 137/sq mi (53/km2) |
| Time zone | UTC−5 (Eastern) |
| • Summer (DST) | UTC−4 (EDT) |
| Congressional district | 10th |
| Website | lapeercountyweb |
Lapeer County is included in the Detroit-Warren-Dearborn, MI Metropolitan Statistical Area.
History
Lapeer County was part of New France from 1534. As New France gained in population, this area was considered part of the Pays d'en Haut (upper countries) dependency of the Colony of Canada, from its formation as a department of New France in 1712. In 1763 England took possession of all French territory in North America east of the Mississippi River after winning the Seven Years' War. It renamed the colony and its dependencies as the Province of Quebec. France and England had controlled trading with First Nations in this area by establishing forts as a place for gathering and trading, and to settle disputes and enforce laws. They used the ancient overland and waterborne trade routes of the First Nations, while providing superior tools and weapons in exchange for valuable furs.
Following the American Revolution, Great Britain ceded portions of the Province of Quebec to the newly independent United States of America. By an ordinance of the Congress of the United States passed in July 13, 1787, under the Articles of Confederation, the whole of the territory of the United States lying northwest of the Ohio River and east of the Mississippi River, though still occupied by the British, was organized as the Northwest Territory.[6] The area that is now Lapeer County used to be a part of the County of Wayne, named in the honor of General Anthony Wayne. This original Wayne County was created on August 11, 1796; very large, it included all of the lower peninsula of Michigan, parts of Northern Ohio and Indiana, and also portions of Wisconsin and Illinois. As population increased in the area, new counties were organized in this territory.
What is now Lapeer County, on May 7, 1800, was considered part of the Territory of Indiana, which included all of the lower peninsula of Michigan. After Ohio and Indiana became states, the Territory of Michigan was formed. In 1807 local Indian tribes: the Ottawa, Ojibwa (Chippewa), Wyandot and Potawatomi, ceded the land of Southeast Michigan to the United States in the Treaty of Detroit. They had been under pressure for some time, especially as they had been allied with the British in the Revolutionary War. They were encouraged to move west out of the area, but some remained in Michigan.
In January 1820, the County of Oakland was formed. On September 18, 1822, Governor Lewis Cass set Lapeer County's boundaries, although it remained a part of Oakland County until it was organized. Lapeer County officially became a county on February 2, 1835. The first recorded elections for county officers, with 520 people voting, occurred in 1837.
The first European-American settler in Lapeer was Alvin N. Hart, who was born in Cornwall, Connecticut on February 11, 1804. He came to Lapeer in 1831 and platted the Village of Lapeer on November 8, 1833.[6] The plat was registered in Pontiac, December 14, 1833, in Oakland County's Associate Judge Bagley's court. Alvin Hart became a state senator in 1843, representing Lapeer, Oakland, Genesee, Shiawassee, Tuscola, Saginaw counties and the entire Upper Peninsula. He was instrumental in having the state capital moved from Detroit to Lansing.
Lumber was the principal industry of the Lapeer County area from the 1830s until 1870. Lumber was in demand with development throughout the Midwest. In addition there was the expectation that clearing much of the county's forests would attract farmers as settlers. Lapeer's economy shifted to become primarily agriculturally based.
On October 26, 2010, Lapeer became a founding member of the Karegnondi Water Authority.[7]
Historical markers
Fifteen historical markers have been installed throughout Lapeer County commemorating sites and structures of interest:[8]
- Columbiaville Depot
- Currier House (Almont)
- Dryden Depot
- General Squier Memorial Park (Dryden Township)
- Grand Trunk Western Railroad Depot / Imlay City
- Grettenberger Field (Imlay City)
- Henry Stephens Memorial Library (Almont)
- Ladies Library Hall (Dryden)
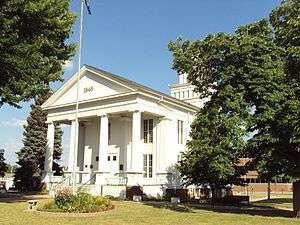
- Lapeer County (at Lapeer County Courthouse)
- Lapeer Public Library
- Pioneer Bank (North Branch)
- St. Patrick's Church (Clifford)
- Tuttle House (Lapeer)
- United Methodist Church (Columbiaville)
- William Peter Mansion (Columbiaville)
Geography
According to the U.S. Census Bureau, the county has a total area of 663 square miles (1,720 km2), of which 643 square miles (1,670 km2) is land and 20 square miles (52 km2) (3.0%) is water.[9] Lapeer County's geography is very similar to Oakland County, except Lapeer County is more rural. Lapeer is one of the five counties that form the peninsula projecting into Lake Huron known as The Thumb, which in turn is a sub-region of Mid Michigan.
The headwaters of the Flint River are in Columbiaville. It flows through the county toward Genesee. The City of Lapeer straddles it course.
Major highways


Adjacent counties
- Sanilac County (northeast)
- Tuscola County (northwest)
- St. Clair County (east)
- Genesee County (west)
- Macomb County (southeast)
- Oakland County (southwest)
Demographics
| Historical population | |||
|---|---|---|---|
| Census | Pop. | %± | |
| 1840 | 4,265 | — | |
| 1850 | 7,029 | 64.8% | |
| 1860 | 14,754 | 109.9% | |
| 1870 | 21,345 | 44.7% | |
| 1880 | 30,138 | 41.2% | |
| 1890 | 29,213 | −3.1% | |
| 1900 | 27,641 | −5.4% | |
| 1910 | 26,033 | −5.8% | |
| 1920 | 25,782 | −1.0% | |
| 1930 | 28,348 | 10.0% | |
| 1940 | 32,116 | 13.3% | |
| 1950 | 35,794 | 11.5% | |
| 1960 | 41,926 | 17.1% | |
| 1970 | 52,317 | 24.8% | |
| 1980 | 70,038 | 33.9% | |
| 1990 | 74,768 | 6.8% | |
| 2000 | 87,904 | 17.6% | |
| 2010 | 88,319 | 0.5% | |
| Est. 2018 | 88,028 | [10] | −0.3% |
| U.S. Decennial Census[11] 1790-1960[12] 1900-1990[13] 1990-2000[14] 2010-2018[3] | |||
As of the 2010 United States Census, there were 88,319 people living in the county. 95.5% were White, 1.0% Black or African American, 0.5% Native American, 0.3% Asian, 1.2% of some other race and 1.4% of two or more races. 4.1% were Hispanic or Latino (of any race). 23.9% were of German, 10.9% English, 10.4% Irish, 8.6% Polish, 7.3% American and 5.2% French, French Canadian or Cajun ancestry.[15]
As of the census[16] of 2000, there were 87,904 people, 30,729 households, and 23,876 families living in the county. The population density was 134 people per square mile (52/km²). There were 32,732 housing units at an average density of 50 per square mile (19/km²). The racial makeup of the county was 96.17% White, 0.82% Black or African American, 0.38% Native American, 0.39% Asian, 0.01% Pacific Islander, 1.07% from other races, and 1.16% from two or more races. 3.11% of the population were Hispanic or Latino of any race. 24.2% were of German, 11.8% English, 9.7% American, 9.6% Irish and 9.4% Polish ancestry, 95.9% spoke English and 2.6% Spanish as their first language.
In 2000, there were 30,729 households, of which 38.30% had children under the age of 18 living with them, 65.70% were married couples living together, 8.10% had a female householder with no husband present, and 22.30% were non-families. 18.50% of all households were made up of individuals and 6.90% had someone living alone who was 65 years of age or older. The average household size was 2.80 and the average family size was 3.19.
The county's population was spread out in terms of age, with 28.00% under the age of 18, 7.70% from 18 to 24, 31.00% from 25 to 44, 23.80% from 45 to 64, and 9.60% who were 65 years of age or older. The median age was 36 years. For every 100 females, there were 102.40 males. For every 100 females age 18 and over, there were 101.10 males.
The median income for a household in the county was $51,717, and the median income for a family was $57,817. Males had a median income of $47,506 versus $26,385 for females. The per capita income for the county was $21,462. About 3.80% of families and 5.40% of the population lived below the poverty line, including 5.70% of those under age 18 and 7.50% of those age 65 or over.
Government
| Year | Republican | Democratic | Third Parties |
|---|---|---|---|
| 2016 | 66.5% 30,037 | 28.2% 12,734 | 5.3% 2,412 |
| 2012 | 55.1% 23,734 | 43.6% 18,796 | 1.4% 585 |
| 2008 | 50.3% 22,831 | 47.3% 21,457 | 2.4% 1,074 |
| 2004 | 57.9% 25,556 | 41.0% 18,086 | 1.1% 505 |
| 2000 | 54.7% 20,351 | 42.3% 15,749 | 3.0% 1,134 |
| 1996 | 40.7% 13,369 | 43.6% 14,308 | 15.7% 5,164 |
| 1992 | 35.1% 12,326 | 34.2% 11,982 | 30.7% 10,776 |
| 1988 | 60.2% 16,670 | 38.8% 10,736 | 1.1% 291 |
| 1984 | 70.7% 19,222 | 28.7% 7,800 | 0.7% 178 |
| 1980 | 57.0% 15,996 | 34.5% 9,671 | 8.6% 2,402 |
| 1976 | 55.6% 12,349 | 42.8% 9,503 | 1.6% 363 |
| 1972 | 66.0% 11,615 | 31.4% 5,531 | 2.5% 446 |
| 1968 | 54.9% 8,866 | 32.2% 5,199 | 13.0% 2,098 |
| 1964 | 41.1% 6,012 | 58.8% 8,595 | 0.1% 17 |
| 1960 | 67.1% 10,450 | 32.8% 5,099 | 0.1% 18 |
| 1956 | 72.8% 10,527 | 27.1% 3,913 | 0.1% 19 |
| 1952 | 72.8% 9,940 | 26.7% 3,644 | 0.5% 72 |
| 1948 | 62.9% 8,358 | 35.1% 4,668 | 2.1% 272 |
| 1944 | 71.8% 7,769 | 27.7% 3,002 | 0.5% 50 |
| 1940 | 69.9% 7,714 | 29.9% 3,299 | 0.3% 31 |
| 1936 | 54.3% 5,081 | 41.3% 3,868 | 4.4% 415 |
| 1932 | 51.9% 4,882 | 45.9% 4,315 | 2.3% 215 |
| 1928 | 82.8% 6,514 | 16.7% 1,312 | 0.5% 41 |
| 1924 | 83.7% 6,297 | 12.3% 929 | 4.0% 302 |
| 1920 | 78.6% 5,523 | 18.5% 1,298 | 2.9% 205 |
| 1916 | 61.8% 3,345 | 35.8% 1,937 | 2.5% 133 |
| 1912 | 32.1% 1,728 | 22.3% 1,200 | 45.6% 2,457 |
| 1908 | 63.5% 3,426 | 30.5% 1,644 | 6.0% 326 |
| 1904 | 69.0% 3,917 | 26.7% 1,519 | 4.3% 244 |
| 1900 | 59.7% 3,706 | 35.6% 2,208 | 4.7% 293 |
| 1896 | 53.6% 3,809 | 43.2% 3,065 | 3.2% 229 |
| 1892 | 49.1% 3,126 | 42.4% 2,698 | 8.5% 541 |
| 1888 | 53.4% 3,662 | 42.5% 2,914 | 4.2% 287 |
| 1884 | 50.2% 3,062 | 44.9% 2,741 | 5.0% 303 |
The county government operates the jail, maintains rural roads, operates the major local courts, keeps files of deeds and mortgages, maintains vital records, administers public health regulations, runs county parks, and participates with the state in the provision of welfare and other social services. The county board of commissioners controls the budget but has only limited authority to make laws or ordinances. In Michigan, most local government functions — police and fire, building and zoning, tax assessment, street maintenance, etc. — are the responsibility of individual cities, villages, and townships.
Elected officials
- Prosecuting Attorney: Mike Sharkey [18]
- Sheriff: Scott McKenna
- County Clerk: Theresa M. Spencer
- County Treasurer: Dana M. Miller
- Register of Deeds: Melissa DeVaugh
- Drain Commissioner: John D. Freeman
- County Surveyor: Ray Davis
- Road Commissioners: Douglas Hodge; Dale Duckert; Joe Suma
(information as of August, 2012)
Judiciary
- 40th Circuit Court: Nick O. Holowka; Byron Konchuch
- 71A District Court: Laura Cheger Barnard
- Probate Court: Justus C. Scott
(information as of August, 2012)
Board of Commissioners
7 members, elected from districts (1 Democrat, 6 Republicans)
| District | Commissioner | Party | District's Area |
|---|---|---|---|
| 1 | Cheryl Clark (Vice-Chairman) | Democratic | Townships of Marathon, Oregon and portion of Elba |
| 2 | Dyle Henning | Republican | Townships of Rich, Deerfield and portion of Mayfield |
| 3 | Gary Roy (Chairman) | Republican | Townships of Arcadia, Burlington, Burnside, Goodland and North Branch |
| 4 | Lenny Schneider | Republican | City of Lapeer and portions of Lapeer and Mayfield Townships |
| 5 | Dave Eady | Republican | Townships of Hadley, Metamora and portion of Elba |
| 6 | Linda Jarvis | Republican | Townships of Attica, Dryden and portion of Lapeer |
| 7 | Ian Kempf | Republican | Imlay City and Townships Almont and Imlay |
Communities
Cities
- Brown City (partly in Sanilac County)
- Imlay City
- Lapeer (county seat)
Census-designated places
Other unincorporated communities
- Burnside
- Elba
- Farmers Creek
- Five Lakes
- Goodland
- Hadley
- Hunters Creek
- Kerr Hill
- Kings Mill
- Lum
- Silverwood
- Thornville
Townships
- Almont Township
- Arcadia Township
- Attica Township
- Burlington Township
- Burnside Township
- Deerfield Township
- Dryden Township
- Elba Township
- Goodland Township
- Hadley Township
- Imlay Township
- Lapeer Township
- Marathon Township
- Mayfield Township
- Metamora Township
- North Branch Township
- Oregon Township
- Rich Township
See also
- List of Michigan State Historic Sites in Lapeer County, Michigan
- National Register of Historic Places listings in Lapeer County, Michigan
References
- "A Condensed History of Lapeer County". Lapeer County Government. Archived from the original on August 2, 2015. Retrieved October 4, 2014.
- History of Lapeer County, Michigan : with illustrations and biographical sketches of some of its prominent men and pioneers. Chicago: H. R. Page. 1884. Retrieved October 4, 2014.
- "State & County QuickFacts". United States Census Bureau. Archived from the original on June 6, 2011. Retrieved August 28, 2013.
- "Find a County". National Association of Counties. Retrieved June 7, 2011.
- Gannett, Henry (1905). The Origin of Certain Place Names in the United States. U.S. Government Printing Office. p. 181.
- Stewart, Lyle. "A Condensed History of Lapeer County". Archived from the original on 2 February 2014. Retrieved 14 August 2012.
- Fonger, Ron (October 23, 2010). "Years in the making, Karegnondi Water Authority is ready to set new course for water". Flint Journal. Retrieved 6 December 2011.
- "Michigan Historical Markers". michmarkers.com. Archived from the original on 2014-07-17. Retrieved 2008-02-02.
- "2010 Census Gazetteer Files". United States Census Bureau. August 22, 2012. Archived from the original on November 13, 2013. Retrieved September 26, 2014.
- "American FactFinder". Archived from the original on February 14, 2020. Retrieved April 19, 2019.
- "U.S. Decennial Census". United States Census Bureau. Retrieved September 26, 2014.
- "Historical Census Browser". University of Virginia Library. Retrieved September 26, 2014.
- "Population of Counties by Decennial Census: 1900 to 1990". United States Census Bureau. Retrieved September 26, 2014.
- "Census 2000 PHC-T-4. Ranking Tables for Counties: 1990 and 2000" (PDF). United States Census Bureau. Retrieved September 26, 2014.
- Data Access and Dissemination Systems (DADS). "U.S. Census website". census.gov.
- "U.S. Census website". United States Census Bureau. Retrieved January 31, 2008.
- http://uselectionatlas.org/RESULTS
- "COUNTY ELECTED OFFICIALS". Archived from the original on 15 February 2013. Retrieved 14 August 2012.
- "Who is my Commissioner?". lapeercountyweb.org.
External links
- Official Lapeer County Website
- "Bibliography on Lapeer County". Clarke Historical Library, Central Michigan University. Retrieved January 19, 2013.
Places adjacent to Lapeer County, Michigan | ||||||||||
|---|---|---|---|---|---|---|---|---|---|---|
| ||||||||||
Municipalities and communities of Lapeer County, Michigan, United States | ||
|---|---|---|
| Cities | Map of Michigan highlighting Lapeer County.svg | |
| Villages | ||
| Townships | ||
| CDPs | ||
| Other unincorporated communities |
| |
| Footnotes | ‡This populated place also has portions in an adjacent county or counties | |
Central/Mid-Michigan including the Tri-Cities and Thumb | |||||||
|---|---|---|---|---|---|---|---|
| Central cities | |||||||
| Counties |
| ||||||
| Geography | |||||||
| Transportation | |||||||
| Economy |
| ||||||
| |||||||
| Topics | 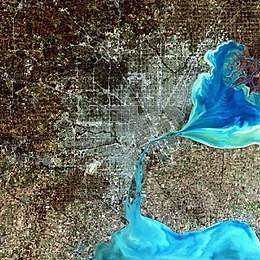 | |
|---|---|---|
| Detroit | ||
| Municipalities over 80,000 | ||
| Municipalities 40,000 to 80,000 | ||
| Cultural enclaves | ||
| Satellite cities | ||
| Counties in MSA | ||
| Counties in CSA | ||
| Authority control |
|
|---|