Menominee County, Michigan
Menominee County is a county located in the Upper Peninsula in the U.S. state of Michigan. As of the 2010 census, the population was 24,029.[2] The county seat is Menominee.[3] The county's name comes from an American Indian word meaning "wild rice eater" used to describe a tribe. The county was created in 1861 from area partitioned out of Delta County, under the name of Bleeker. When county government was organized in 1863, the name was changed to Menominee.[1]
Menominee County | |
|---|---|
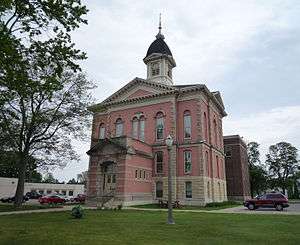 Menominee County Courthouse, Menominee | |
 Location within the U.S. state of Michigan | |
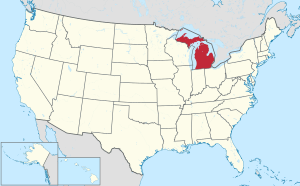 Michigan's location within the U.S. | |
| Coordinates: 45°31′N 87°32′W | |
| Country | |
| State | |
| Founded | 1861 (established) 1863 (organized)[1] |
| Named for | Menominee tribe |
| Seat | Menominee |
| Largest city | Menominee |
| Area | |
| • Total | 1,338 sq mi (3,470 km2) |
| • Land | 1,044 sq mi (2,700 km2) |
| • Water | 294 sq mi (760 km2) 22%% |
| Population | |
| • Estimate (2018) | 22,983 |
| • Density | 23/sq mi (9/km2) |
| Time zone | UTC−6 (Central) |
| • Summer (DST) | UTC−5 (CDT) |
| Congressional district | 1st |
Menominee County is part of the Marinette, WI–MI Micropolitan Statistical Area.
Geography
According to the U.S. Census Bureau, the county has a total area of 1,338 square miles (3,470 km2), of which 1,044 square miles (2,700 km2) is land and 294 square miles (760 km2) (22%) is water.[4]
Major highways


Airport
- Menominee–Marinette Twin County Airport (ICAO: KMNM) - in NW Menominee, is a public-owned public-use general-aviation airport.
Adjacent counties
- Marquette County – north (EST Border)
- Delta County – northeast (EST Border)
- Door County, Wisconsin – southeast
- Marinette County, Wisconsin – southwest
- Dickinson County – northwest
Demographics
| Historical population | |||
|---|---|---|---|
| Census | Pop. | %± | |
| 1870 | 1,791 | — | |
| 1880 | 11,987 | 569.3% | |
| 1890 | 33,639 | 180.6% | |
| 1900 | 27,046 | −19.6% | |
| 1910 | 25,648 | −5.2% | |
| 1920 | 23,778 | −7.3% | |
| 1930 | 23,652 | −0.5% | |
| 1940 | 24,883 | 5.2% | |
| 1950 | 25,299 | 1.7% | |
| 1960 | 24,685 | −2.4% | |
| 1970 | 24,587 | −0.4% | |
| 1980 | 26,201 | 6.6% | |
| 1990 | 24,920 | −4.9% | |
| 2000 | 25,326 | 1.6% | |
| 2010 | 24,029 | −5.1% | |
| Est. 2018 | 22,983 | [6] | −4.4% |
| US Decennial Census[7] 1790-1960[8] 1900-1990[9] 1990-2000[10] 2010-2018[2] | |||
The 2010 United States Census[11] indicates Menominee County had a population of 24,029. This decrease of 1,297 people from the 2000 United States Census represents a 5.1% population decrease. In 2010 there were 10,474 households and 6,819 families residing in the county. The population density was 23 people per square mile (9/km²). There were 14,227 housing units at an average density of 14 per square mile (5/km²). 95.3% of the population were White, 2.7% Native American, 0.3% Black or African American, 0.3% Asian, 0.2% of some other race and 1.2% of two or more races. 1.2% were Hispanic or Latino (of any race). 28.2% were of German, 13.1% French, French Canadian or Cajun, 8.4% Polish, 6.5% Swedish, 5.2% Irish and 5.2% American ancestry.[11]
There were 10,474 households out of which 24.0% had children under the age of 18 living with them, 51.1% were married couples living together, 9.1% had a female householder with no husband present, and 34.9% were non-families. 30.4% of all households were made up of individuals and 12.6% had someone living alone who was 65 years of age or older. The average household size was 2.26 and the average family size was 2.77.
The county population contained 21.0% under the age of 18, 6.5% from 18 to 24, 20.8% from 25 to 44, 32.7% from 45 to 64, and 19.1% who were 65 years of age or older. The median age was 46.2 years. The population was 50.3% male and 49.7% female.
The median income for a household in the county was $42,014 and the median income for a family was $50,007. The per capita income for the county was $21,886. About 11.1% of people in families and 14.2% of the population were below the poverty line, including 22.6% of those under age 18 and 10.9% of those age 65 or over.
Government
Menominee County was strongly Republican-leaning at its start, but has been more middle-leaning during the 20th century. Since 1876, the Republican Party nominee has carried the county vote in 69% of the elections (25 of 36 elections).
| Year | Republican | Democratic | Third Parties |
|---|---|---|---|
| 2016 | 61.9% 6,702 | 32.7% 3,539 | 5.4% 583 |
| 2012 | 50.7% 5,564 | 47.8% 5,242 | 1.5% 161 |
| 2008 | 43.9% 4,855 | 54.0% 5,981 | 2.1% 236 |
| 2004 | 52.0% 5,942 | 46.6% 5,326 | 1.3% 151 |
| 2000 | 53.0% 5,529 | 44.1% 4,597 | 3.0% 308 |
| 1996 | 39.7% 4,038 | 47.9% 4,880 | 12.4% 1,266 |
| 1992 | 36.1% 3,995 | 41.1% 4,559 | 22.8% 2,528 |
| 1988 | 52.3% 5,440 | 47.3% 4,918 | 0.5% 48 |
| 1984 | 59.7% 6,618 | 39.9% 4,425 | 0.4% 46 |
| 1980 | 52.5% 6,170 | 42.2% 4,962 | 5.3% 617 |
| 1976 | 49.6% 5,633 | 49.3% 5,596 | 1.1% 128 |
| 1972 | 55.2% 6,060 | 42.4% 4,657 | 2.4% 264 |
| 1968 | 45.5% 4,599 | 48.3% 4,877 | 6.3% 632 |
| 1964 | 33.2% 3,545 | 66.6% 7,119 | 0.2% 18 |
| 1960 | 46.3% 5,064 | 53.6% 5,857 | 0.2% 17 |
| 1956 | 57.1% 6,137 | 42.9% 4,610 | 0.1% 10 |
| 1952 | 55.5% 6,147 | 44.1% 4,884 | 0.3% 37 |
| 1948 | 45.7% 4,420 | 52.7% 5,094 | 1.6% 153 |
| 1944 | 50.9% 4,869 | 48.4% 4,632 | 0.8% 72 |
| 1940 | 48.3% 5,409 | 51.1% 5,727 | 0.6% 72 |
| 1936 | 33.7% 3,556 | 61.1% 6,447 | 5.2% 543 |
| 1932 | 35.6% 3,374 | 61.0% 5,782 | 3.4% 317 |
| 1928 | 50.0% 4,255 | 49.4% 4,198 | 0.6% 54 |
| 1924 | 53.4% 4,142 | 13.6% 1,055 | 33.1% 2,567 |
| 1920 | 72.4% 5,045 | 22.4% 1,560 | 5.2% 362 |
| 1916 | 56.9% 2,671 | 39.5% 1,854 | 3.6% 167 |
| 1912 | 26.9% 1,191 | 27.0% 1,195 | 46.0% 2,035 |
| 1908 | 65.0% 2,843 | 29.7% 1,299 | 5.3% 232 |
| 1904 | 73.0% 3,246 | 22.2% 989 | 4.8% 213 |
| 1900 | 66.0% 3,121 | 32.6% 1,543 | 1.4% 67 |
| 1896 | 66.4% 3,105 | 32.1% 1,499 | 1.6% 73 |
| 1892 | 48.4% 1,853 | 47.1% 1,801 | 4.5% 172 |
| 1888 | 57.1% 3,156 | 40.3% 2,228 | 2.6% 144 |
| 1884 | 73.1% 2,614 | 26.2% 936 | 0.7% 25 |
| 1880 | 60.9% 1,380 | 38.8% 880 | 0.3% 6 |
| 1876 | 52.8% 393 | 47.2% 351 | 0.0% 0 |
Menominee County operates the County jail, maintains rural roads, operates the major local courts, records deeds, mortgages, and vital records, administers public health regulations, and participates with the state in the provision of social services. The county board of commissioners controls the budget and has limited authority to make laws or ordinances. In Michigan, most local government functions – police and fire, building and zoning, tax assessment, street maintenance etc. – are the responsibility of individual cities and townships.
Elected officials
- Prosecuting Attorney: Jeffrey Rogg
- Sheriff: Kenny Marks
- County Clerk/Register of Deeds: Marc Kleiman
- County Treasurer: Diane Lesperance
- Drain Commissioner: Caleb Kleiman
- Road Commissioners: William Anderson, Anthony Kakuk, Ken Kline
(information as of September 2018)[13]
Communities

Cities
- Menominee (county seat)
- Stephenson
Civil townships
Unincorporated communities
- Birch Creek
- Cedar River
- Eagles Nest
- Faithorn
- Harris
- Hannahville
- Hermansville
- Indiantown
- Ingalls
- Labranche
- Leapers
- Nadeau
- Perronville
- Wallace
- Whitney
- Wilson[5]
Indian reservations
- The Hannahville Indian Community occupies several scattered territories within Menominee County, mostly within Harris Township and a small piece extending into Gourley Township. Another smaller piece extends east into neighboring Bark River Township in Delta County.
See also
- List of Michigan State Historic Sites in Menominee County, Michigan
- National Register of Historic Places listings in Menominee County, Michigan
References
- "Bibliography on Menominee County". Clarke Historical Library, Central Michigan University. Retrieved June 25, 2013.
- "State & County QuickFacts". US Census Bureau. Retrieved August 28, 2013.
- "Find a County". National Association of Counties. Retrieved June 7, 2011.
- "2010 Census Gazetteer Files". US Census Bureau. August 22, 2012. Retrieved September 27, 2014.
- Menominee County Google Maps (accessed 13 September 2018)
- "Population and Housing Unit Estimates". Retrieved May 17, 2019.
- "US Decennial Census". US Census Bureau. Retrieved September 27, 2014.
- "Historical Census Browser". University of Virginia Library. Retrieved September 27, 2014.
- "Population of Counties by Decennial Census: 1900 to 1990". US Census Bureau. Retrieved September 27, 2014.
- "Census 2000 PHC-T-4. Ranking Tables for Counties: 1990 and 2000" (PDF). US Census Bureau. Retrieved September 27, 2014.
- "U.S. Census website". Retrieved July 6, 2013.
- US Election Atlas
- Menominee County Departments
External links
Places adjacent to Menominee County, Michigan | ||||||||||
|---|---|---|---|---|---|---|---|---|---|---|
| ||||||||||
Municipalities and communities of Menominee County, Michigan, United States | ||
|---|---|---|
| Cities | Map of Michigan highlighting Menominee County.svg | |
| Villages | ||
| Civil townships | ||
| Unincorporated communities | ||
| Indian reservation | ||
| Footnotes | ‡This populated place also has portions in an adjacent county or counties | |
| Surrounding communities |
|   |
|---|---|---|
| Counties | ||
*town/township °city | ||
| Central cities | |
|---|---|
| Counties | |
| Geography | |
| Transportation | |
| Economy | |
| Authority control |
|
|---|