Van Buren County, Michigan
Van Buren County is a county located in the U.S. state of Michigan. As of the 2010 census, the population was 76,258.[2] The county seat is Paw Paw.[3] The county was founded in 1829 and organized in 1837.[1]
Van Buren County | |
|---|---|
 Van Buren County Courthouse | |
.png) Seal | |
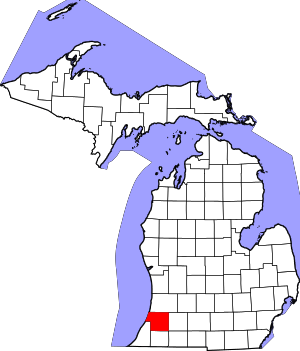 Location within the U.S. state of Michigan | |
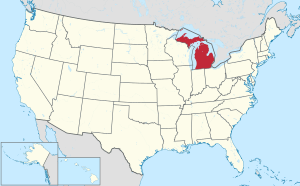 Michigan's location within the U.S. | |
| Coordinates: 42°16′N 86°19′W | |
| Country | |
| State | |
| Founded | 1829 (created) 1837 (organized)[1] |
| Named for | Martin Van Buren |
| Seat | Paw Paw |
| Largest city | South Haven |
| Area | |
| • Total | 1,090 sq mi (2,800 km2) |
| • Land | 607 sq mi (1,570 km2) |
| • Water | 482 sq mi (1,250 km2) 44%% |
| Population | |
| • Estimate (2018) | 75,448 |
| • Density | 124/sq mi (48/km2) |
| Time zone | UTC−5 (Eastern) |
| • Summer (DST) | UTC−4 (EDT) |
| Congressional district | 6th |
| Website | www |
Van Buren County is included in the Kalamazoo-Portage, MI Metropolitan Statistical Area.
History
The county was named for Martin Van Buren before he became president. He was US Secretary of State and later Vice President under President Andrew Jackson, and thus Van Buren is one of Michigan's "Cabinet counties".[1]
The Van Buren County Courthouse was built by Claire Allen, a prominent southern Michigan architect; its cornerstone was laid on September 2, 1901, after a July vote to issue $35,000 in county bonds.[4]
Government
Van Buren County has usually voted Republican in national elections. Since 1884, the county's voters have selected the Republican Party nominee in 79% (27 of 34) of the national elections through 2016. However, the county has become a swing county as well as a bellwether in recent years, voting for the overall winner in every presidential election from 1980 to the present day.
| Year | Republican | Democratic | Third Parties |
|---|---|---|---|
| 2016 | 53.8% 17,890 | 39.8% 13,258 | 6.4% 2,126 |
| 2012 | 49.2% 16,141 | 49.6% 16,290 | 1.2% 406 |
| 2008 | 44.7% 15,534 | 53.5% 18,588 | 1.9% 644 |
| 2004 | 51.6% 17,634 | 47.3% 16,151 | 1.1% 389 |
| 2000 | 50.2% 14,792 | 46.8% 13,796 | 3.0% 894 |
| 1996 | 40.6% 11,347 | 47.7% 13,355 | 11.7% 3,273 |
| 1992 | 34.3% 10,357 | 41.2% 12,466 | 24.5% 7,414 |
| 1988 | 57.2% 14,522 | 42.0% 10,668 | 0.8% 210 |
| 1984 | 64.6% 16,426 | 34.8% 8,853 | 0.7% 166 |
| 1980 | 56.0% 14,451 | 35.8% 9,248 | 8.2% 2,125 |
| 1976 | 56.0% 13,615 | 42.7% 10,366 | 1.3% 321 |
| 1972 | 64.6% 13,903 | 33.3% 7,159 | 2.2% 469 |
| 1968 | 51.8% 10,676 | 35.4% 7,304 | 12.8% 2,627 |
| 1964 | 41.6% 8,120 | 58.1% 11,336 | 0.3% 48 |
| 1960 | 64.2% 12,903 | 35.2% 7,082 | 0.6% 111 |
| 1956 | 69.7% 13,291 | 29.8% 5,678 | 0.5% 94 |
| 1952 | 70.9% 13,231 | 28.5% 5,309 | 0.6% 119 |
| 1948 | 67.9% 9,511 | 29.2% 4,082 | 2.9% 411 |
| 1944 | 68.3% 10,951 | 31.2% 5,002 | 0.5% 84 |
| 1940 | 66.9% 11,571 | 32.5% 5,625 | 0.6% 101 |
| 1936 | 54.7% 9,110 | 40.4% 6,720 | 5.0% 825 |
| 1932 | 47.5% 6,954 | 49.3% 7,223 | 3.2% 464 |
| 1928 | 77.4% 9,325 | 21.9% 2,643 | 0.7% 82 |
| 1924 | 71.6% 7,384 | 16.0% 1,646 | 12.5% 1,290 |
| 1920 | 75.1% 6,904 | 21.6% 1,988 | 3.3% 300 |
| 1916 | 55.3% 4,302 | 41.5% 3,225 | 3.2% 249 |
| 1912 | 29.0% 2,101 | 27.5% 1,994 | 43.5% 3,147 |
| 1908 | 62.8% 4,531 | 32.1% 2,313 | 5.1% 371 |
| 1904 | 72.7% 5,254 | 22.6% 1,634 | 4.7% 342 |
| 1900 | 58.7% 4,892 | 38.8% 3,235 | 2.5% 204 |
| 1896 | 52.0% 4,510 | 45.9% 3,982 | 2.2% 190 |
| 1892 | 54.1% 3,788 | 31.1% 2,182 | 14.8% 1,038 |
| 1888 | 58.1% 4,783 | 36.2% 2,986 | 5.7% 471 |
| 1884 | 56.1% 4,219 | 39.0% 2,933 | 4.9% 367 |
Van Buren County operates the County jail, maintains rural roads, operates the major local courts, records deeds, mortgages, and vital records, administers public health regulations, and participates with the state in the provision of social services. The county board of commissioners controls the budget and has limited authority to make laws or ordinances. In Michigan, most local government functions – police and fire, building and zoning, tax assessment, street maintenance etc. – are the responsibility of individual cities and townships.
Elected officials
- Prosecuting Attorney: Michael Bedford (R)
- Sheriff: Dan Abbott (R)
- County Clerk: Suzie Roehm (R)
- County Treasurer: Trisha Nesbitt (R)
- Register of Deeds: Paul W. DeYoung (R)
- Drain Commissioner: Joe Parman (R)
- County Surveyor: Donald Gilchrist (R)
Board of Commissioners
7 members, elected from districts (1 Democrat, 6 Republicans)
| District | Commissioner | Party | District's Area |
|---|---|---|---|
| 1 | Gail Patterson-Gladney | Democrat | City of South Haven and Townships of Covert and South Haven |
| 2 | Kurt Doroh (Vice-Chairman) | Republican | City of Bangor and Townships of Arlington, Columbia, and Geneva |
| 3 | Dick Godfrey (Chairman) | Republican | City of Gobles and Townships of Almena, Bloomingdale, and Pine Grove |
| 4 | Mike Chappell | Republican | City of Hartford and Townships of Bangor, Hartford, and Keeler |
| 5 | Randall Peat | Republican | Townships of Antwerp (part), Paw Paw, and Waverly |
| 6 | Donald Hanson | Republican | Townships of Decatur, Hamilton, Lawrence, and Porter |
| 7 | Paul Schincariol | Republican | Township of Antwerp (part) |
(information correct in December 2019)
Geography
According to the U.S. Census Bureau, the county has a total area of 1,090 square miles (2,800 km2), of which 607 square miles (1,570 km2) is land and 482 square miles (1,250 km2) (44%) is water.[7]
Much of the county is farmland dotted with small towns. Areas near Kalamazoo County, specifically Antwerp Township and Almena Township, are becoming suburbanized. Many of the inland lakes are ringed with homes, either by people living year-round or cottagers, generally people who live the rest of the time in Chicago. Tourism is a major industry in the areas near Lake Michigan.
Rivers
Adjacent counties
- Allegan County - north
- Kalamazoo County - east
- St. Joseph County - southeast
- Cass County - south
- Berrien County - southwest
- Lake County, Illinois - west
Parks, preserves, natural areas

- Dunes Parkway, an 84-acre (340,000 m²) preserve of dunes in Covert Township
- Hamilton Township Coastal Plain Marsh Nature Sanctuary, a 79-acre (320,000 m²) preserve of coastal plain marsh in Hamilton Township owned by the Michigan Nature Association
- Jeptha Lake Fen Preserve, a 49-acre (200,000 m²) preserve in Columbia Township
- Kal-Haven Trail, a multi-use trail converted from old rail line that runs from Kalamazoo to South Haven
- Keeler State Game Area, 400 acres (162 ha) (1.6 km²) in Keeler Township
- North Point Park - high dunes on 17 acres (69,000 m2) on Lake Michigan, north of Van Buren State Park
- Ross Preserve, a 1,449 acre (5.9 km²) preserve of coastal plain marsh in Covert Township owned by The Nature Conservancy
- Van Buren State Park
- Van Buren Trail State Park is adjacent to Kal-Haven Trail
Transportation
Public transportation
- Pere Marquette (Amtrak train)
- Van Buren Public Transit[8]
Railroads
- Amtrak
- CSX Transportation
- Norfolk Southern, through Amtrak owned Michigan Line
- West Michigan Railroad
Demographics
| Historical population | |||
|---|---|---|---|
| Census | Pop. | %± | |
| 1830 | 5 | — | |
| 1840 | 1,910 | 38,100.0% | |
| 1850 | 5,800 | 203.7% | |
| 1860 | 15,224 | 162.5% | |
| 1870 | 28,829 | 89.4% | |
| 1880 | 30,807 | 6.9% | |
| 1890 | 30,541 | −0.9% | |
| 1900 | 33,274 | 8.9% | |
| 1910 | 33,185 | −0.3% | |
| 1920 | 30,715 | −7.4% | |
| 1930 | 32,637 | 6.3% | |
| 1940 | 35,111 | 7.6% | |
| 1950 | 39,184 | 11.6% | |
| 1960 | 48,395 | 23.5% | |
| 1970 | 56,173 | 16.1% | |
| 1980 | 66,814 | 18.9% | |
| 1990 | 70,060 | 4.9% | |
| 2000 | 76,263 | 8.9% | |
| 2010 | 76,258 | 0.0% | |
| Est. 2018 | 75,448 | [9] | −1.1% |
| US Decennial Census[10] 1790-1960[11] 1900-1990[12] 1990-2000[13] 2010-2018[2] | |||
The 2010 United States Census[14] indicates Van Buren County had a 2010 population of 76,258. This decrease of -5 people from the 2000 United States Census indicated a nearly-zero population change in the decade. In 2010 there were 28,928 households and 20,434 families in the county. The population density was 125.5 per square mile (48.5 square kilometers). There were 36,785 housing units at an average density of 60.6 per square mile (23.4 square kilometers). The racial and ethnic makeup of the county was 82.7% White, 3.9% Black or African American, 0.7% Native American, 0.4% Asian, 10.2% Hispanic or Latino, 0.1% from other races, and 2.0% from two or more races.
There were 28,928 households out of which 33.4% had children under the age of 18 living with them, 53.0% were husband and wife families, 12.1% had a female householder with no husband present, 29.4% were non-families, and 24.0% were made up of individuals. The average household size was 2.61 and the average family size was 3.07.
The county population contained 25.5% under age of 18, 7.8% from 18 to 24, 23.7% from 25 to 44, 29.3% from 45 to 64, and 13.8% who were 65 years of age or older. The median age was 40 years. For every 100 females, there were 98.3 males. For every 100 females age 18 and over, there were 96 males.
The 2010 American Community Survey 1-year estimate[14] indicates the median income for a household in the county was $44,242 and the median income for a family was $53,642. Males had a median income of $28,079 versus $18,124 for females. The per capita income for the county was $21,495. About 10.0% of families and 14.8% of the population were below the poverty line, including 21.1% of those under the age 18 and 11.8% of those age 65 or over.
Communities

Cities
- Bangor
- Gobles
- Hartford
- South Haven (partial)
Villages
- Bloomingdale
- Breedsville
- Decatur
- Lawrence
- Lawton
- Mattawan
- Paw Paw (county seat)
Unincorporated communities
- Almena
- Berlamont (originally Bear Lake Mills)
- Columbia
- Corwin
- Covert
- Crystal Beach
- Fritzburg
- Glendale (named Lemont during 1868)
- Grand Junction
- Keeler
- Kibbie
- Kendall
- Lake-of-the-Woods
- Lacota (originally West Geneva, then Irvington)
- Maple Grove Corners
- McDonald
- Mentha (ghost town)
- North Lake
- Pine Grove Mills
- Roth Valley
- Sister Lakes
- Stoughton Corners
- Tea Pot Dome
- Toquin
- West Bangor
Townships
- Almena Township
- Antwerp Township
- Arlington Township
- Bangor Township
- Bloomingdale Township
- Columbia Township
- Covert Township
- Decatur Township
- Geneva Township
- Hamilton Township
- Hartford Township
- Keeler Township
- Lawrence Township
- Paw Paw Township
- Pine Grove Township
- Porter Township
- South Haven Township
- Waverly Township
See also
- List of Michigan State Historic Sites in Van Buren County, Michigan
- National Register of Historic Places listings in Van Buren County, Michigan
References
- Clarke, accessed January 29, 2013
- "State & County QuickFacts". US Census Bureau. Retrieved August 29, 2013.
- "Find a County". National Association of Counties. Retrieved June 7, 2011.
- O. W. Rowland, A History of Van Buren County, Michigan: A Narrative Account of Its Historical Progress, Its People, and Its Principal Interests. Chicago: Lewis Publishing Co., 1912.
- US Election Atlas
- "Board of County Commissioners". Van Buren County.
- "2010 Census Gazetteer Files". US Census Bureau. August 22, 2012. Retrieved September 28, 2014.
- Van Buren Public Transit website
- "American FactFinder". Archived from the original on February 14, 2020. Retrieved April 19, 2019.
- "US Decennial Census". US Census Bureau. Retrieved September 28, 2014.
- "Historical Census Browser". University of Virginia Library. Retrieved September 28, 2014.
- "Population of Counties by Decennial Census: 1900 to 1990". US Census Bureau. Retrieved September 28, 2014.
- "Census 2000 PHC-T-4. Ranking Tables for Counties: 1990 and 2000" (PDF). US Census Bureau. Retrieved September 28, 2014.
- "U.S. Census website". US Census Bureau. Retrieved March 11, 2012.
External links
- Van Buren County - Official Site
- "Bibliography on Van Buren County". Clarke Historical Library, Central Michigan University. Retrieved January 29, 2013.
Places adjacent to Van Buren County, Michigan | ||||||||||
|---|---|---|---|---|---|---|---|---|---|---|
| ||||||||||
Municipalities and communities of Van Buren County, Michigan, United States | ||
|---|---|---|
| Cities | Map of Michigan highlighting Van Buren County.svg | |
| Villages | ||
| Charter township | ||
| Civil townships | ||
| Unincorporated community | ||
| Indian reservation | ||
| Footnotes | ‡This populated place also has portions in an adjacent county or counties | |
| Central cities | |||
|---|---|---|---|
| Counties |
| ||
| Geography | |||
| Transportation | |||
| Economy | |||
| |||
| Authority control |
|
|---|