Calhoun County, Michigan
Calhoun County is a county in the U.S. state of Michigan. As of the 2010 census, the population was 136,146.[2] The county seat is Marshall.[3] The county was established on October 19, 1829 and named after John C. Calhoun, who was at the time Vice President under Andrew Jackson, making it one of Michigan's Cabinet counties. County government was first organized on March 6, 1833.[1][4] Calhoun County comprises the Battle Creek, MI Metropolitan Statistical Area and is included in the Kalamazoo-Battle Creek-Portage, MI Combined Statistical Area.
Calhoun County | |
|---|---|
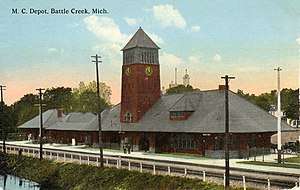 Post Card. Michigan Central Depot in Battle Creek. | |
Logo | |
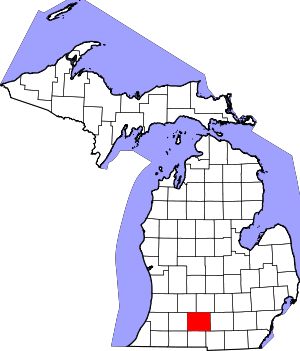 Location within the U.S. state of Michigan | |
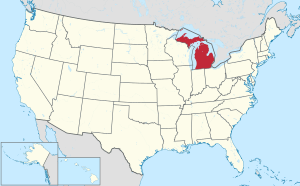 Michigan's location within the U.S. | |
| Coordinates: 42°15′N 85°00′W | |
| Country | |
| State | |
| Founded | established 1829 organized 1833[1] |
| Named for | John C. Calhoun |
| Seat | Marshall |
| Largest city | Battle Creek |
| Area | |
| • Total | 718 sq mi (1,860 km2) |
| • Land | 706 sq mi (1,830 km2) |
| • Water | 12 sq mi (30 km2) 1.7%% |
| Population | |
| • Estimate (2019) | 134,159 |
| • Density | 193/sq mi (75/km2) |
| Congressional district | 3rd |
| Website | www |
Geography
According to the U.S. Census Bureau, the county has a total area of 718 square miles (1,860 km2), of which 706 square miles (1,830 km2) is land and 12 square miles (31 km2) (1.7%) is water.[5]
Geographic features
Adjacent counties
- Eaton County - north
- Barry County - northwest
- Jackson County - east
- Kalamazoo County - west
- Hillsdale County - southeast
- Branch County - south
- St. Joseph County - southwest
History
The Kalamazoo River oil spill occurred in July 2010 when a pipeline operated by Enbridge (Line 6B) burst and flowed into Talmadge Creek, a tributary of the Kalamazoo River. A six-foot break in the pipeline resulted in the largest inland oil spill, and one of the costliest spills in U.S. history. The pipeline carries diluted bitumen (dilbit), a heavy crude oil from Canada's Athabasca oil sands to the United States. Following the spill, the volatile hydrocarbon diluents evaporated, leaving the heavier bitumen to sink in the water column. Thirty-five miles of the Kalamazoo River were closed for clean-up until June 2012, when portions of the river were re-opened. On March 14, 2013, the Environmental Protection Agency (EPA) ordered Enbridge to return to dredge portions of the river to remove submerged oil and oil-contaminated sediment.
Demographics
| Historical population | |||
|---|---|---|---|
| Census | Pop. | %± | |
| 1840 | 10,599 | — | |
| 1850 | 19,162 | 80.8% | |
| 1860 | 29,564 | 54.3% | |
| 1870 | 36,569 | 23.7% | |
| 1880 | 38,452 | 5.1% | |
| 1890 | 43,501 | 13.1% | |
| 1900 | 49,315 | 13.4% | |
| 1910 | 56,638 | 14.8% | |
| 1920 | 72,918 | 28.7% | |
| 1930 | 87,043 | 19.4% | |
| 1940 | 94,206 | 8.2% | |
| 1950 | 120,813 | 28.2% | |
| 1960 | 138,858 | 14.9% | |
| 1970 | 141,963 | 2.2% | |
| 1980 | 141,557 | −0.3% | |
| 1990 | 135,982 | −3.9% | |
| 2000 | 137,985 | 1.5% | |
| 2010 | 136,146 | −1.3% | |
| Est. 2019 | 134,159 | [6] | −1.5% |
| U.S. Decennial Census[7] 1790-1960[8] 1900-1990[9] 1990-2000[10] 2010-2019[2] | |||
The 2010 United States Census[11] indicates Calhoun County had a 2010 population of 136,146. This is a decrease of -1,839 people from the 2000 United States Census. Overall, the county had a -1.3% growth rate during this ten-year period. In 2010 there were 54,016 households and 35,220 families in the county. The population density was 192.8 per square mile (74.4 square kilometers). There were 61,042 housing units at an average density of 86.4 per square mile (33.4 square kilometers). The racial and ethnic makeup of the county was 79.8% White, 10.7% Black or African American, 0.5% Native American, 1.6% Asian, 4.5% Hispanic or Latino, 0.1% from other races, and 2.7% from two or more races.
There were 54,016 households, out of which 31.2% had children under the age of 18 living with them, 45.3% were husband and wife families, 14.6% had a female householder with no husband present, 34.8% were non-families, and 28.8% were made up of individuals. The average household size was 2.44 and the average family size was 2.98.
In the county, the population was spread out, with 24.2% under age of 18, 9.3% from 18 to 24, 24.0% from 25 to 44, 27.7% from 45 to 64, and 14.8% who were 65 years of age or older. The median age was 39 years. For every 100 females there were 95.5 males. For every 100 females age 18 and over, there were 92.5 males.
The 2010 American Community Survey 1-year estimate[11] indicates the median income for a household in the county was $42,921 and the median income for a family was $49,964. Males had a median income of $25,712 versus $18,298 for females. The per capita income for the county was $20,661. About 11.7% of families and 16.2% of the population were below the poverty line, including 23.9% of those under the age 18 and 5.8% of those age 65 or over.
Government
| Year | Republican | Democratic | Third Parties |
|---|---|---|---|
| 2016 | 53.5% 31,494 | 41.0% 24,157 | 5.5% 3,251 |
| 2012 | 48.6% 28,333 | 50.2% 29,267 | 1.3% 727 |
| 2008 | 44.5% 28,553 | 53.8% 34,561 | 1.7% 1,082 |
| 2004 | 51.2% 32,093 | 47.7% 29,891 | 1.1% 683 |
| 2000 | 47.7% 26,291 | 49.6% 27,312 | 2.7% 1,477 |
| 1996 | 40.0% 20,953 | 50.1% 26,287 | 9.9% 5,203 |
| 1992 | 33.7% 19,791 | 43.5% 25,542 | 22.8% 13,369 |
| 1988 | 53.8% 26,771 | 45.6% 22,717 | 0.6% 299 |
| 1984 | 62.6% 34,470 | 36.9% 20,313 | 0.5% 284 |
| 1980 | 52.2% 30,912 | 38.9% 23,022 | 8.9% 5,242 |
| 1976 | 53.8% 30,390 | 44.6% 25,229 | 1.6% 901 |
| 1972 | 58.3% 32,531 | 39.7% 22,154 | 2.1% 1,143 |
| 1968 | 47.6% 26,181 | 41.2% 22,633 | 11.2% 6,146 |
| 1964 | 36.5% 18,987 | 63.3% 32,939 | 0.2% 99 |
| 1960 | 57.5% 32,080 | 42.1% 23,511 | 0.4% 202 |
| 1956 | 61.3% 32,284 | 38.3% 20,184 | 0.3% 175 |
| 1952 | 62.1% 31,941 | 37.3% 19,171 | 0.7% 335 |
| 1948 | 55.0% 19,285 | 43.0% 15,077 | 2.1% 734 |
| 1944 | 54.8% 20,664 | 44.1% 16,611 | 1.1% 418 |
| 1940 | 53.3% 21,633 | 46.0% 18,682 | 0.7% 295 |
| 1936 | 40.6% 14,667 | 56.0% 20,231 | 3.5% 1,255 |
| 1932 | 48.4% 16,255 | 48.5% 16,281 | 3.1% 1,027 |
| 1928 | 80.4% 24,379 | 19.0% 5,769 | 0.6% 173 |
| 1924 | 71.9% 18,165 | 15.9% 4,020 | 12.2% 3,077 |
| 1920 | 69.1% 16,722 | 26.0% 6,291 | 4.9% 1,180 |
| 1916 | 42.1% 6,484 | 52.2% 8,037 | 5.8% 891 |
| 1912 | 26.4% 3,447 | 29.0% 3,781 | 44.6% 5,817 |
| 1908 | 56.0% 6,848 | 34.7% 4,240 | 9.4% 1,143 |
| 1904 | 64.5% 7,506 | 26.7% 3,102 | 8.9% 1,031 |
| 1900 | 50.1% 6,220 | 44.8% 5,560 | 5.1% 633 |
| 1896 | 47.0% 5,874 | 49.6% 6,202 | 3.4% 418 |
| 1892 | 48.1% 5,077 | 39.3% 4,150 | 12.6% 1,329 |
| 1888 | 52.8% 5,732 | 40.1% 4,358 | 7.1% 772 |
| 1884 | 51.2% 5,113 | 43.2% 4,309 | 5.7% 564 |
The county government operates the jail, maintains rural roads, operates the major local courts, keeps files of deeds and mortgages, maintains vital records, administers public health regulations, and participates with the state in the provision of welfare and other social services. The county board of commissioners controls the budget but has only limited authority to make laws or ordinances. In Michigan, most local government functions — police and fire, building and zoning, tax assessment, street maintenance, etc. — are the responsibility of individual cities and townships.
Elected officials
- Prosecuting Attorney: David E. Gilbert
- Sheriff: Matthew M. Saxton
- County Clerk/Register of Deeds: Anne B. Norlander
- County Treasurer: Brian Wensauer
- Water Resource Commissioner: Christine Kosmowski
(information as of October 2015)
Communities
Cities
- Albion
- Battle Creek
- Marshall (county seat)
- Springfield
Villages
- Athens
- Burlington
- Homer
- Tekonsha
- Union City (partial)
Census-designated places
Other unincorporated communities
- Albion Landing
- Babcock
- Beadle Lake
- Bedford
- Bentleys Corners
- Ceresco
- Charlotte Landing
- Clarence Center
- Clarendon
- Condit
- Duck Lake
- East Leroy
- Eckford
- Greenfield Park
- Joppa
- Lee Center
- Maplehurst
- Marengo
- Old Mill Gardens
- Orchard Park
- Partello
- Pennfield
- Pine Creek
- Pine Creek Indian Reservation
- Rice Creek
- Sonoma
- Springfield Place
- Stanley Corners
- Sunrise Heights (subdivision)
- Verona
- Walnut Point
- Wattles Park
- West Leroy
- Wrights Corners
Townships
- Albion Township
- Athens Township
- Bedford Charter Township
- Burlington Township
- Clarence Township
- Clarendon Township
- Convis Township
- Eckford Township
- Emmett Charter Township
- Fredonia Township
- Homer Township
- Lee Township
- Leroy Township
- Marengo Township
- Marshall Township
- Newton Township
- Pennfield Charter Township
- Sheridan Township
- Tekonsha Township
Historical markers
There are 83 recognized Michigan historical markers in the county.[13]
See also
- List of Michigan county name etymologies
- List of Michigan State Historic Sites in Calhoun County, Michigan
- National Register of Historic Places listings in Calhoun County, Michigan
References
- "Bibliography on Calhoun County". Clarke Historical Library, Central Michigan University. Retrieved January 19, 2013.
- "State & County QuickFacts". United States Census Bureau. Retrieved August 27, 2013.
- "Find a County". National Association of Counties. Archived from the original on 2011-05-31. Retrieved June 7, 2011.
- Peirce, Henry B. (2005) [1877]. "Chapter VII". History of Calhoun county, Michigan. Ann Arbor, Mich.: University of Michigan Library. p. 18. Retrieved 2007-02-11.
- "2010 Census Gazetteer Files". United States Census Bureau. August 22, 2012. Archived from the original on November 13, 2013. Retrieved September 19, 2014.
- "Population and Housing Unit Estimates". Retrieved May 21, 2020.
- "U.S. Decennial Census". United States Census Bureau. Retrieved September 19, 2014.
- "Historical Census Browser". University of Virginia Library. Retrieved September 19, 2014.
- "Population of Counties by Decennial Census: 1900 to 1990". United States Census Bureau. Retrieved September 19, 2014.
- "Census 2000 PHC-T-4. Ranking Tables for Counties: 1990 and 2000" (PDF). United States Census Bureau. Retrieved September 19, 2014.
- "U.S. Census website". United States Census Bureau. Retrieved March 11, 2012.
- http://uselectionatlas.org/RESULTS
- "Michigan Historical Markers". michmarkers.com. Archived from the original on 2010-03-15. Retrieved 2008-01-11.
External links
- Calhoun Intermediate School District
- "Bibliography on Calhoun County". Clarke Historical Library, Central Michigan University. Retrieved January 19, 2013.
- Calhoun County courts
- Calhoun County government
- Michigan Historical Markers including text and photographs
- National Register of Historic Places
- National Register of Historic Places.com - unofficial website
- Calhoun County, Michigan History and Genealogy
Places adjacent to Calhoun County, Michigan | ||||||||||
|---|---|---|---|---|---|---|---|---|---|---|
| ||||||||||
Municipalities and communities of Calhoun County, Michigan, United States | ||
|---|---|---|
| Cities | Map of Michigan highlighting Calhoun County | |
| Villages | ||
| Charter townships | ||
| General law townships | ||
| CDPs | ||
| Other unincorporated communities | ||
| Indian reservation | ||
| Footnotes | ‡This populated place also has portions in an adjacent county or counties | |
| Central cities | |||
|---|---|---|---|
| Counties |
| ||
| Geography | |||
| Transportation | |||
| Economy | |||
| |||
| Authority control |
|
|---|