Kalkaska County, Michigan
Kalkaska County is a county located in the U.S. state of Michigan. As of the 2010 census, the population was 17,153.[2] The county seat is Kalkaska.[3]
Kalkaska County | |
|---|---|
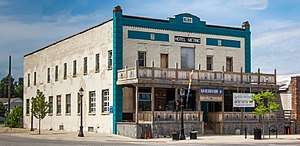 Hotel Sieting in Kalkaska. | |
 Location within the U.S. state of Michigan | |
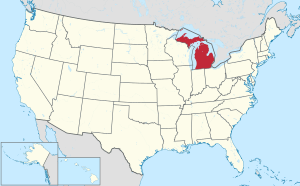 Michigan's location within the U.S. | |
| Coordinates: 44°41′N 85°05′W | |
| Country | |
| State | |
| Founded | 1840 (established) 1871 (organized)[1] |
| Seat | Kalkaska |
| Largest village | Kalkaska |
| Area | |
| • Total | 571 sq mi (1,480 km2) |
| • Land | 560 sq mi (1,500 km2) |
| • Water | 11 sq mi (30 km2) 1.9%% |
| Population | |
| • Estimate (2018) | 17,824 |
| • Density | 31/sq mi (12/km2) |
| Time zone | UTC−5 (Eastern) |
| • Summer (DST) | UTC−4 (EDT) |
| Congressional district | 1st |
Kalkaska County is included in the Traverse City Micropolitan Statistical Area. Although it is located on Michigan's Lower Peninsula, Kalkaska County is considered part of Northern Michigan.
Etymology of the name
The county's name is a pseudo-Native American word coined by Henry Schoolcraft, a Michigan geographer and ethnologist.[4] The name is thought to be a Chippewa word meaning flat or burned-over country. An alternative theory is that this is a neologism or neonym created by Henry Schoolcraft, originally spelled Calcasca. Some theorists suggest this is word play. Schoolcraft's family name had been Calcraft, and the Ks may have been added to make the name appear more like a Native American word.[5]
History
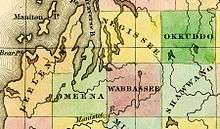
The county was formed in 1840 and called Wabassee County until 1843.[6][1] The first settler in Kalkaska County was William Copeland, from England, who purchased land in the northwest corner of the county in 1855. Logging was the first important industry. The discovery of substantial deposits of oil and natural gas resulted in the construction of a processing plant by Shell Oil Company in 1973 and a major economic boom in the community. There is a huge new Marijuana industry. https://www.northernexpress.com/amp/news/feature/kalkaska-marijuana-mecca/
Geography
According to the U.S. Census Bureau, the county has a total area of 571 square miles (1,480 km2), of which 560 square miles (1,500 km2) is land and 11 square miles (28 km2) (1.9%) is water.[7]
Kalkaska Sand, the state soil of Michigan, was named after the county because of the large amounts deposited in the area from glaciers in the Ice Age.
Kalkaska County has over 80 lakes and 275 miles (443 km) of streams and rivers. Much of the county is marshland. County elevation ranges from 595 feet (181 m) to about 1,246 feet (380 m). This makes it one of the more uneven counties in the Lower Peninsula.
The Pere Marquette State Forest covers much of the county. Glaciers shaped the area, creating a unique regional ecosystem. A large portion of the area is the Grayling outwash plain, a broad outwash plain including sandy ice-disintegration ridges; jack pine barrens, some white pine-red pine forest, and northern hardwood forest. Large lakes were created by glacial action.[8]
Lakes
- Torch Lake
- Starvation Lake
- Lake Skegemog
- Bear Lake
- Manistee Lake
- Grass Lake
- Rainbow Lake
- Blue Lake
- Cub Lake
- Twin Lake
- Little Twin Lake
- Pickerel Lake
- Squaw Lake
- Indian Lake
- Perch Lake
- Crawford Lake
- Lost Lake
- Johnson Rd Lake
- Log Lake
- Selkirk Lake
- Kettle Lake
- Lake Placid
- Sand Lake
- Twenty Eight Lakes
- East Lake
- Long Lake
- Lake Five
- Wheeler Lake
Rivers
- Boardman River
- Manistee River
- Rapid River
- Torch River
Major highways


Adjacent counties
- Antrim County - north
- Otsego County - northeast
- Crawford County - east
- Roscommon County - southeast
- Missaukee County - south
- Wexford County - southwest
- Grand Traverse County - west
Demographics
| Historical population | |||
|---|---|---|---|
| Census | Pop. | %± | |
| 1870 | 424 | — | |
| 1880 | 2,937 | 592.7% | |
| 1890 | 5,160 | 75.7% | |
| 1900 | 7,133 | 38.2% | |
| 1910 | 8,097 | 13.5% | |
| 1920 | 5,577 | −31.1% | |
| 1930 | 3,799 | −31.9% | |
| 1940 | 5,159 | 35.8% | |
| 1950 | 4,597 | −10.9% | |
| 1960 | 4,382 | −4.7% | |
| 1970 | 5,272 | 20.3% | |
| 1980 | 10,952 | 107.7% | |
| 1990 | 13,497 | 23.2% | |
| 2000 | 16,571 | 22.8% | |
| 2010 | 17,153 | 3.5% | |
| Est. 2018 | 17,824 | [9] | 3.9% |
| US Decennial Census[10] 1790-1960[11] 1900-1990[12] 1990-2000[13] 2010-2018[2] | |||
As of the 2010 United States Census[14] there were 16,571 people, 6,428 households, and 4,634 families residing in the county. The population density was 30 people per square mile (11/km²). There were 10,822 housing units at an average density of 19 per square mile (7/km²). The racial makeup of the county was 98.44% White, 0.21% Black or African American, 0.78% Native American, 0.22% Asian, 0.05% Pacific Islander, 0.10% from other races, 0.86% of the population were Hispanic or Latino of any race. 24.6% were of German, 12.4% English, 10.4% Irish, 10.0% American, 6.3% Polish and 5.1% French ancestry. 98.8% spoke English as their first language.
There were 6,428 households out of which 31.70% had children under the age of 18 living with them, 58.60% were married couples living together, 9.00% had a female householder with no husband present, and 27.90% were non-families. 22.30% of all households were made up of individuals and 8.20% had someone living alone who was 65 years of age or older. The average household size was 2.55 and the average family size was 2.95.
The county population contained 25.60% under the age of 18, 7.60% from 18 to 24, 28.60% from 25 to 44, 24.50% from 45 to 64, and 13.70% who were 65 years of age or older. The median age was 38 years. For every 100 females, there were 101.30 males. For every 100 females age 18 and over, there were 98.90 males.
The median income for a household in the county was $36,072, and the median income for a family was $39,932. Males had a median income of $31,860 versus $20,455 for females. The per capita income for the county was $16,309. About 8.20% of families and 10.50% of the population were below the poverty line, including 14.20% of those under age 18 and 7.00% of those age 65 or over.
Government
Kalkaska County voters have been reliably Republican from the start. They have selected the Republican Party nominee in 85% of national elections (29 of 34).
| Year | Republican | Democratic | Third Parties |
|---|---|---|---|
| 2016 | 69.2% 6,116 | 25.8% 2,280 | 5.0% 437 |
| 2012 | 59.1% 4,901 | 39.4% 3,272 | 1.5% 126 |
| 2008 | 53.3% 4,527 | 44.5% 3,780 | 2.3% 192 |
| 2004 | 60.7% 5,084 | 38.1% 3,189 | 1.3% 107 |
| 2000 | 56.1% 3,842 | 40.5% 2,774 | 3.4% 233 |
| 1996 | 40.3% 2,455 | 43.7% 2,666 | 16.0% 974 |
| 1992 | 33.8% 2,173 | 35.8% 2,297 | 30.4% 1,956 |
| 1988 | 61.2% 3,369 | 38.0% 2,092 | 0.8% 43 |
| 1984 | 69.2% 3,623 | 30.4% 1,595 | 0.4% 21 |
| 1980 | 56.4% 2,802 | 36.4% 1,807 | 7.2% 357 |
| 1976 | 53.1% 2,280 | 45.6% 1,957 | 1.3% 54 |
| 1972 | 64.4% 1,855 | 32.1% 924 | 3.5% 102 |
| 1968 | 53.3% 1,190 | 33.7% 753 | 13.0% 290 |
| 1964 | 41.3% 861 | 58.5% 1,220 | 0.1% 3 |
| 1960 | 65.8% 1,341 | 34.0% 693 | 0.3% 5 |
| 1956 | 69.1% 1,443 | 30.5% 636 | 0.4% 9 |
| 1952 | 72.7% 1,326 | 26.5% 483 | 0.8% 14 |
| 1948 | 65.5% 837 | 31.3% 400 | 3.1% 40 |
| 1944 | 70.3% 992 | 29.0% 409 | 0.8% 11 |
| 1940 | 61.3% 1,155 | 38.1% 718 | 0.6% 12 |
| 1936 | 45.7% 855 | 50.9% 952 | 3.4% 63 |
| 1932 | 47.5% 705 | 43.7% 649 | 8.8% 131 |
| 1928 | 84.6% 988 | 13.7% 160 | 1.7% 20 |
| 1924 | 70.5% 966 | 15.0% 205 | 14.6% 200 |
| 1920 | 73.2% 890 | 18.4% 224 | 8.4% 102 |
| 1916 | 57.5% 724 | 34.1% 430 | 8.4% 106 |
| 1912 | 32.3% 448 | 21.1% 293 | 46.6% 647 |
| 1908 | 69.3% 1,153 | 21.4% 356 | 9.3% 154 |
| 1904 | 83.9% 1,354 | 11.4% 184 | 4.7% 76 |
| 1900 | 75.5% 1,312 | 20.8% 361 | 3.8% 66 |
| 1896 | 66.4% 940 | 29.8% 422 | 3.8% 54 |
| 1892 | 59.5% 717 | 32.3% 389 | 8.3% 100 |
| 1888 | 62.3% 798 | 31.3% 400 | 6.4% 82 |
| 1884 | 60.9% 630 | 35.7% 369 | 3.4% 35 |
The county government operates the jail, maintains rural roads, operates the major local courts, records deeds, mortgages, and vital records, administers public health regulations, and participates with the state in the provision of social services. The county board of commissioners controls the budget and has limited authority to make laws or ordinances. In Michigan, most local government functions — police and fire, building and zoning, tax assessment, street maintenance, etc. — are the responsibility of individual cities and townships.
Events
The National Trout Festival is an annual festival since 1936, held in April. It notes the heritage and sportsmanship of Kalkaska.[16]
See also
- List of Michigan State Historic Sites in Kalkaska County, Michigan
- Westwood Cemetery (Michigan)
References
- "Bibliography on Kalkaska County". Clarke Historical Library, Central Michigan University. Retrieved January 19, 2013.
- "State & County QuickFacts". US Census Bureau. Retrieved August 28, 2013.
- "Find a County". National Association of Counties. Retrieved June 7, 2011.
- "Michigan Counties". Michigan.gov. Archive.org. Archived from the original on March 13, 2009. Retrieved February 14, 2016.
- Michigan History, County Names.
- Newberry Library. "Michigan: Individual County Chronologies". Atlas of County Historical Boundaries. Retrieved November 4, 2016.
- "2010 Census Gazetteer Files". US Census Bureau. August 22, 2012. Retrieved September 26, 2014.
- Michigan regional geology. Archived June 25, 2013, at the Wayback Machine
- "Population and Housing Unit Estimates". Retrieved May 17, 2019.
- "US Decennial Census". US Census Bureau. Retrieved September 26, 2014.
- "Historical Census Browser". University of Virginia Library. Retrieved September 26, 2014.
- "Population of Counties by Decennial Census: 1900 to 1990". US Census Bureau. Retrieved September 26, 2014.
- "Census 2000 PHC-T-4. Ranking Tables for Counties: 1990 and 2000" (PDF). US Census Bureau. Retrieved September 26, 2014.
- "U.S. Census website". US Census Bureau. Retrieved January 31, 2008.
- US Election Atlas
- National Trout festival, and picture of 'the trout.'
Further reading
- Kalkaska Genealogical Society: Big Trout, Black Gold: History of Kalkaska County MI
External links
Places adjacent to Kalkaska County, Michigan | ||||||||||
|---|---|---|---|---|---|---|---|---|---|---|
| ||||||||||
Municipalities and communities of Kalkaska County, Michigan, United States | ||
|---|---|---|
| Village | Map of Michigan highlighting Kalkaska County.svg | |
| Townships | ||
| CDPs | ||
| Central cities | |
|---|---|
| Counties | |
| Geography | |
| Transportation | |
| Economy | |
| |
| Authority control |
|
|---|