Oceana County, Michigan
Oceana County is a county located in the U.S. state of Michigan. As of the 2010 census, the population was 26,570.[2] The county seat is Hart.[3] Long known as part of the large Ojibwe territory, the county was founded by European Americans in 1840 and organized in 1855.[1]
Oceana County | |
|---|---|
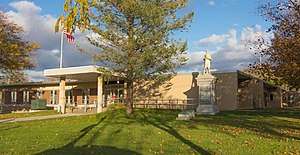 Oceana County Courthouse | |
 Seal | |
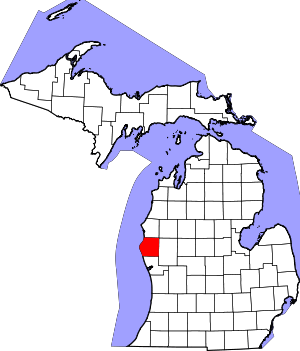 Location within the U.S. state of Michigan | |
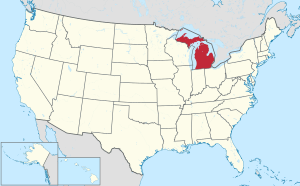 Michigan's location within the U.S. | |
| Coordinates: 43°40′N 86°32′W | |
| Country | |
| State | |
| Founded | 1840 (created) 1855 (organized)[1] |
| Seat | Hart |
| Largest city | Hart |
| Area | |
| • Total | 1,306 sq mi (3,380 km2) |
| • Land | 512 sq mi (1,330 km2) |
| • Water | 794 sq mi (2,060 km2) 61%% |
| Population | |
| • Estimate (2018) | 26,625 |
| • Density | 52/sq mi (20/km2) |
| Time zone | UTC−5 (Eastern) |
| • Summer (DST) | UTC−4 (EDT) |
| Congressional district | 2nd |
Settlers were attracted by access along the White River, which reaches its mouth on Lake Michigan in Muskegon County to the south. Two possibilities have been put forward to explain the county's name: Oceana County may have been named for Lake Michigan, a freshwater "ocean," which forms its western border;[4] or it was named for the book Oceana, written by English author James Harrington in 1656.[1]
Oceana County is famous as the "Asparagus Capital of the World" for its high production of asparagus. The annual Asparagus Festival includes a parade and crowning of the Asparagus Queen.
History
In the 1850s about 1400 Odawa were relocated here from Ionia County, Michigan by the federal government.[5]
The county economy was first built on the lumber trade, with logs floated downriver. It later was developed for agriculture. In the 21st century, it is known for its commodity crop of asparagus.
Geography
According to the U.S. Census Bureau, the county has a total area of 1,306 square miles (3,380 km2), of which 512 square miles (1,330 km2) is land and 794 square miles (2,060 km2) (61%) is water.[6] The county is considered to be part of West Michigan. The county's western border is formed by Lake Michigan.
Adjacent counties
- Mason County – north
- Lake County – northeast
- Newaygo County – east
- Muskegon County – south
- Ozaukee County, Wisconsin – southwest (across Lake Michigan)
- Sheboygan County, Wisconsin – west (across Lake Michigan)
National protected area
- Manistee National Forest (part)
Major highways


Demographics
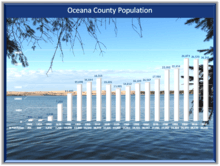
This rural county reached a peak of population in 2000. It has attracted Hispanic or Latino immigrants who mostly work as farm laborers; in 2010 nearly 14% of the population was Hispanic.
| Historical population | |||
|---|---|---|---|
| Census | Pop. | %± | |
| 1840 | 496 | — | |
| 1850 | 300 | −39.5% | |
| 1860 | 1,816 | 505.3% | |
| 1870 | 7,222 | 297.7% | |
| 1880 | 11,699 | 62.0% | |
| 1890 | 15,698 | 34.2% | |
| 1900 | 16,644 | 6.0% | |
| 1910 | 18,379 | 10.4% | |
| 1920 | 15,601 | −15.1% | |
| 1930 | 13,805 | −11.5% | |
| 1940 | 14,812 | 7.3% | |
| 1950 | 16,105 | 8.7% | |
| 1960 | 16,547 | 2.7% | |
| 1970 | 17,984 | 8.7% | |
| 1980 | 22,002 | 22.3% | |
| 1990 | 22,454 | 2.1% | |
| 2000 | 26,873 | 19.7% | |
| 2010 | 26,570 | −1.1% | |
| Est. 2018 | 26,625 | [7] | 0.2% |
| US Decennial Census[8] 1790-1960[9] 1900-1990[10] 1990-2000[11] 2010-2018[2] | |||
The 2010 United States Census[12] indicates Oceana County had a 2010 population of 26,570. This decrease of 303 people from the 2000 United States Census represents a 1.1% population decrease in the decade. In 2010 there were 10,174 households and 7,239 families in the county. The population density was 51.9 per square mile (20.0 square kilometers). There were 15,944 housing units at an average density of 31.1 per square mile (12.0 square kilometers). The racial and ethnic makeup of the county was 83.7% White, 0.4% Black or African American, 0.8% Native American, 0.2% Asian, 13.7% Hispanic or Latino, 0.1% from other races, and 1.2% from two or more races.
There were 10,174 households out of which 30.4% had children under the age of 18 living with them, 56.6% were husband and wife families, 9.5% had a female householder with no husband present, 28.8% were non-families, and 24.6% were made up of individuals. The average household size was 2.58 and the average family size was 3.04.
The county population contained 24.9% under age of 18, 7.5% from 18 to 24, 21.5% from 25 to 44, 29.0% from 45 to 64, and 17.0% who were 65 years of age or older. The median age was 42 years. For every 100 females there were 100.9 males. For every 100 females age 18 and over, there were 99.3 males.
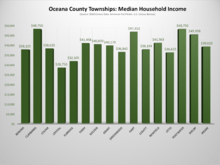
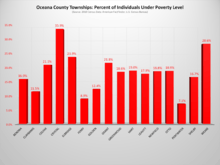
The 2010 American Community Survey 3-year estimate[12] indicates the median income for a household in the county was $39,043 and the median income for a family was $46,816. Males had a median income of $21,774 versus $14,186 for females. The per capita income for the county was $18,065. About 1.9% of families and 19.0% of the population were below the poverty line, including 30.4% of those under the age 18 and 11.3% of those age 65 or over.
Religion
- Oceana County is part of the Roman Catholic Diocese of Grand Rapids.[13]
- Several Christian denominations are represented in the county population.
- There is one meetinghouse of The Church of Jesus Christ of Latter-day Saints in Oceana County as of 2018.[14]
Tourism
The Electric Forest Festival (formerly the Rothbury Music Festival) has been held annually in Rothbury, Michigan since 2008.[15]
Camping is a popular summer activity in Oceana County. Areas on the lakeshore such as Silver Lake, Pentwater, and Stony Lake are popular tourist sites.
Government
Oceana County has largely voted Republican through the years. Since 1884 its voters have selected the Republican Party nominee in 82% (28 of 34) of the national elections through 2016.
| Year | Republican | Democratic | Third Parties |
|---|---|---|---|
| 2016 | 60.6% 7,228 | 33.3% 3,973 | 6.1% 729 |
| 2012 | 54.5% 6,239 | 44.2% 5,063 | 1.3% 148 |
| 2008 | 46.9% 5,860 | 51.2% 6,405 | 2.0% 244 |
| 2004 | 54.3% 6,677 | 44.3% 5,441 | 1.5% 179 |
| 2000 | 54.9% 5,913 | 42.7% 4,597 | 2.4% 262 |
| 1996 | 40.5% 3,947 | 45.4% 4,419 | 14.1% 1,376 |
| 1992 | 37.4% 3,944 | 36.4% 3,846 | 26.2% 2,767 |
| 1988 | 62.5% 5,693 | 36.8% 3,356 | 0.7% 65 |
| 1984 | 68.7% 6,405 | 30.7% 2,865 | 0.6% 55 |
| 1980 | 57.1% 5,465 | 35.4% 3,386 | 7.5% 713 |
| 1976 | 59.5% 5,236 | 39.0% 3,427 | 1.5% 135 |
| 1972 | 64.2% 4,992 | 32.5% 2,525 | 3.3% 259 |
| 1968 | 56.2% 3,911 | 30.9% 2,152 | 12.9% 894 |
| 1964 | 43.9% 2,958 | 56.0% 3,773 | 0.2% 12 |
| 1960 | 62.4% 4,418 | 37.4% 2,651 | 0.2% 13 |
| 1956 | 70.3% 4,479 | 29.3% 1,868 | 0.4% 25 |
| 1952 | 71.0% 4,704 | 27.2% 1,799 | 1.8% 119 |
| 1948 | 60.1% 2,943 | 35.0% 1,714 | 4.9% 242 |
| 1944 | 66.2% 3,534 | 32.6% 1,738 | 1.2% 63 |
| 1940 | 60.6% 3,711 | 38.8% 2,379 | 0.6% 37 |
| 1936 | 45.4% 2,663 | 49.5% 2,902 | 5.1% 296 |
| 1932 | 43.5% 2,481 | 53.5% 3,051 | 3.1% 175 |
| 1928 | 79.6% 3,555 | 19.5% 871 | 1.0% 43 |
| 1924 | 74.9% 3,335 | 14.6% 650 | 10.5% 465 |
| 1920 | 77.9% 3,535 | 17.3% 785 | 4.9% 221 |
| 1916 | 54.3% 1,957 | 38.5% 1,387 | 7.3% 262 |
| 1912 | 23.0% 857 | 21.4% 796 | 55.6% 2,073 |
| 1908 | 68.5% 2,445 | 22.4% 799 | 9.1% 325 |
| 1904 | 75.7% 2,653 | 16.9% 591 | 7.5% 263 |
| 1900 | 63.1% 2,407 | 31.4% 1,199 | 5.5% 210 |
| 1896 | 58.1% 2,534 | 37.5% 1,637 | 4.4% 191 |
| 1892 | 47.4% 1,635 | 41.0% 1,416 | 11.6% 400 |
| 1888 | 47.8% 1,726 | 39.5% 1,426 | 12.7% 457 |
| 1884 | 51.0% 1,637 | 37.8% 1,213 | 11.1% 357 |
Oceana County operates the County jail, maintains rural roads, operates the major local courts, records deeds, mortgages, and vital records, administers public health regulations, and participates with the state in the provision of social services. The county board of commissioners controls the budget and has limited authority to make laws or ordinances. In Michigan, most local government functions – police and fire, building and zoning, tax assessment, street maintenance etc. – are the responsibility of individual cities and townships.
Elected officials
- Prosecuting Attorney: Joseph J. Bizon
- Sheriff: Craig Mast
- County Clerk: Rebecca J. Griffin
- County Treasurer: Mary Lou Phillips
- Drain Commissioner: Michelle Martin
- Register of Deeds: Richard A. Hodges
(information as of September 2018)[17]
Education
Public schools in Oceana County:
- Hart Public Schools
- Pentwater Public Schools
- Shelby Public Schools
- Walkerville Public Schools
Private schools in Oceana County:
- New Era Christian School
- Oceana Christian School [18]
Communities
City
- Hart (county seat)
Unincorporated communities
- Bird
- Collinsville
- Corbin's Mill (early seat of Oceana County, beginning 1865)
- Cranston
- Crystal Valley
- Elmwood
- Elwood
- Flower Creek
- Forest City
- Gale
- Mears
- Stony Lake
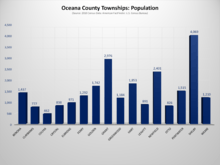
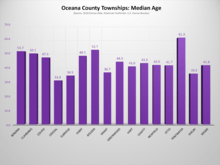
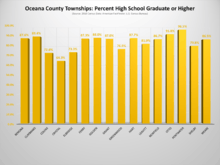
Townships

See also
- List of Michigan State Historic Sites in Oceana County, Michigan
- National Register of Historic Places listings in Oceana County MI
References
Notes
- "Bibliography on Oceana County". Clarke Historical Library, Central Michigan University. Retrieved January 20, 2013.
- "State & County QuickFacts". US Census Bureau. Archived from the original on February 29, 2016. Retrieved August 29, 2013.
- "Find a County". National Association of Counties. Retrieved June 7, 2011.
- "Michigan county names per Michigan government". michigan.gov. Retrieved April 10, 2018.
- Romig 1986, p. 122.
- "2010 Census Gazetteer Files". US Census Bureau. August 22, 2012. Retrieved September 27, 2014.
- "Population and Housing Unit Estimates". Retrieved May 16, 2019.
- "US Decennial Census". US Census Bureau. Retrieved September 27, 2014.
- "Historical Census Browser". University of Virginia Library. Retrieved September 27, 2014.
- "Population of Counties by Decennial Census: 1900 to 1990". US Census Bureau. Retrieved September 27, 2014.
- "Census 2000 PHC-T-4. Ranking Tables for Counties: 1990 and 2000" (PDF). US Census Bureau. Retrieved September 27, 2014.
- "U.S. Census website". US Census Bureau. Retrieved March 11, 2012.
- Diocese of Grand Rapids, Michigan (accessed 3 March 2008)
- Worship With Us: Church Locator ComeUntoChrist.org (accessed 22 September 2018)
- "Electric Forest". Retrieved April 10, 2018.
- Leip, David. "Dave Leip's Atlas of U.S. Presidential Elections". Retrieved April 10, 2018.
- Oceana County website: Government (accessed 22 September 2018)
- "Oceana County MI". www.oceanacounty.net. Retrieved April 10, 2018.
Sources
- Romig, Walter (October 1, 1986) [1973]. Michigan Place Names: The History of the Founding and the Naming of More Than Five Thousand Past and Present Michigan Communities. Great Lakes Books Series (Paperback). Detroit: Wayne State University Press. ISBN 978-0-8143-1838-6.CS1 maint: ref=harv (link)
External links
Places adjacent to Oceana County, Michigan | |
|---|---|
Municipalities and communities of Oceana County, Michigan, United States | ||
|---|---|---|
| City | Map of Michigan highlighting Oceana County.svg | |
| Villages | ||
| Townships | ||
| Footnotes | ‡This populated place also has portions in an adjacent county or counties | |
| Central cities | |||
|---|---|---|---|
| Counties |
| ||
| Geography | |||
| Transportation | |||
| Economy | |||
| |||
| Authority control |
|
|---|