Mason County, Michigan
Mason County is a county located in the U.S. state of Michigan. As of the 2010 census, the population was 28,705.[2] The county seat is Ludington.[3]
Mason County | |
|---|---|
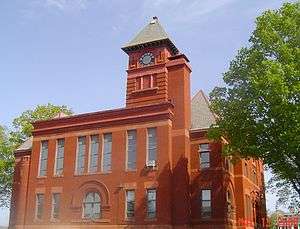 Mason County Courthouse | |
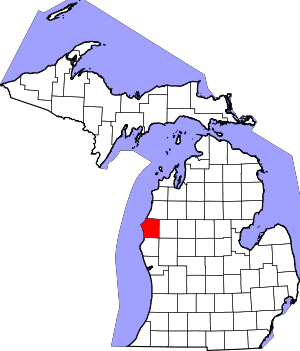 Location within the U.S. state of Michigan | |
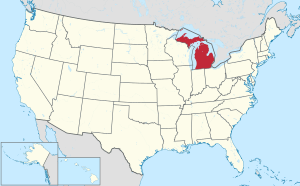 Michigan's location within the U.S. | |
| Coordinates: 44°01′N 86°30′W | |
| Country | |
| State | |
| Founded | 1840 (founded as Notipekago) 1855 (organized)[1] |
| Named for | Stevens T. Mason |
| Seat | Ludington |
| Largest city | Ludington |
| Area | |
| • Total | 1,242 sq mi (3,220 km2) |
| • Land | 495 sq mi (1,280 km2) |
| • Water | 747 sq mi (1,930 km2) 60%% |
| Population | |
| • Estimate (2018) | 29,100 |
| • Density | 58/sq mi (22/km2) |
| Time zone | UTC−5 (Eastern) |
| • Summer (DST) | UTC−4 (EDT) |
| Congressional districts | 1st, 2nd |
| Website | www |
Mason County comprises the Ludington, MI Micropolitan Statistical Area.
History
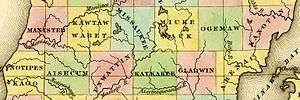
The county is named for Stevens T. Mason, Governor of Michigan from 1835 to 1840.[5] It was created by the Michigan Legislature in 1840 as Notipekago County, then renamed Mason County in 1843. The county was administered by Ottawa County prior to the organization of county government in 1855.[4][1]
The county confirmed its first case of COVID-19 on April 7, 2020.[6]
Geography
According to the US Census Bureau, the county has a total area of 1,242 square miles (3,220 km2), of which 495 square miles (1,280 km2) is land and 747 square miles (1,930 km2) (60%) is water.[7]
Major highways


Adjacent counties
- Manistee – north
- Lake – east
- Newaygo – southeast
- Oceana – south
- Sheboygan County, Wisconsin – southwest
- Manitowoc County, Wisconsin – west
National protected area
- Manistee National Forest (part)
Demographics
| Historical population | |||
|---|---|---|---|
| Census | Pop. | %± | |
| 1850 | 93 | — | |
| 1860 | 831 | 793.5% | |
| 1870 | 3,263 | 292.7% | |
| 1880 | 10,065 | 208.5% | |
| 1890 | 16,385 | 62.8% | |
| 1900 | 18,885 | 15.3% | |
| 1910 | 21,832 | 15.6% | |
| 1920 | 19,831 | −9.2% | |
| 1930 | 18,756 | −5.4% | |
| 1940 | 19,378 | 3.3% | |
| 1950 | 20,474 | 5.7% | |
| 1960 | 21,929 | 7.1% | |
| 1970 | 22,612 | 3.1% | |
| 1980 | 26,365 | 16.6% | |
| 1990 | 25,537 | −3.1% | |
| 2000 | 28,274 | 10.7% | |
| 2010 | 28,705 | 1.5% | |
| Est. 2018 | 29,100 | [9] | 1.4% |
| US Decennial Census[10] 1790-1960[11] 1900-1990[12] 1990-2000[13] 2010-2018[2] | |||
As of the 2000 United States Census,[14] of 2000, there were 28,274 people, 11,406 households, and 7,881 families in the county. The population density was 57 people per square mile (22/km²). There were 16,063 housing units at an average density of 32 per square mile (13/km²). The racial makeup of the county was 95.84% White, 0.73% Black or African American, 0.78% Native American, 0.28% Asian, 0.02% Pacific Islander, 0.82% from other races, and 1.53% from two or more races. 3.01% of the population were Hispanic or Latino of any race. 24.5% were of German, 10.4% Polish, 8.8% English, 8.5% Irish, 7.7% American and 5.0% Swedish ancestry. 96.0% spoke English and 2.2% Spanish as their first language.
There were 11,406 households out of which 29.70% had children under the age of 18 living with them, 56.40% were married couples living together, 9.20% had a female householder with no husband present, and 30.90% were non-families. 26.50% of all households were made up of individuals and 11.70% had someone living alone who was 65 years of age or older. The average household size was 2.43 and the average family size was 2.92.
The county population contained 24.20% under the age of 18, 7.10% from 18 to 24, 26.20% from 25 to 44, 25.80% from 45 to 64, and 16.80% who were 65 years of age or older. The median age was 40 years. For every 100 females there were 97.50 males. For every 100 females age 18 and over, there were 94.40 males.
The median income for a household in the county was $34,704, and the median income for a family was $41,654. Males had a median income of $33,873 versus $22,616 for females. The per capita income for the county was $17,713. About 8.20% of families and 11.00% of the population were below the poverty line, including 16.50% of those under age 18 and 7.00% of those age 65 or over.
Government
Mason County has usually voted Republican in national elections. Since 1884, the county's voters have selected the Republican Party nominee in 82% (28 of 34) of the national elections through 2016.
| Year | Republican | Democratic | Third parties |
|---|---|---|---|
| 2016 | 57.5% 8,505 | 35.7% 5,281 | 6.8% 1,006 |
| 2012 | 51.7% 7,580 | 46.8% 6,856 | 1.6% 229 |
| 2008 | 46.9% 7,147 | 51.3% 7,817 | 1.8% 277 |
| 2004 | 55.6% 8,124 | 43.3% 6,333 | 1.1% 154 |
| 2000 | 54.3% 7,066 | 42.9% 5,579 | 2.9% 371 |
| 1996 | 41.4% 5,066 | 45.7% 5,597 | 13.0% 1,588 |
| 1992 | 39.0% 5,102 | 36.9% 4,829 | 24.1% 3,151 |
| 1988 | 59.6% 6,800 | 39.7% 4,531 | 0.7% 82 |
| 1984 | 67.8% 8,202 | 31.5% 3,803 | 0.7% 87 |
| 1980 | 58.1% 7,137 | 33.7% 4,134 | 8.2% 1,005 |
| 1976 | 59.2% 6,812 | 39.4% 4,541 | 1.4% 163 |
| 1972 | 63.6% 6,811 | 34.5% 3,697 | 1.9% 207 |
| 1968 | 54.0% 5,311 | 37.2% 3,660 | 8.8% 860 |
| 1964 | 39.0% 3,842 | 60.9% 5,993 | 0.1% 11 |
| 1960 | 58.2% 6,011 | 41.7% 4,305 | 0.1% 10 |
| 1956 | 65.2% 6,142 | 34.7% 3,274 | 0.1% 12 |
| 1952 | 64.7% 6,179 | 34.5% 3,298 | 0.9% 81 |
| 1948 | 56.0% 4,147 | 40.3% 2,988 | 3.7% 272 |
| 1944 | 58.3% 4,446 | 41.1% 3,137 | 0.6% 47 |
| 1940 | 55.6% 4,874 | 43.8% 3,836 | 0.6% 53 |
| 1936 | 39.4% 3,224 | 56.1% 4,598 | 4.5% 368 |
| 1932 | 42.5% 3,098 | 52.9% 3,854 | 4.7% 340 |
| 1928 | 72.7% 4,318 | 26.4% 1,567 | 0.9% 51 |
| 1924 | 67.2% 3,567 | 15.4% 815 | 17.5% 928 |
| 1920 | 69.4% 3,652 | 25.4% 1,338 | 5.2% 273 |
| 1916 | 53.2% 2,198 | 40.9% 1,689 | 6.0% 247 |
| 1912 | 21.5% 844 | 27.3% 1,073 | 51.2% 2,007 |
| 1908 | 65.7% 2,577 | 28.9% 1,132 | 5.4% 213 |
| 1904 | 72.1% 2,394 | 23.0% 764 | 4.9% 161 |
| 1900 | 61.3% 2,185 | 35.1% 1,251 | 3.6% 128 |
| 1896 | 56.3% 2,177 | 40.8% 1,580 | 2.9% 112 |
| 1892 | 45.9% 1,426 | 44.5% 1,383 | 9.7% 301 |
| 1888 | 50.8% 1,697 | 47.1% 1,573 | 2.1% 71 |
| 1884 | 50.5% 1,299 | 47.3% 1,217 | 2.2% 57 |
Mason County operates the county jail, maintains rural roads, operates the major local courts, records deeds, mortgages, and vital records, administers public health regulations, and participates with the state in the provision of social services. The county board of commissioners controls the budget and has limited authority to make laws or ordinances. In Michigan, most local government functions – police and fire, building and zoning, tax assessment, street maintenance etc. – are the responsibility of individual cities and townships.
Elected officials
- Prosecuting Attorney: Paul Spaniola
- Sheriff: Kim C. Cole
- County Clerk: Cheryl Kelly
- County Treasurer: Andrew Kmetz IV
- Register of Deeds: Diane L. Englebrecht
- Drain Commissioner: Dennis Dunlap
- County Surveyor: Rex Pope
- County Board of Commissioners by district:
- District 1: Nick Kreiger
- District 2: Gary Castonia
- District 3: Charles M. Lange
- District 4: Lewis G. Squires
- District 5: Steven K. Hull
- District 6: Janet S. Anderson (Chair)
- District 7: Ron Bacon
(information as of Nov 2017)
Communities

Cities
- Ludington (county seat)
- Scottville
Charter township
Civi townships
Unincorporated communities
Indian reservation
- The Little River Band of Ottawa Indians, a federally recognized Odawa Native American tribe, occupies a small reservation of approximately 740 acres (2.99 km2) within Custer Township.[16] The tribe also occupy another reservation within Brown Township just north in Manistee County.[17]
See also
| Wikimedia Commons has media related to Mason County, Michigan. |
- List of Michigan State Historic Sites in Mason County, Michigan
- Mason County Courthouse
- Mason County District Library
- National Register of Historic Places listings in Mason County, Michigan
References
- "Bibliography on Mason County". Clarke Historical Library, Central Michigan University. Retrieved January 20, 2013.
- "State & County QuickFacts". US Census Bureau. Retrieved August 28, 2013.
- "Find a County". National Association of Counties. Retrieved June 7, 2011.
- Newberry Library. "Michigan: Individual County Chronologies". Atlas of County Historical Boundaries. Retrieved November 4, 2016.
- "Focus on our history: How county was named". Ludington Daily News. October 3, 1987. p. 2. Retrieved April 30, 2015.
- Oceana County reports first coronavirus death, Mason County reports first case MLive.com, April 7, 2020
- "2010 Census Gazetteer Files". US Census Bureau. August 22, 2012. Retrieved September 27, 2014.
- Mason County MI Google Maps (accessed 25 September 2018)
- "Population and Housing Unit Estimates". Retrieved May 16, 2019.
- "US Decennial Census". US Census Bureau. Retrieved September 27, 2014.
- "Historical Census Browser". University of Virginia Library. Retrieved September 27, 2014.
- "Population of Counties by Decennial Census: 1900 to 1990". US Census Bureau. Retrieved September 27, 2014.
- "Census 2000 PHC-T-4. Ranking Tables for Counties: 1990 and 2000" (PDF). US Census Bureau. Retrieved September 27, 2014.
- "U.S. Census website". US Census Bureau. Retrieved January 31, 2008.
- US Election Atlas
- Braciszewski, Kevin (July 30, 2002). "Indian tribe emerges as major landowner". Retrieved April 12, 2020.
- "Michigan: 2010 Population and Housing Unit Counts 2010 Census of Population and Housing" (PDF). 2010 United States Census. United States Census Bureau. September 2012. p. E-14 Michigan. Retrieved April 12, 2020.
External links
- Mason County Press
- Ludington Daily News
- Mason County Website
- Mason County History Companion
- Mason County Michigan History and Directory
- Mason County Memories
- Great Lakes Maritime
- Carferry History
Places adjacent to Mason County, Michigan | ||||||||||
|---|---|---|---|---|---|---|---|---|---|---|
| ||||||||||
Municipalities and communities of Mason County, Michigan, United States | ||
|---|---|---|
| Cities | Map of Michigan highlighting Mason County.svg | |
| Villages | ||
| Charter township | ||
| Civil townships | ||
| Indian reservation | ||
| Footnotes | ‡This populated place also has portions in an adjacent county or counties | |
| Central cities | |||
|---|---|---|---|
| Counties |
| ||
| Geography | |||
| Transportation | |||
| Economy | |||
| |||
| Authority control |
|
|---|