Geography
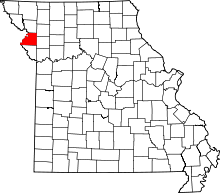
According to the U.S. Census Bureau, the county has a total area of 415 square miles (1,070 km2), of which 408 square miles (1,060 km2) is land and 6.6 square miles (17 km2) (1.6%) is water.[3]
Demographics
| Historical population |
| Census | Pop. | | %± |
| 1840 | 6,237 | | — |
| 1850 | 12,975 | | 108.0% |
| 1860 | 23,861 | | 83.9% |
| 1870 | 35,109 | | 47.1% |
| 1880 | 49,792 | | 41.8% |
| 1890 | 70,100 | | 40.8% |
| 1900 | 121,838 | | 73.8% |
| 1910 | 93,020 | | −23.7% |
| 1920 | 93,684 | | 0.7% |
| 1930 | 98,633 | | 5.3% |
| 1940 | 94,067 | | −4.6% |
| 1950 | 96,826 | | 2.9% |
| 1960 | 90,581 | | −6.4% |
| 1970 | 86,915 | | −4.0% |
| 1980 | 87,888 | | 1.1% |
| 1990 | 83,083 | | −5.5% |
| 2000 | 85,998 | | 3.5% |
| 2010 | 89,201 | | 3.7% |
| Est. 2016 | 88,938 | [4] | −0.3% |
U.S. Decennial Census[5]
1790-1960[6] 1900-1990[7]
1990-2000[8] 2010-2015[1] |
As of the census[9] of 2000, there were 85,998 people, 33,557 households, and 21,912 families residing in the county. The population density was 210 people per square mile (81/km²). There were 36,574 housing units at an average density of 89 per square mile (34/km²). The racial makeup of the county was 92.73% White, 4.36% Black or African American, 0.42% Native American, 0.45% Asian, 0.02% Pacific Islander, 0.65% from other races, and 1.37% from two or more races. Approximately 2.43% of the population were Hispanic or Latino of any race.
There were 33,557 households out of which 30.60% had children under the age of 18 living with them, 49.30% were married couples living together, 12.00% had a female householder with no husband present, and 34.70% were non-families. 28.90% of all households were made up of individuals and 12.50% had someone living alone who was 65 years of age or older. The average household size was 2.42 and the average family size was 2.98.
In the county, the population was spread out with 24.30% under the age of 18, 11.00% from 18 to 24, 28.50% from 25 to 44, 21.20% from 45 to 64, and 15.00% who were 65 years of age or older. The median age was 36 years. For every 100 females, there were 96.70 males. For every 100 females age 18 and over, there were 93.90 males.
The median income for a household in the county was $34,704, and the median income for a family was $42,408. Males had a median income of $31,697 versus $21,827 for females. The per capita income for the county was $17,882. About 8.50% of families and 12.20% of the population were below the poverty line, including 15.00% of those under age 18 and 9.60% of those age 65 or over.
Education
Public schools
- Buchanan County R-IV School District – De Kalb
- Rushville Elementary School (PK-06)
- De Kalb Junior/Senior High School (07-12)
- Mid-Buchanan County R-V School District – Faucett
- Mid-Buchanan County Elementary School (PK-06)
- Mid-Buchanan County High School (07-12)
- St. Joseph School District – St. Joseph
- Coleman Elementary School (K-06)
- Edison Elementary School (PK-06)
- Ellison Elementary School (K-06)
- Field Elementary School (K-06)
- Hall Elementary School (PK-06)
- Hosea Elementary School (PK-06)
- Humboldt Elementary School (PK-06)
- Hyde Elementary School (K-06)
- Lake Elementary School (PK-06)
- Lindbergh Elementary School (PK-06)
- Mark Twain Elementary School (K-06)
- Neely Elementary School (PK-06)
- Noyes Elementary School (PK-06)
- Parkway Elementary School (PK-06)
- Pershing Elementary School (K-06)
- Pickett Elementary School (PK-06)
- Skaith Elementary School (PK-06)
- Webster Elementary School (PK-06)
- Bode Middle School (07-08)
- Robidoux Middle School (07-08)
- Spring Garden Middle (07-08)
- Truman Middle School (07-08)
- Benton High School (09-12)
- Central High School (09-12)
- Lafayette High School (09-12)
Public libraries
- Rolling Hills Consolidated Library -- Belt Branch[10]
- Saint Joseph Public Library[11]
Politics
Local
The Democratic Party predominantly controls politics at the local level in Buchanan County. Democrats hold all but three of the elected positions in the county.
State
Past Gubernatorial Elections Results
| Year |
Republican |
Democratic |
Third Parties |
| 2016 |
52.60% 18,714 |
43.92% 15,628 |
3.48% 1.238 |
| 2012 |
39.61% 13,810 |
56.46% 19,685 |
3.92% 1,368 |
| 2008 |
37.39% 14,442 |
59.94% 23,151 |
2.67% 1,028 |
| 2004 |
50.03% 18,967 |
48.31% 18,317 |
1.66% 629 |
| 2000 |
45.18% 15,602 |
52.12% 17,998 |
2.70% 930 |
| 1996 |
29.76% 9,731 |
67.41% 22,045 |
2.83% 925 |
Buchanan County is divided into three legislative districts in the Missouri House of Representatives, two of which are held by Republicans and one by a Democrat.
Missouri House of Representatives - District 9 – Buchanan County (2016)
| Party |
Candidate |
Votes |
% |
± |
|
Republican |
Delus Johnson |
8,398 |
100.00% |
|
Missouri House of Representatives — District 9 — Buchanan County (2014)
| Party |
Candidate |
Votes |
% |
± |
|
Republican |
Delus Johnson |
5,165 |
100.00% |
|
Missouri House of Representatives — District 9 — Buchanan County (2012)
| Party |
Candidate |
Votes |
% |
± |
|
Republican |
Delus Johnson |
8,051 |
100.00% |
|
Missouri House of Representatives - District 10 – Buchanan County (2016)
| Party |
Candidate |
Votes |
% |
± |
|
Democratic |
Pat Conway |
9,950 |
100.00% |
|
Missouri House of Representatives — District 10 — Buchanan County (2014)
| Party |
Candidate |
Votes |
% |
± |
|
Democratic |
Pat Conway |
5,590 |
100.00% |
|
Missouri House of Representatives — District 10 — Buchanan County (2012)
| Party |
Candidate |
Votes |
% |
± |
|
Democratic |
Pat Conway |
10,244 |
100.00% |
|
Missouri House of Representatives — District 11 — Buchanan County (2016)
| Party |
Candidate |
Votes |
% |
± |
|
Republican |
Galen Wayne Higdon, Jr |
11,453 |
100.00% |
|
Missouri House of Representatives — District 11 — Buchanan County (2014)
| Party |
Candidate |
Votes |
% |
± |
|
Republican |
Galen Wayne Higdon, Jr |
6,062 |
100.00% |
|
Missouri House of Representatives — District 11 — Buchanan County (2012)
| Party |
Candidate |
Votes |
% |
± |
|
Republican |
Galen Wayne Higdon, Jr |
10,862 |
100.00% |
|
All of Buchanan County is a part of Missouri’s 34th District in the Missouri Senate and is currently represented by Rob Schaaf (R-St. Joseph).
Missouri Senate - District 34 – Buchanan County (2014)
| Party |
Candidate |
Votes |
% |
± |
|
Republican |
Rob Schaaf |
11,068 |
53.69% |
|
|
Democratic |
Robert Stuber |
9,936 |
46.31% |
|
Federal
U.S. Senate — Missouri — Buchanan County (2016)
| Party |
Candidate |
Votes |
% |
± |
|
Republican |
Roy Blunt |
17,658 |
49.60% |
+15.36 |
|
Democratic |
Jason Kander |
16,103 |
45.23% |
-13.50 |
|
Libertarian |
Jonathan Dine |
1,043 |
2.93% |
-4.10 |
|
Green |
Johnathan McFarland |
515 |
1.45% |
+1.45 |
|
Constitution |
Fred Ryman |
282 |
0.79% |
+0.79 |
U.S. Senate — Missouri — Buchanan County (2012)
| Party |
Candidate |
Votes |
% |
± |
|
Republican |
Todd Akin |
11,913 |
34.24% |
|
|
Democratic |
Claire McCaskill |
20,437 |
58.73% |
|
|
Libertarian |
Jonathan Dine |
2,446 |
7.03% |
|
All of Buchanan County is included in Missouri’s 6th Congressional District and is currently represented by Sam Graves (R-Tarkio) in the U.S. House of Representatives.
U.S. House of Representatives — Missouri’s 6th Congressional District — Buchanan County (2016)
| Party |
Candidate |
Votes |
% |
± |
|
Republican |
Sam Graves |
22,604 |
64.26% |
+10.56 |
|
Democratic |
David M. Blackwell |
11,196 |
31.83% |
-10.75 |
|
Libertarian |
Ross Lee Monchil |
878 |
2.50% |
-1.22 |
|
Green |
Mike Diel |
496 |
1.41% |
+1.41 |
U.S. House of Representatives — Missouri's 6th Congressional District — Buchanan County (2014)
| Party |
Candidate |
Votes |
% |
± |
|
Republican |
Sam Graves |
11,344 |
53.70% |
-7.48 |
|
Democratic |
Bill Hedge |
8,996 |
42.58% |
+6.49 |
|
Libertarian |
Russ Lee Monchil |
785 |
3.72% |
-0.99 |
U.S. Representatives — Missouri's 6th Congressional District — Buchanan County (2012)
| Party |
Candidate |
Votes |
% |
± |
|
Republican |
Sam Graves |
21,141 |
61.18% |
|
|
Democratic |
Kyle Yarber |
12,472 |
36.09% |
|
|
Libertarian |
Russ Lee Monchil |
944 |
2.73% |
|
Presidential elections results
Presidential elections results[12]
| Year |
Republican |
Democratic |
Third parties |
| 2016 |
59.3% 21,320 |
33.4% 12,013 |
7.3% 2,631 |
| 2012 |
53.2% 18,660 |
44.4% 15,594 |
2.4% 852 |
| 2008 |
48.7% 19,110 |
48.8% 19,164 |
2.5% 986 |
| 2004 |
52.2% 19,812 |
46.9% 17,799 |
0.9% 339 |
| 2000 |
47.3% 16,423 |
49.2% 17,085 |
3.6% 1,243 |
| 1996 |
38.2% 12,610 |
48.0% 15,848 |
13.8% 4,560 |
| 1992 |
30.2% 11,275 |
44.4% 16,570 |
25.5% 9,520 |
| 1988 |
45.0% 15,336 |
54.6% 18,601 |
0.5% 152 |
| 1984 |
56.2% 19,735 |
43.8% 15,369 |
|
| 1980 |
47.1% 16,551 |
48.3% 16,967 |
4.6% 1,632 |
| 1976 |
48.2% 16,446 |
51.1% 17,427 |
0.7% 251 |
| 1972 |
65.7% 21,850 |
34.3% 11,395 |
|
| 1968 |
46.4% 16,101 |
45.7% 15,860 |
7.9% 2,752 |
| 1964 |
32.3% 11,501 |
67.8% 24,164 |
|
| 1960 |
52.6% 21,448 |
47.4% 19,348 |
|
| 1956 |
52.5% 20,311 |
47.5% 18,384 |
|
| 1952 |
52.6% 22,087 |
47.3% 19,854 |
0.1% 44 |
| 1948 |
36.1% 13,002 |
63.8% 22,975 |
0.2% 57 |
| 1944 |
42.9% 15,113 |
57.0% 20,091 |
0.1% 20 |
| 1940 |
41.6% 17,484 |
58.3% 24,482 |
0.1% 29 |
| 1936 |
35.4% 15,912 |
64.2% 28,825 |
0.4% 196 |
| 1932 |
35.7% 14,602 |
63.7% 26,060 |
0.6% 260 |
| 1928 |
62.7% 20,459 |
37.1% 12,110 |
0.2% 55 |
| 1924 |
50.1% 17,509 |
42.3% 14,759 |
7.6% 2,658 |
| 1920 |
51.0% 17,191 |
48.0% 16,188 |
1.0% 335 |
| 1916 |
40.6% 7,761 |
57.4% 10,973 |
2.1% 400 |
| 1912 |
26.5% 4,412 |
53.2% 8,869 |
20.4% 3,395 |
| 1908 |
45.3% 8,394 |
53.1% 9,836 |
1.5% 283 |
| 1904 |
51.6% 8,703 |
45.9% 7,736 |
2.5% 420 |
| 1900 |
47.5% 8,329 |
50.9% 8,925 |
1.6% 278 |
| 1896 |
47.8% 6,854 |
51.2% 7,336 |
1.0% 147 |
| 1892 |
42.9% 5,522 |
54.0% 6,949 |
3.1% 401 |
| 1888 |
43.2% 5,011 |
54.9% 6,369 |
1.9% 219 |
Missouri Presidential Preference Primary (2008)
- Former U.S. Senator Hillary Clinton (D-New York) received more votes, a total of 6,689, than any candidate from either party in Buchanan County during the 2008 presidential primary.
Communities
Unincorporated communities
Townships
Buchanan County is divided into 12 townships:
References
- 1 2 "State & County QuickFacts". United States Census Bureau. Retrieved September 7, 2013.
- ↑ "Find a County". National Association of Counties. Archived from the original on 2011-05-31. Retrieved 2011-06-07.
- ↑ "2010 Census Gazetteer Files". United States Census Bureau. August 22, 2012. Archived from the original on October 21, 2013. Retrieved November 13, 2014.
- ↑ "Population and Housing Unit Estimates". Retrieved June 9, 2017.
- ↑ "U.S. Decennial Census". United States Census Bureau. Archived from the original on May 12, 2015. Retrieved November 13, 2014.
- ↑ "Historical Census Browser". University of Virginia Library. Retrieved November 13, 2014.
- ↑ "Population of Counties by Decennial Census: 1900 to 1990". United States Census Bureau. Retrieved November 13, 2014.
- ↑ "Census 2000 PHC-T-4. Ranking Tables for Counties: 1990 and 2000" (PDF). United States Census Bureau. Retrieved November 13, 2014.
- ↑ "American FactFinder". United States Census Bureau. Archived from the original on 2013-09-11. Retrieved 2011-05-14.
- ↑ Breeding, Marshall. "Rolling Hills Consolidated Library -- Belt Branc". Libraries.org. Retrieved May 8, 2017.
- ↑ Breeding, Marshall. "Saint Joseph Public Library". Libraries.org. Retrieved May 8, 2017.
- ↑ Leip, David. "Dave Leip's Atlas of U.S. Presidential Elections". uselectionatlas.org. Retrieved 2018-03-24.