Geography
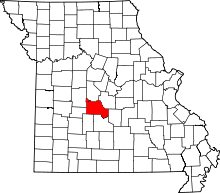
According to the U.S. Census Bureau, the county has a total area of 709 square miles (1,840 km2), of which 656 square miles (1,700 km2) is land and 53 square miles (140 km2) (7.4%) is water.[5]
Fire Towers
Fire Towers Include:
Demographics
| Historical population |
| Census | Pop. | | %± |
| 1850 | 2,338 | | — |
| 1860 | 4,975 | | 112.8% |
| 1870 | 6,108 | | 22.8% |
| 1880 | 7,266 | | 19.0% |
| 1890 | 10,040 | | 38.2% |
| 1900 | 13,113 | | 30.6% |
| 1910 | 11,582 | | −11.7% |
| 1920 | 10,474 | | −9.6% |
| 1930 | 9,142 | | −12.7% |
| 1940 | 8,971 | | −1.9% |
| 1950 | 7,861 | | −12.4% |
| 1960 | 9,116 | | 16.0% |
| 1970 | 13,315 | | 46.1% |
| 1980 | 20,017 | | 50.3% |
| 1990 | 27,495 | | 37.4% |
| 2000 | 37,051 | | 34.8% |
| 2010 | 44,002 | | 18.8% |
| Est. 2017 | 45,632 | [6] | 3.7% |
U.S. Decennial Census[7]
1790-1960[8] 1900-1990[9]
1990-2000[10] 2010-2015[1] |
As of the census[11] of 2000, there were 37,051 people, 15,779 households, and 11,297 families residing in the county. The population density was 57 people per square mile (22/km²). There were 33,470 housing units at an average density of 51 per square mile (20/km²). The racial makeup of the county was 97.68% White, 0.26% Black or African American, 0.49% Native American, 0.29% Asian, 0.04% Pacific Islander, 0.22% from other races, and 1.03% from two or more races. Approximately 0.93% of the population were Hispanic or Latino of any race.
There were 15,779 households out of which 23.80% had children under the age of 18 living with them, 61.80% were married couples living together, 6.60% had a female householder with no husband present, and 28.40% were non-families. 23.30% of all households were made up of individuals and 9.50% had someone living alone who was 65 years of age or older. The average household size was 2.31 and the average family size was 2.68.
In the county, the population was spread out with 20.30% under the age of 18, 6.10% from 18 to 24, 23.30% from 25 to 44, 31.40% from 45 to 64, and 19.00% who were 65 years of age or older. The median age was 45 years. For every 100 females there were 100.00 males. For every 100 females age 18 and over, there were 97.50 males.
The median income for a household in the county was $35,840, and the median income for a family was $40,695. Males had a median income of $28,020 versus $20,825 for females. The per capita income for the county was $20,197. About 8.00% of families and 11.40% of the population were below the poverty line, including 17.00% of those under age 18 and 7.70% of those age 65 or over.
Education
Public libraries
- Camden County Library District[12]
Politics
Local
The Republican Party predominantly controls politics at the local level in Camden County. Republicans hold all but one of the elected positions in the county.
State
Past Gubernatorial Elections Results
| Year |
Republican |
Democratic |
Third Parties |
| 2016 |
67.09% 15,050 |
29.80% 6,686 |
3.11% 698 |
| 2012 |
54.91% 11,986 |
42.19% 9,210 |
2.90% 632 |
| 2008 |
48.79% 10,716 |
49.15% 10,795 |
2.06% 453 |
| 2004 |
61.18% 11,956 |
37.87% 7,401 |
0.95% 184 |
| 2000 |
56.24% 9,555 |
41.55% 7,059 |
2.21% 376 |
| 1996 |
50.25% 7,385 |
46.34% 6,810 |
3.42% 502 |
Camden County is divided into two legislative districts that elect members of the Missouri House of Representatives, both of which are represented by Republicans.
- District 123 — Diane Franklin (R-Camdenton). Consists of the southern half of the county, including the communities of Camdenton, Linn Creek, Macks Creek, Montreal, Richland, Roach, and Stoutland.
Missouri House of Representatives — District 123 — Camden County (2016)[13]
| Party |
Candidate |
Votes |
% |
± |
|
Republican |
Diane Franklin |
9,753 |
100.00% |
|
Missouri House of Representatives — District 123 — Camden County (2014)
| Party |
Candidate |
Votes |
% |
± |
|
Republican |
Diane Franklin |
4,173 |
100.00% |
|
Missouri House of Representatives — District 123 — Camden County (2012)
| Party |
Candidate |
Votes |
% |
± |
|
Republican |
Diane Franklin |
9,014 |
100.00% |
|
- District 124 — Rocky Miller (R-Lake Ozark). Consists of the northern half of the county, including the communities of Climax Springs, Lake Ozark, Osage Beach, Sunrise Beach, and Village of Four Seasons.
Missouri House of Representatives — District 124 — Camden County (2016)[13]
| Party |
Candidate |
Votes |
% |
± |
|
Republican |
Rocky Miller |
9,689 |
100.00% |
|
Missouri House of Representatives — District 124 — Camden County (2014)
| Party |
Candidate |
Votes |
% |
± |
|
Republican |
Rocky Miller |
4,853 |
100.00% |
|
Missouri House of Representatives — District 124 — Camden County (2012)
| Party |
Candidate |
Votes |
% |
± |
|
Republican |
Rocky Miller |
9,661 |
100.00% |
|
All of Camden County is a part of Missouri’s 16th District in the Missouri Senate and is currently represented by Dan Brown (R-Rolla).
Missouri Senate — District 16 — Camden County (2014)
| Party |
Candidate |
Votes |
% |
± |
|
Republican |
Dan Brown |
8,760 |
100.00% |
|
Federal
U.S. Senate — Missouri — Camden County (2016)[13]
| Party |
Candidate |
Votes |
% |
± |
|
Republican |
Roy Blunt |
14,434 |
64.36% |
+14.57 |
|
Democratic |
Jason Kander |
6,995 |
31.19% |
-11.78 |
|
Libertarian |
Jonathan Dine |
580 |
2.59% |
-4.63 |
|
Green |
Johnathan McFarland |
208 |
0.93% |
+0.93 |
|
Constitution |
Fred Ryman |
210 |
0.94% |
+0.94 |
U.S. Senate — Missouri — Camden County (2012)
| Party |
Candidate |
Votes |
% |
± |
|
Republican |
Todd Akin |
10,883 |
49.79% |
|
|
Democratic |
Claire McCaskill |
9,391 |
42.97% |
|
|
Libertarian |
Jonathan Dine |
1,579 |
7.22% |
|
|
Write-in |
Write-ins |
4 |
0.02% |
|
Most of Camden County is included in Missouri's 3rd Congressional District and is currently represented by Blaine Luetkemeyer (R-St. Elizabeth) in the U.S. House of Representatives.
U.S. House of Representatives — Missouri's 3rd Congressional District — Camden County (2016)[13]
| Party |
Candidate |
Votes |
% |
± |
|
Republican |
Blaine Luetkemeyer |
10,098 |
75.72% |
-1.62 |
|
Democratic |
Kevin Miller |
2,794 |
20.95% |
+2.02 |
|
Libertarian |
Dan Hogan |
353 |
2.65% |
-1.08 |
|
Constitution |
Doanita Simmons |
91 |
0.68% |
+0.68 |
U.S. House of Representatives — Missouri's 3rd Congressional District — Camden County (2014)
| Party |
Candidate |
Votes |
% |
± |
|
Republican |
Blaine Luetkemeyer |
4,826 |
77.34% |
+6.90 |
|
Democratic |
Courtney Denton |
1,181 |
18.93% |
-7.06 |
|
Libertarian |
Steven Hedrick |
233 |
3.73% |
+0.16 |
U.S. House of Representatives — Missouri's 3rd Congressional District — Camden County (2012)
| Party |
Candidate |
Votes |
% |
± |
|
Republican |
Blaine Luetkemeyer |
8,889 |
70.44% |
|
|
Democratic |
Eric C. Mayer |
3,280 |
25.99% |
|
|
Libertarian |
Steven Wilson |
450 |
3.57% |
|
Part of Camden County is included in Missouri’s 4th Congressional District and is currently represented by Vicky Hartzler (R-Harrisonville) in the U.S. House of Representatives.
U.S. House of Representatives — Missouri’s 4th Congressional District — Camden County (2016)[13]
| Party |
Candidate |
Votes |
% |
± |
|
Republican |
Vicky Hartzler |
6,642 |
76.68% |
+0.47 |
|
Democratic |
Gordon Christensen |
1,705 |
19.68% |
-0.22 |
|
Libertarian |
Mark Bliss |
315 |
3.64% |
-0.25 |
U.S. House of Representatives — Missouri's 4th Congressional District — Camden County (2014)
| Party |
Candidate |
Votes |
% |
± |
|
Republican |
Vicky Hartzler |
3,409 |
76.21% |
+5.42 |
|
Democratic |
Nate Irvin |
890 |
19.90% |
-6.17 |
|
Libertarian |
Herschel L. Young |
174 |
3.89% |
+1.66 |
U.S. House of Representatives — Missouri's 4th Congressional District — Camden County (2012)
| Party |
Candidate |
Votes |
% |
± |
|
Republican |
Vicky Hartzler |
6,179 |
70.79% |
|
|
Democratic |
Teresa Hensley |
2,276 |
26.07% |
|
|
Libertarian |
Thomas Holbrook |
195 |
2.23% |
|
|
Constitution |
Greg Cowan |
79 |
0.91% |
|
Political culture
Presidential elections results
Presidential elections results[14]
| Year |
Republican |
Democratic |
Third parties |
| 2016 |
74.7% 16,944 |
21.0% 4,768 |
4.3% 968 |
| 2012 |
68.6% 15,092 |
29.3% 6,458 |
2.1% 465 |
| 2008 |
63.4% 14,074 |
35.0% 7,773 |
1.6% 350 |
| 2004 |
67.2% 13,122 |
32.3% 6,296 |
0.5% 101 |
| 2000 |
60.6% 10,358 |
37.0% 6,323 |
2.5% 418 |
| 1996 |
48.9% 7,190 |
37.9% 5,566 |
13.2% 1,938 |
| 1992 |
38.0% 5,554 |
35.1% 5,140 |
26.9% 3,933 |
| 1988 |
66.1% 7,773 |
33.4% 3,930 |
0.5% 56 |
| 1984 |
72.3% 8,057 |
27.7% 3,088 |
|
| 1980 |
63.8% 6,541 |
33.3% 3,416 |
2.8% 289 |
| 1976 |
52.5% 4,469 |
46.7% 3,975 |
0.8% 66 |
| 1972 |
73.9% 4,996 |
26.1% 1,761 |
|
| 1968 |
61.0% 3,500 |
28.0% 1,605 |
11.0% 633 |
| 1964 |
50.8% 2,607 |
49.2% 2,522 |
|
| 1960 |
66.6% 3,509 |
33.4% 1,759 |
|
| 1956 |
65.9% 2,817 |
34.1% 1,460 |
|
| 1952 |
69.3% 2,789 |
30.5% 1,226 |
0.3% 10 |
| 1948 |
61.4% 2,020 |
38.4% 1,264 |
0.2% 7 |
| 1944 |
68.7% 2,180 |
31.2% 990 |
0.2% 5 |
| 1940 |
63.4% 2,692 |
36.5% 1,549 |
0.1% 5 |
| 1936 |
54.4% 2,281 |
45.5% 1,908 |
0.1% 6 |
| 1932 |
45.2% 1,497 |
54.4% 1,801 |
0.5% 15 |
| 1928 |
77.4% 2,085 |
22.5% 606 |
0.2% 4 |
| 1924 |
57.1% 1,732 |
39.5% 1,196 |
3.4% 103 |
| 1920 |
68.0% 2,276 |
30.9% 1,034 |
1.2% 39 |
| 1916 |
56.2% 1,261 |
41.4% 930 |
2.4% 54 |
| 1912 |
49.1% 918 |
35.7% 667 |
15.2% 284 |
| 1908 |
58.9% 1,446 |
38.9% 955 |
2.2% 54 |
| 1904 |
60.2% 1,466 |
36.3% 883 |
3.5% 85 |
| 1900 |
58.1% 1,511 |
41.5% 1,078 |
0.4% 10 |
| 1896 |
50.4% 1,326 |
48.9% 1,287 |
0.7% 18 |
| 1892 |
54.0% 1,070 |
30.4% 602 |
15.6% 310 |
| 1888 |
54.0% 1,056 |
34.5% 675 |
11.5% 225 |
Missouri presidential preference primary (2008)
- Former U.S. Senator Hillary Clinton (D-New York) received more votes, a total of 2,794, than any candidate from either party in Camden County during the 2008 presidential primary.
Communities
Other unincorporated places
References
- 1 2 "State & County QuickFacts". United States Census Bureau. Retrieved September 7, 2013.
- ↑ "Find a County". National Association of Counties. Archived from the original on 2011-05-31. Retrieved 2011-06-07.
- ↑ Eaton, David Wolfe (1916). How Missouri Counties, Towns and Streams Were Named. The State Historical Society of Missouri. p. 268.
- ↑ "Disappearing Missouri Names". The Kansas City Star. March 19, 1911. p. 15. Retrieved August 15, 2014 – via Newspapers.com.

- ↑ "2010 Census Gazetteer Files". United States Census Bureau. August 22, 2012. Archived from the original on October 21, 2013. Retrieved November 14, 2014.
- ↑ "Population and Housing Unit Estimates". Retrieved June 9, 2017.
- ↑ "U.S. Decennial Census". United States Census Bureau. Archived from the original on May 12, 2015. Retrieved November 14, 2014.
- ↑ "Historical Census Browser". University of Virginia Library. Retrieved November 14, 2014.
- ↑ "Population of Counties by Decennial Census: 1900 to 1990". United States Census Bureau. Retrieved November 14, 2014.
- ↑ "Census 2000 PHC-T-4. Ranking Tables for Counties: 1990 and 2000" (PDF). United States Census Bureau. Retrieved November 14, 2014.
- ↑ "American FactFinder". United States Census Bureau. Archived from the original on 2013-09-11. Retrieved 2011-05-14.
- ↑ Breeding, Marshall. "Camden County Library District". Libraries.org. Retrieved May 8, 2017.
- 1 2 3 4 5 "County Results - State of Missouri - 2016 General Election - November 8, 2016 - Official Results". Missouri Secretary of State. December 12, 2016. Retrieved April 29, 2017.
- ↑ Leip, David. "Dave Leip's Atlas of U.S. Presidential Elections". uselectionatlas.org. Retrieved 2018-03-24.
Further reading
- History of Laclede, Camden, Dallas, Webster, Wright, Texas, Pulaski, Phelps, and Dent counties, Missouri (1889) full text