Geography
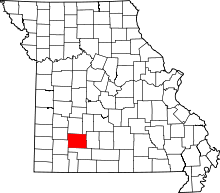
According to the U.S. Census Bureau, the county has a total area of 678 square miles (1,760 km2), of which 675 square miles (1,750 km2) is land and 2.6 square miles (6.7 km2) (0.4%) is water.[4]
Demographics
| Historical population |
| Census | Pop. | | %± |
| 1840 | 5,372 | | — |
| 1850 | 12,785 | | 138.0% |
| 1860 | 13,186 | | 3.1% |
| 1870 | 21,549 | | 63.4% |
| 1880 | 28,801 | | 33.7% |
| 1890 | 48,616 | | 68.8% |
| 1900 | 52,713 | | 8.4% |
| 1910 | 63,831 | | 21.1% |
| 1920 | 68,698 | | 7.6% |
| 1930 | 82,929 | | 20.7% |
| 1940 | 90,541 | | 9.2% |
| 1950 | 104,923 | | 15.9% |
| 1960 | 126,276 | | 20.4% |
| 1970 | 152,929 | | 21.1% |
| 1980 | 185,302 | | 21.2% |
| 1990 | 207,949 | | 12.2% |
| 2000 | 240,391 | | 15.6% |
| 2010 | 275,174 | | 14.5% |
| Est. 2017 | 289,805 | [5] | 5.3% |
U.S. Decennial Census[6]
1790-1960[7] 1900-1990[8]
1990-2000[9] 2010-2015[1] |
As of the census[10] of 2000, there were 240,391 people, 97,859 households, and 61,846 families residing in the county. The population density was 356 people per square mile (138/km²). There were 104,517 housing units at an average density of 155 per square mile (60/km²). The racial makeup of the county was 93.54% White, 2.26% Black or African American, 0.66% Native American, 1.13% Asian, 0.06% Pacific Islander, 0.67% from other races, and 1.68% from two or more races. Approximately 1.84% of the population were Hispanic or Latino of any race.
There were 97,859 households out of which 28.30% had children under the age of 18 living with them, 50.00% were married couples living together, 9.80% had a female householder with no husband present, and 36.80% were non-families. 29.10% of all households were made up of individuals and 9.70% had someone living alone who was 65 years of age or older. The average household size was 2.34 and the average family size was 2.89.
In the county, the population was spread out with 22.30% under the age of 18, 13.80% from 18 to 24, 28.60% from 25 to 44, 21.80% from 45 to 64, and 13.60% who were 65 years of age or older. The median age was 35 years. For every 100 females, there were 94.40 males. For every 100 females age 18 and over, there were 91.20 males.
The median income for a household in the county was $44,185, and the median income for a family was $56,047. Males had a median income of $30,672 versus $21,987 for females. The per capita income for the county was $25,770. About 7.60% of families and 12.10% of the population were below the poverty line, including 13.60% of those under age 18 and 7.50% of those age 65 or over.
There are 190,417 registered voters in Greene County.[11]
Emergency services
Republic and Springfield have city fire departments. Additionally, the county is served by the following fire districts:
- Ash Grove
- Battlefield
- Billings
- Brookline
- Ebenezer
- Fair Grove
- Logan-Rogersville
- Strafford
- Walnut Grove
- West Republic
- Willard
Politics
Local
The Republican Party predominantly controls politics at the local level in Greene County.
State
Past Gubernatorial Elections Results
| Year |
Republican |
Democratic |
Third Parties |
| 2016 |
56.77% 73,601 |
39,49% 51,201 |
3.73% 4,841 |
| 2012 |
47.62% 59,660 |
49.46% 61,970 |
2.92% 3,659 |
| 2008 |
42.84% 57,565 |
54.45% 73,164 |
2.71% 3,641 |
| 2004 |
61.45% 76,645 |
37.25% 46,470 |
1.30% 1,621 |
| 2000 |
53.57% 54,770 |
44.61% 45,612 |
1.82% 1,861 |
| 1996 |
51.63% 49,991 |
45.08% 43,646 |
3.29% 3,189 |
Greene County is divided into eight legislative districts in the Missouri House of Representatives; seven of which are held by Republicans and one Democratic seat.
- District 130 — Jeff Messenger (R-Republic). Consists of all of the communities of Ash Grove, Bois D'Arc, Brookline, Republic, Willard, and a very small sliver of the city of Springfield.
Missouri House of Representatives — District 130 — Greene County (2016)[12]
| Party |
Candidate |
Votes |
% |
± |
|
Republican |
Jeff Messenger |
14,247 |
79.11% |
-20.89 |
|
Democratic |
Ella Jane Goeppinger |
3,762 |
20.89% |
+20.89 |
Missouri House of Representatives — District 130 — Greene County (2014)[13]
| Party |
Candidate |
Votes |
% |
± |
|
Republican |
Jeff Messenger |
7,598 |
100.00% |
+18.58 |
Missouri House of Representatives — District 130 — Greene County (2012)[14]
| Party |
Candidate |
Votes |
% |
± |
|
Republican |
Jeff Messenger |
13,188 |
81.42% |
|
|
Libertarian |
Jake Wilburn |
3,009 |
18.58% |
|
- District 131 — Sonya Anderson (R-Springfield). The district includes the northern part the city of Springfield and rural area of north-central Greene County.
Missouri House of Representatives — District 131 — Greene County (2016)[12]
| Party |
Candidate |
Votes |
% |
± |
|
Republican |
Sonya Murray Anderson |
10,267 |
67.77% |
-5.15 |
|
Democratic |
Nate Branscom |
4,148 |
27.38% |
+0.30 |
|
Libertarian |
Arthur Hodge Sr. |
735 |
4.85% |
+4.85 |
Missouri House of Representatives — District 131 — Greene County (2014)[13]
| Party |
Candidate |
Votes |
% |
± |
|
Republican |
Sonya Murray Anderson |
5,578 |
72.92% |
-72.92 |
|
Democratic |
Marlee Yant |
2,072 |
27.08% |
+27.08 |
Missouri House of Representatives - District 131 - Greene County (2012)[14]
| Party |
Candidate |
Votes |
% |
± |
|
Republican |
Sonya Anderson |
13,279 |
100.00% |
|
Missouri House of Representatives — District 132 — Greene County (2016)[12]
| Party |
Candidate |
Votes |
% |
± |
|
Democratic |
Crystal Quade |
5,215 |
52.26% |
-3.96 |
|
Republican |
Thomas Quinn |
4,243 |
42.52% |
-1.26 |
|
Libertarian |
Chris Burros |
521 |
5.22% |
+5.22 |
Missouri House of Representatives — District 132 — Greene County (2014)[13]
| Party |
Candidate |
Votes |
% |
± |
|
Democratic |
Charlie Norr |
2,100 |
56.22% |
+2.13 |
|
Republican |
Fred Elison |
1,635 |
43.78% |
-2.13 |
Missouri House of Representatives — District 132 — Greene County (2012)[14]
| Party |
Candidate |
Votes |
% |
± |
|
Democratic |
Charlie Norr |
5,203 |
54.09% |
|
|
Republican |
Melissa Leach |
4,416 |
45.91% |
|
- District 133 — Curtis Trent (R-Springfield). The district includes Battlefield and a part of the city of Springfield.
Missouri House of Representatives — District 133 — Greene County (2016)[12]
| Party |
Candidate |
Votes |
% |
± |
|
Republican |
Curtis D. Trent |
12,368 |
68.30% |
-32.70 |
|
Democratic |
Jim Clemmons |
5,741 |
32.70% |
+32.70 |
Missouri House of Representatives — District 133 — Greene County (2014)[13]
| Party |
Candidate |
Votes |
% |
± |
|
Republican |
Eric Burlison |
7,047 |
100.00% |
+29.51 |
Missouri House of Representatives — District 133 — Greene County (2012)[14]
| Party |
Candidate |
Votes |
% |
± |
|
Republican |
Eric Burlison |
11,878 |
70.49% |
|
|
Democratic |
Nicholas Landendorf |
4,972 |
29.51% |
|
Missouri House of Representatives — District 134 — Greene County (2016)[12]
| Party |
Candidate |
Votes |
% |
± |
|
Republican |
Elijah Haahr |
9,901 |
58.40% |
-5.79 |
|
Democratic |
Angela Dowler Pryor |
6,313 |
37.23% |
+1.42 |
|
Libertarian |
Daniel A. Romine |
741 |
4.37% |
+4.37 |
Missouri House of Representatives — District 134 — Greene County (2014)[13]
| Party |
Candidate |
Votes |
% |
± |
|
Republican |
Elijah Haahr |
5,214 |
64.19% |
+8.15 |
|
Democratic |
Kevin Knox |
2,909 |
35.81% |
-8.15 |
Missouri House of Representatives - District 134 - Greene County (2012)[14]
| Party |
Candidate |
Votes |
% |
± |
|
Republican |
Elijah Haahr |
9,227 |
56.04% |
|
|
Democratic |
James Owen |
7,239 |
43.96% |
|
Missouri House of Representatives — District 135 — Greene County (2016)[12]
| Party |
Candidate |
Votes |
% |
± |
|
Republican |
Steve Helms |
8,187 |
50.38% |
-7.54 |
|
Democratic |
Randy Alberhasky |
7,177 |
44.16% |
+2.08 |
|
Libertarian |
David Carr |
887 |
5.46% |
+5.46 |
Missouri House of Representatives — District 135 — Greene County (2014)[13]
| Party |
Candidate |
Votes |
% |
± |
|
Republican |
Lincoln Hough |
4,698 |
57.92% |
+2.93 |
|
Democratic |
Angie Filbeck |
3,413 |
42.08% |
-2.93 |
Missouri House of Representatives — District 135 — Greene County (2012)[14]
| Party |
Candidate |
Votes |
% |
± |
|
Republican |
Lincoln Hough |
8,932 |
54.99% |
|
|
Democratic |
Casey Clark |
7,310 |
45.01% |
|
- District 136 — Kevin Austin (R-Springfield). The district includes of the city of Springfield and some rural area southeast of the city.
Missouri House of Representatives — District 136 — Greene County (2016)[12]
| Party |
Candidate |
Votes |
% |
± |
|
Republican |
Kevin Austin |
13,581 |
62.31% |
-37.69 |
|
Democratic |
Jeff Munzinger |
8,214 |
37.69% |
+37.69 |
Missouri House of Representatives — District 136 — Greene County (2014)[13]
| Party |
Candidate |
Votes |
% |
± |
|
Republican |
Kevin Austin |
9,808 |
100.00% |
|
Missouri House of Representatives — District 136 — Greene County (2012)[14]
| Party |
Candidate |
Votes |
% |
± |
|
Republican |
Kevin Austin |
17,648 |
100.00% |
|
- District 137 — Lyndall Fraker (R-Marshfield). The district includes the communities of Fair Grove, Rogersville, and Strafford.
Missouri House of Representatives — District 137 — Greene County (2016)[12]
| Party |
Candidate |
Votes |
% |
± |
|
Republican |
Lyndall Fraker |
9,503 |
100.00% |
+30.15 |
Missouri House of Representatives — District 137 — Greene County (2014)[13]
| Party |
Candidate |
Votes |
% |
± |
|
Republican |
Lyndall Fraker |
3,876 |
69.85% |
-10.58 |
|
Democratic |
Sandy Grogan |
1,418 |
25.55% |
+25.55 |
|
Libertarian |
Bill Boone |
255 |
4.60% |
-14.97 |
Missouri House of Representatives — District 137 — Greene County (2012)[14]
| Party |
Candidate |
Votes |
% |
± |
|
Republican |
Lyndall Fraker |
7,408 |
80.43% |
|
|
Libertarian |
Bill Boone |
1,802 |
19.57% |
|
Greene County is also divided into two districts in the Missouri Senate, both of which represented by Republicans.
Missouri Senate — District 20 — Greene County (2014)[13]
| Party |
Candidate |
Votes |
% |
± |
|
Republican |
Jay Wasson |
23,796 |
100.00% |
|
Missouri Senate — District 30 — Greene County (2014)[13]
| Party |
Candidate |
Votes |
% |
± |
|
Republican |
Bob Dixon |
27,207 |
100.00% |
|
Federal
U.S. Senate — Missouri — Greene County (2016)[12]
| Party |
Candidate |
Votes |
% |
± |
|
Republican |
Roy Blunt |
72,993 |
56.22% |
+11.79 |
|
Democratic |
Jason Kander |
50,967 |
39.26% |
-8.92 |
|
Libertarian |
Jonathan Dine |
3,626 |
2.79% |
-4.60 |
|
Green |
Johnathan McFarland |
1,256 |
0.97% |
+0.97 |
|
Constitution |
Fred Ryman |
978 |
0.75% |
+0.75 |
|
Write-in |
Write-ins |
7 |
0.01% |
+0.01 |
All of Greene County is included in Missouri's 7th Congressional District and is currently represented by Billy Long (R-Springfield) in the U.S. House of Representatives.
U.S. House of Representatives — Missouri's 7th Congressional District — Greene County (2016)[12]
| Party |
Candidate |
Votes |
% |
± |
|
Republican |
Billy Long |
74,876 |
58.57% |
+4.75 |
|
Democratic |
Genevieve Williams |
45,382 |
35.50% |
-2.19 |
|
Libertarian |
Benjamin T. Brixey |
7,580 |
5.93% |
-2.56 |
U.S. House of Representatives — Missouri's 7th Congressional District — Greene County (2014)[13]
| Party |
Candidate |
Votes |
% |
± |
|
Republican |
Billy Long |
33,738 |
53.82% |
-3.08 |
|
Democratic |
Jim Evans |
23,624 |
37.69% |
+0.14 |
|
Libertarian |
Kevin Craig |
5,323 |
8.49% |
+2.94 |
U.S. House of Representatives — Missour's 7th Congressional District — Greene County (2012)[14]
| Party |
Candidate |
Votes |
% |
± |
|
Republican |
Billy Long |
70,212 |
56.90% |
|
|
Democratic |
Jim Evans |
46,331 |
37.55% |
|
|
Libertarian |
Kevin Craig |
6,850 |
5.55% |
|
Political culture
Presidential elections results
Presidential elections results[15]
| Year |
Republican |
Democratic |
Third parties |
| 2016 |
59.8% 78,035 |
32.7% 42,728 |
7.5% 9,760 |
| 2012 |
60.8% 76,900 |
36.6% 46,219 |
2.6% 3,300 |
| 2008 |
57.1% 77,683 |
41.3% 56,181 |
1.7% 2,283 |
| 2004 |
62.2% 77,885 |
37.3% 46,657 |
0.6% 724 |
| 2000 |
57.5% 59,178 |
39.9% 41,091 |
2.6% 2,657 |
| 1996 |
49.6% 48,193 |
40.5% 39,300 |
10.0% 9,671 |
| 1992 |
44.0% 46,457 |
38.9% 41,137 |
17.1% 18,119 |
| 1988 |
59.4% 52,211 |
40.3% 35,475 |
0.3% 267 |
| 1984 |
67.2% 57,250 |
32.8% 27,965 |
|
| 1980 |
55.7% 43,116 |
39.4% 30,498 |
4.9% 3,811 |
| 1976 |
52.2% 37,691 |
46.8% 33,824 |
1.0% 690 |
| 1972 |
70.6% 48,348 |
29.4% 20,155 |
|
| 1968 |
55.3% 32,638 |
33.3% 19,659 |
11.4% 6,751 |
| 1964 |
44.3% 23,989 |
55.7% 30,130 |
|
| 1960 |
64.4% 36,943 |
35.6% 20,457 |
|
| 1956 |
59.7% 29,944 |
40.3% 20,206 |
|
| 1952 |
60.6% 29,673 |
39.3% 19,234 |
0.2% 81 |
| 1948 |
47.5% 18,836 |
52.3% 20,762 |
0.2% 66 |
| 1944 |
55.4% 21,531 |
44.5% 17,287 |
0.2% 68 |
| 1940 |
49.1% 21,456 |
50.7% 22,130 |
0.3% 109 |
| 1936 |
44.5% 17,298 |
55.2% 21,489 |
0.3% 119 |
| 1932 |
42.5% 13,943 |
55.7% 18,255 |
1.8% 596 |
| 1928 |
66.9% 22,166 |
32.9% 10,901 |
0.3% 84 |
| 1924 |
45.7% 13,618 |
44.0% 13,084 |
10.3% 3,069 |
| 1920 |
56.0% 15,755 |
40.9% 11,514 |
3.1% 857 |
| 1916 |
49.0% 7,543 |
46.7% 7,191 |
4.4% 676 |
| 1912 |
34.6% 4,350 |
40.5% 5,089 |
24.9% 3,121 |
| 1908 |
49.8% 6,439 |
45.1% 5,830 |
5.1% 659 |
| 1904 |
55.0% 6,570 |
38.0% 4,540 |
7.0% 839 |
| 1900 |
50.7% 6,009 |
46.5% 5,519 |
2.8% 336 |
| 1896 |
47.6% 5,808 |
51.8% 6,327 |
0.6% 72 |
| 1892 |
45.8% 4,839 |
38.4% 4,051 |
15.8% 1,673 |
| 1888 |
50.7% 4,934 |
40.9% 3,984 |
8.4% 818 |
Like most counties situated in Southwest Missouri, Greene County is a Republican stronghold in presidential elections. George W. Bush carried Greene County in 2000 and 2004 by almost two-to-one margins, and like many other counties throughout Southwest Missouri, Greene County favored John McCain over Barack Obama in 2008. In the 2016 presidential election, Donald Trump carried Greene County by a margin of 60% to 33%.[16] The last Democratic presidential nominee to win Greene County was Lyndon B. Johnson in 1964. In 2004, Missourians voted on a constitutional amendment to define marriage as the union between a man and a woman—it passed Greene County with 72.04 percent of the vote. The initiative passed the state with 71 percent of support from voters as Missouri became the first state to ban same-sex marriage. In 2006, Missourians voted on a constitutional amendment to fund and legalize embryonic stem cell research in the state—it narrowly failed in Greene County with 51.62 percent voting against the measure. The initiative narrowly passed the state with 51 percent of support from voters as Missouri became one of the first states in the nation to approve embryonic stem cell research. Despite Greene County’s longstanding tradition of supporting socially conservative platforms, voters in the county have a penchant for advancing populist causes like increasing the minimum wage. In 2006, Missourians voted on a proposition (Proposition B) to increase the minimum wage in the state to $6.50 an hour—it passed Greene County with 74.41 percent of the vote. The proposition strongly passed every single county in Missouri with 78.99 percent voting in favor as the minimum wage was increased to $6.50 an hour in the state. During the same election, voters in five other states also strongly approved increases in the minimum wage.
Missouri presidential preference primary (2008)
Voters in Greene County from both political parties supported candidates who finished in second place in the state at large and nationally.
- Although a conservative/Republican stronghold, former U.S. Senator Hillary Clinton (D-New York) still received more votes, a total of 18,322, than any candidate from either party in Greene County during the 2008 presidential primary.
Education
Public schools
- Ash Grove R-IV School District - Ash Grove
- Ash Grove Elementary School - (PK-06)
- Bois D'Arc Elementary School - (K-06) - Bois D'Arc
- Ash Grove High School - (07-12)
- Fair Grove R-X School District - Fair Grove
- Fair Grove Elementary School - (K-04)
- Fair Grove Middle School - (05-08)
- Fair Grove High School - (09-12)
- Logan-Rogersville R-VIII School District - Rogersville
- Logan-Rogersville Primary School - (PK-01)
- Logan-Rogersville Elementary School - (02-03)
- Logan-Rogersville Upper Elementary School - (04-06)
- Logan-Rogersville Middle School - (07-08)
- Logan-Rogersville High School - (09-12)
- Republic R-III School District - Republic
- Republic Kindergarten School - (K)
- Republic Elementary School I - (01-02)
- Republic Elementary School II - (03-04)
- Republic Elementary School III - (05-06)
- Republic Middle School - (07-08)
- Republic High School - (09-12)
- Springfield R-XII School District - Springfield
- Shady Dell Early Childhood Center - (PK) - Springfield
- York Elementary School - (PK-05) - Springfield
- Williams Elementary School - (K-05) - Springfield
- Wilder Elementary School - (K-05) - Springfield
- Westport Elementary School - (K-05) - Springfield
- Weller Elementary School - (PK-05) - Springfield
- Weaver Elementary School - (K-05) - Springfield
- Watkins Elementary School - (PK-05) - Springfield
- Truman Elementary School - (K-05) - Springfield
- Sunshine Elementary School - (K-05) - Springfield
- Sherwood Elementary School - (K-05) - Springfield
- Sequiota Elementary School - (K-05) - Springfield
- Rountree Elementary School - (K-05) - Springfield
- Robberson Elementary School - (K-05) - Springfield
- Portland Elementary School - (K-05) - Springfield
- Pleasant View Elementary School - (K-05) - Springfield
- Pittman Elementary School - (K-05) - Springfield
- Pershing Elementary School - (K-05) - Springfield
- McGregor Elementary School - (K-05) - Springfield
- McBride Elementary School - (K-04) - Springfield
- Mark Twain Elementary School - (K-05) - Springfield
- Walt Disney Elementary School - (K-05) - Springfield
- Jeffries Elementary School - (PK-05) - Springfield
- Horace Mann Elementary School - (PK-05) - Springfield
- Holland Elementary School - (K-05) - Springfield
- Hickory Hills Elementary School - (K-05) - Springfield
- Gray Elementary School - (K-04) - Springfield
- Fremont Elementary School - (PK-05) - Springfield
- Field Elementary School - (K-05) - Springfield
- Delaware Elementary School - (K-05) - Springfield
- David Harrison Elementary School - (K-04) - Springfield
- Cowden Elementary School - (PK-05) - Springfield
- Campbell Elementary School - (K-05) - Springfield
- Boyd Elementary School - (PK-05) - Springfield
- Bowerman Elementary School - (K-05) - Springfield
- Bissett Elementary School - (K-05) - Springfield
- Bingham Elementary School - (K-05) - Springfield
- Wilson's Creek 5-6 Intermediate Center - (05-06) - Battlefield
- Study Middle School - (06-08) - Springfield
- Reed Middle School - (06-08) - Springfield
- Pleasant View Middle School - (06-08) - Springfield
- Pipkin Middle School - (06-08) - Springfield
- Pershing Middle School - (06-08) - Springfield
- Jarrett Middle School - (06-08) - Springfield
- Hickory Hills Middle School - (06-08) - Springfield
- Cherokee Middle School - (06-08) - Springfield
- Carver Middle School - (06-08) - Springfield
- Parkview High School - (09-12) - Springfield
- Kickapoo High School - (09-12) - Springfield
- Hillcrest High School - (09-12) - Springfield
- Glendale High School - (09-12) - Springfield
- Central High School - (09-12) - Springfield
- Strafford R-VI School District - Strafford
- Strafford Elementary School - (K-04)
- Strafford Middle School - (05-08)
- Strafford High School - (09-12)
- Walnut Grove R-V School District - Walnut Grove
- Walnut Grove Preschool (PK)
- Walnut Grove Elementary School - (K-06)
- Walnut Grove High School - (07-12)
- Willard R-II School District - Willard
- Willard North Elementary School - (PK-04) - Willard
- Willard East Elementary School - (K-04) - Willard
- Willard South Elementary School - (PK-04) - Springfield
- Willard Central Elementary School - (K-04) - Springfield
- Willard Intermediate School - (05-06) - Willard
- Willard Middle School - (07-08) - Willard
- Willard High School - (09-12) - Willard
Alternative/other schools
- Bailey Educational Center - (09-12) - Springfield - Alternative/Other School
- Community Learning Center - (06-12) - Springfield - Alternative/Other School
- Datema House - (05-12) - Springfield - Alternative/Other School
- Excel School - (06-12) - Springfield - Alternative/Other School
- Graff Career Center - (09-12) - Springfield - Vocational/Technical School
- Greene County Special Education Cooperative - (K-12) - Republic - Special Education
- Greene Valley - Springfield - Special Education
- Phelps Gifted Center - (01-12) - Springfield - Alternative/Other School/Gifted Education
- Wilson Creek Group Home - (06-12) - Springfield - Alternative/Other School
Colleges and universities
Public libraries
- Springfield-Greene County Library[17]
References
- 1 2 "State & County QuickFacts". United States Census Bureau. Archived from the original on July 11, 2011. Retrieved September 8, 2013.
- ↑ "Find a County". National Association of Counties. Archived from the original on 2011-05-31. Retrieved 2011-06-07.
- ↑ Eaton, David Wolfe (1916). How Missouri Counties, Towns and Streams Were Named. The State Historical Society of Missouri. p. 170.
- ↑ "2010 Census Gazetteer Files". United States Census Bureau. August 22, 2012. Archived from the original on October 21, 2013. Retrieved November 15, 2014.
- ↑ "Population and Housing Unit Estimates". Retrieved June 9, 2017.
- ↑ "U.S. Decennial Census". United States Census Bureau. Archived from the original on May 12, 2015. Retrieved November 15, 2014.
- ↑ "Historical Census Browser". University of Virginia Library. Retrieved November 15, 2014.
- ↑ "Population of Counties by Decennial Census: 1900 to 1990". United States Census Bureau. Retrieved November 15, 2014.
- ↑ "Census 2000 PHC-T-4. Ranking Tables for Counties: 1990 and 2000" (PDF). United States Census Bureau. Retrieved November 15, 2014.
- ↑ "American FactFinder". United States Census Bureau. Archived from the original on 2013-09-11. Retrieved 2011-05-14.
- ↑ IT, Missouri Secretary of State -. "Registered Voters in Missouri". www.sos.mo.gov. Retrieved 23 March 2018.
- 1 2 3 4 5 6 7 8 9 10 "Summary Report for November 8, 2016". Greene County Clerk. November 11, 2016. Retrieved April 23, 2017.
- 1 2 3 4 5 6 7 8 9 10 11 "County Results, State of Missouri - General Election - November 4, 2014". Retrieved March 23, 2016.
- 1 2 3 4 5 6 7 8 9 10 "County Results, State of Missouri - General Election - November 6, 2012". Retrieved March 23, 2016.
- ↑ Leip, David. "Dave Leip's Atlas of U.S. Presidential Elections". uselectionatlas.org. Retrieved 23 March 2018.
- ↑ "Elections 2016 - USA TODAY Network". USA TODAY. Retrieved 23 March 2018.
- ↑ Breeding, Marshall. "Springfield-Greene County Library". Libraries.org. Retrieved May 8, 2017.