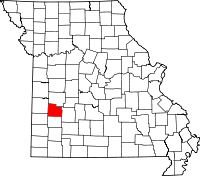
Geography
According to the U.S. Census Bureau, the county has a total area of 499 square miles (1,290 km2), of which 474 square miles (1,230 km2) is land and 24 square miles (62 km2) (4.8%) is water.[4] The water area includes various rivers and Stockton Lake.
Demographics
| Historical population |
| Census | Pop. | | %± |
| 1850 | 3,361 | | — |
| 1860 | 6,637 | | 97.5% |
| 1870 | 9,474 | | 42.7% |
| 1880 | 10,741 | | 13.4% |
| 1890 | 15,620 | | 45.4% |
| 1900 | 16,923 | | 8.3% |
| 1910 | 16,080 | | −5.0% |
| 1920 | 13,933 | | −13.4% |
| 1930 | 11,136 | | −20.1% |
| 1940 | 11,697 | | 5.0% |
| 1950 | 10,663 | | −8.8% |
| 1960 | 9,185 | | −13.9% |
| 1970 | 9,424 | | 2.6% |
| 1980 | 11,894 | | 26.2% |
| 1990 | 12,093 | | 1.7% |
| 2000 | 13,733 | | 13.6% |
| 2010 | 13,982 | | 1.8% |
| Est. 2016 | 14,016 | [5] | 0.2% |
U.S. Decennial Census[6]
1790-1960[7] 1900-1990[8]
1990-2000[9] 2010-2015[1] |
As of the census[10] of 2000, there are 13,733 people, 5,685 households, and 3,894 families residing in the county. The population density is 29 people per square mile (11/km²). There are 6,813 housing units at an average density of 14 per square mile (6/km²). The racial makeup of the county is 96.58% White, 0.32% Black or African American, 0.66% Native American, 0.46% Asian, 0.04% Pacific Islander, 0.50% from other races, and 1.43% from two or more races. Approximately 1.11% of the population were Hispanic or Latino of any race.
There are 5,685 households out of which 27.80% have children under the age of 18 living with them, 57.50% are married couples living together, 7.90% have a female householder with no husband present, and 31.50% are non-families. 28.10% of all households are made up of individuals and 15.30% have someone living alone who is 65 years of age or older. The average household size is 2.35 and the average family size is 2.86.
In the county, the population is spread out with 24.60% under the age of 18, 6.40% from 18 to 24, 22.80% from 25 to 44, 25.40% from 45 to 64, and 20.80% who are 65 years of age or older. The median age is 42 years. For every 100 females there are 95.90 males. For every 100 females age 18 and over, there are 90.50 males.
The median income for a household in the county is $26,694, and the median income for a family is $32,710. Males have a median income of $25,017 versus $17,594 for females. The per capita income for the county is $14,356. 17.40% of the population and 11.60% of families are below the poverty line. Out of the total population, 24.80% of those under the age of 18 and 14.20% of those 65 and older are living below the poverty line.
Education
Public libraries
- Cedar County Library District[11]
Politics
Local
The Republican Party completely controls politics at the local level in Cedar County. Republicans hold all of the elected positions in the county.
State
Past Gubernatorial Elections Results
| Year |
Republican |
Democratic |
Third Parties |
| 2016 |
70.26% 4,415 |
26.53% 1,667 |
3.21% 202 |
| 2012 |
56.43% 3,383 |
40.92% 2,453 |
2.65% 159 |
| 2008 |
47.17% 2,970 |
48.22% 3,036 |
4.61% 290 |
| 2004 |
66.31% 4,096 |
32.04% 1,979 |
1.65% 102 |
| 2000 |
58.42% 3,297 |
39.69% 2,240 |
1.89% 107 |
| 1996 |
54.31% 2,827 |
42.50% 2,212 |
3.19% 166 |
Cedar County is split between three of Missouri’s legislative districts that elect members of the Missouri House of Representatives. All three are represented by Republicans.
- District 125 — Warren Love (R-Osceola). The district includes El Dorado Springs and the rest of the northern part of the county.
Missouri House of Representatives — District 125 — Cedar County (2016)
| Party |
Candidate |
Votes |
% |
± |
|
Republican |
Warren D. Love' |
2,420 |
100.00% |
|
Missouri House of Representatives — District 125 — Cedar County (2014)
| Party |
Candidate |
Votes |
% |
± |
|
Republican |
Warren D. Love |
1,303 |
100.00% |
|
Missouri House of Representatives — District 125 — Cedar County (2012)
| Party |
Candidate |
Votes |
% |
± |
|
Republican |
Warren D. Love |
2,257 |
100.00% |
|
- District 127 — Mike Kelley (R-Lamar). Consists of Jerico Springs, Umber View Heights, and the rest of the southern part of the county.
Missouri House of Representatives — District 127 — Cedar County (2016)
| Party |
Candidate |
Votes |
% |
± |
|
Republican |
Mike Kelley |
543 |
81.90% |
-18.10 |
|
Independent |
George R. Parsons |
120 |
18.10% |
+18.10 |
Missouri House of Representatives — District 127 — Cedar County (2014)
| Party |
Candidate |
Votes |
% |
± |
|
Republican |
Mike Kelley |
302 |
100.00% |
|
Missouri House of Representatives — District 127 — Cedar County (2012)
| Party |
Candidate |
Votes |
% |
± |
|
Republican |
Mike Kelley |
565 |
100.00% |
|
- District 128 — Mike Stephens (R-Boliver). Consists of Stockton and the rest of the center of the county.
Missouri House of Representatives — District 128 — Cedar County (2016)
| Party |
Candidate |
Votes |
% |
± |
|
Republican |
Mike Stephens |
2,304 |
85.33% |
-14.67 |
|
Independent |
Janet Sheffield |
396 |
14.67% |
+14.67 |
Missouri House of Representatives — District 128 — Cedar County (2014)
| Party |
Candidate |
Votes |
% |
± |
|
Republican |
Sue Entlicher |
1,303 |
100.00% |
|
Missouri House of Representatives — District 128 — Cedar County (2012)
| Party |
Candidate |
Votes |
% |
± |
|
Republican |
Sue Entichler |
2,281 |
100.00% |
|
All of Cedar County is a part of Missouri’s 28th District in the Missouri Senate. The seat is currently vacant. The previous incumbent, Mike Parson was elected Lieutenant Governor in 2016.
Missouri Senate — District 28 — Cedar County (2014)
| Party |
Candidate |
Votes |
% |
± |
|
Republican |
Mike Parson |
2,969 |
100.00% |
|
Federal
U.S. Senate — Missouri — Cedar County (2016)
| Party |
Candidate |
Votes |
% |
± |
|
Republican |
Roy Blunt |
4,445 |
70.61% |
+16.92 |
|
Democratic |
Jason Kander |
1,541 |
24.48% |
-14.59 |
|
Libertarian |
Jonathan Dine |
172 |
2.73% |
-4.51 |
|
Green |
Johnathan McFarland |
80 |
1.27% |
+1.27 |
|
Constitution |
Fred Ryman |
57 |
0.91% |
+0.91 |
U.S. Senate — Missouri — Cedar County (2012)
| Party |
Candidate |
Votes |
% |
± |
|
Republican |
Todd Akin |
3,205 |
53.69% |
|
|
Democratic |
Claire McCaskill |
2,332 |
39.07% |
|
|
Libertarian |
Jonathan Dine |
432 |
7.24% |
|
All of Cedar County is included in Missouri’s 4th Congressional District and is currently represented by Vicky Hartzler (R-Harrisonville) in the U.S. House of Representatives.
U.S. House of Representatives — Missouri's 4th Congressional District — Cedar County (2016)
| Party |
Candidate |
Votes |
% |
± |
|
Republican |
Vicky Hartzler |
4,970 |
80.39% |
+1.65 |
|
Democratic |
Gordon Christensen |
953 |
15.42% |
-1.48 |
|
Libertarian |
Mark Bliss |
259 |
4.19% |
-0.17 |
U.S. House of Representatives — Missouri's 4th Congressional District — Cedar County (2014)
| Party |
Candidate |
Votes |
% |
± |
|
Republican |
Vicky Hartzler |
2,670 |
78.74% |
+4.15 |
|
Democratic |
Nate Irvin |
573 |
16.90% |
-4.76 |
|
Libertarian |
Herschel L. Young |
148 |
4.36% |
+1.56 |
U.S. House of Representatives — Missouri’s 4th Congressional District — Cedar County (2012)
| Party |
Candidate |
Votes |
% |
± |
|
Republican |
Vicky Hartzler |
4,417 |
74.59% |
|
|
Democratic |
Teresa Hensley |
1,283 |
21.66% |
|
|
Libertarian |
Thomas Holbrook |
166 |
2.80% |
|
|
Constitution |
Greg Cowan |
56 |
0.95% |
|
Political culture
Presidential elections results
Presidential elections results[12]
| Year |
Republican |
Democratic |
Third parties |
| 2016 |
79.4% 5,021 |
16.0% 1,011 |
4.7% 295 |
| 2012 |
72.4% 4,376 |
25.4% 1,537 |
2.2% 132 |
| 2008 |
66.0% 4,194 |
32.4% 2,060 |
1.6% 100 |
| 2004 |
68.3% 4,238 |
30.8% 1,910 |
0.9% 55 |
| 2000 |
62.3% 3,530 |
35.0% 1,979 |
2.7% 154 |
| 1996 |
47.6% 2,484 |
38.8% 2,027 |
13.6% 711 |
| 1992 |
39.1% 2,085 |
38.7% 2,064 |
22.3% 1,190 |
| 1988 |
62.5% 2,966 |
37.4% 1,774 |
0.1% 4 |
| 1984 |
71.1% 3,539 |
28.9% 1,440 |
|
| 1980 |
65.7% 3,469 |
32.2% 1,703 |
2.1% 111 |
| 1976 |
55.4% 2,752 |
44.2% 2,192 |
0.4% 21 |
| 1972 |
75.3% 3,520 |
24.7% 1,152 |
|
| 1968 |
64.1% 2,940 |
26.6% 1,218 |
9.4% 430 |
| 1964 |
52.4% 2,478 |
47.6% 2,247 |
|
| 1960 |
70.7% 3,730 |
29.3% 1,547 |
|
| 1956 |
65.6% 3,276 |
34.4% 1,720 |
|
| 1952 |
71.7% 3,814 |
27.9% 1,483 |
0.4% 22 |
| 1948 |
58.6% 2,928 |
41.2% 2,062 |
0.2% 10 |
| 1944 |
70.7% 3,576 |
29.2% 1,478 |
0.1% 5 |
| 1940 |
67.0% 4,068 |
32.5% 1,973 |
0.5% 32 |
| 1936 |
58.8% 3,535 |
40.6% 2,443 |
0.6% 34 |
| 1932 |
46.5% 2,515 |
52.4% 2,834 |
1.2% 63 |
| 1928 |
65.8% 3,340 |
34.0% 1,728 |
0.2% 12 |
| 1924 |
55.8% 2,802 |
40.0% 2,007 |
4.2% 210 |
| 1920 |
63.5% 3,488 |
35.2% 1,936 |
1.3% 71 |
| 1916 |
55.3% 1,874 |
41.6% 1,410 |
3.1% 106 |
| 1912 |
36.1% 1,242 |
40.4% 1,392 |
23.5% 810 |
| 1908 |
54.9% 1,933 |
42.1% 1,483 |
3.0% 107 |
| 1904 |
52.9% 1,885 |
43.0% 1,533 |
4.1% 145 |
| 1900 |
48.5% 1,845 |
47.9% 1,820 |
3.6% 137 |
| 1896 |
43.8% 1,881 |
55.9% 2,400 |
0.4% 15 |
| 1892 |
41.5% 1,354 |
38.2% 1,246 |
20.3% 663 |
| 1888 |
43.1% 1,424 |
43.4% 1,434 |
13.6% 448 |
Missouri presidential preference primary (2008)
- Former Governor Mike Huckabee (R-Arkansas) received more votes, a total of 1,051, than any candidate from either party in Cedar County during the 2008 presidential primary.
References
- 1 2 "State & County QuickFacts". United States Census Bureau. Retrieved September 7, 2013.
- ↑ "Find a County". National Association of Counties. Archived from the original on 2011-05-31. Retrieved 2011-06-07.
- ↑ Eaton, David Wolfe (1916). How Missouri Counties, Towns and Streams Were Named. The State Historical Society of Missouri. p. 273.
- ↑ "2010 Census Gazetteer Files". United States Census Bureau. August 22, 2012. Archived from the original on October 21, 2013. Retrieved November 14, 2014.
- ↑ "Population and Housing Unit Estimates". Retrieved June 9, 2017.
- ↑ "U.S. Decennial Census". United States Census Bureau. Archived from the original on May 12, 2015. Retrieved November 14, 2014.
- ↑ "Historical Census Browser". University of Virginia Library. Retrieved November 14, 2014.
- ↑ "Population of Counties by Decennial Census: 1900 to 1990". United States Census Bureau. Retrieved November 14, 2014.
- ↑ "Census 2000 PHC-T-4. Ranking Tables for Counties: 1990 and 2000" (PDF). United States Census Bureau. Retrieved November 14, 2014.
- ↑ "American FactFinder". United States Census Bureau. Archived from the original on 2013-09-11. Retrieved 2011-05-14.
- ↑ Breeding, Marshall. "Cedar County Library District". Libraries.org. Retrieved May 8, 2017.
- ↑ Leip, David. "Dave Leip's Atlas of U.S. Presidential Elections". uselectionatlas.org. Retrieved 2018-03-24.