Pickaway County, Ohio
| Pickaway County, Ohio | ||
|---|---|---|
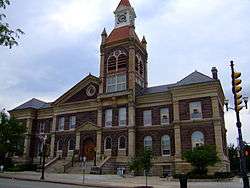 Pickaway County Courthouse | ||
| ||
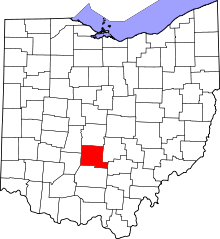 Location in the U.S. state of Ohio | ||
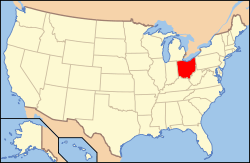 Ohio's location in the U.S. | ||
| Founded | March 1, 1810[1] | |
| Seat | Circleville | |
| Largest city | Circleville | |
| Area | ||
| • Total | 507 sq mi (1,313 km2) | |
| • Land | 501 sq mi (1,298 km2) | |
| • Water | 5.2 sq mi (13 km2), 1.0% | |
| Population | ||
| • (2010) | 55,698 | |
| • Density | 111/sq mi (43/km2) | |
| Congressional district | 15th | |
| Time zone | Eastern: UTC−5/−4 | |
| Website |
www | |

Pickaway County is a county located in the U.S. state of Ohio. As of the 2010 census, the population was 55,698.[2] Its county seat is Circleville.[3] Its name derives from the Pekowi band of Shawnee Indians, who inhabited the area. (See List of Ohio county name etymologies.)
Pickaway County is part of the Columbus, OH Metropolitan Statistical Area.
Geography
According to the U.S. Census Bureau, the county has a total area of 507 square miles (1,310 km2), of which 501 square miles (1,300 km2) is land and 5.2 square miles (13 km2) (1.0%) is water.[4]
Adjacent counties
- Franklin County (north)
- Fairfield County (east)
- Hocking County (southeast)
- Ross County (south)
- Fayette County (southwest)
- Madison County (northwest)
Demographics
| Historical population | |||
|---|---|---|---|
| Census | Pop. | %± | |
| 1810 | 7,124 | — | |
| 1820 | 13,149 | 84.6% | |
| 1830 | 16,001 | 21.7% | |
| 1840 | 19,725 | 23.3% | |
| 1850 | 21,006 | 6.5% | |
| 1860 | 23,649 | 12.6% | |
| 1870 | 24,875 | 5.2% | |
| 1880 | 27,415 | 10.2% | |
| 1890 | 26,959 | −1.7% | |
| 1900 | 27,016 | 0.2% | |
| 1910 | 26,158 | −3.2% | |
| 1920 | 25,788 | −1.4% | |
| 1930 | 27,238 | 5.6% | |
| 1940 | 27,889 | 2.4% | |
| 1950 | 29,352 | 5.2% | |
| 1960 | 35,855 | 22.2% | |
| 1970 | 40,071 | 11.8% | |
| 1980 | 43,662 | 9.0% | |
| 1990 | 48,255 | 10.5% | |
| 2000 | 52,727 | 9.3% | |
| 2010 | 55,698 | 5.6% | |
| Est. 2017 | 57,830 | [5] | 3.8% |
| U.S. Decennial Census[6] 1790-1960[7] 1900-1990[8] 1990-2000[9] 2010-2017[2] | |||
2000 census
As of the census[10] of 2000, there were 52,727 people, 17,599 households, and 13,287 families residing in the county. The population density was 105 people per square mile (41/km²). There were 18,596 housing units at an average density of 37 per square mile (14/km²). The racial makeup of the county was 91.95% White, 6.43% Black or African American, 0.28% Native American, 0.22% Asian, 0.03% Pacific Islander, 0.15% from other races, and 0.93% from two or more races. 0.63% of the population were Hispanic or Latino of any race.
There were 17,599 households out of which 35.40% had children under the age of 18 living with them, 61.50% were married couples living together, 9.80% had a female householder with no husband present, and 24.50% were non-families. 20.60% of all households were made up of individuals and 9.10% had someone living alone who was 65 years of age or older. The average household size was 2.63 and the average family size was 3.02.
In the county, the population was spread out with 24.30% under the age of 18, 9.00% from 18 to 24, 32.60% from 25 to 44, 23.40% from 45 to 64, and 10.80% who were 65 years of age or older. The median age was 36 years. For every 100 females there were 122.20 males. For every 100 females age 18 and over, there were 125.00 males.
The median income for a household in the county was $42,832, and the median income for a family was $49,259. Males had a median income of $36,265 versus $26,086 for females. The per capita income for the county was $17,478. About 7.60% of families and 9.50% of the population were below the poverty line, including 13.40% of those under age 18 and 7.00% of those age 65 or over.
2010 census
As of the 2010 United States Census, there were 55,698 people, 19,624 households, and 14,286 families residing in the county.[11] The population density was 111.1 inhabitants per square mile (42.9/km2). There were 21,275 housing units at an average density of 42.4 per square mile (16.4/km2).[12] The racial makeup of the county was 94.5% white, 3.4% black or African American, 0.4% Asian, 0.2% American Indian, 0.3% from other races, and 1.2% from two or more races. Those of Hispanic or Latino origin made up 1.1% of the population.[11] In terms of ancestry, 27.0% were German, 16.3% were American, 14.9% were Irish, and 11.1% were English.[13]
Of the 19,624 households, 35.4% had children under the age of 18 living with them, 56.6% were married couples living together, 10.9% had a female householder with no husband present, 27.2% were non-families, and 22.2% of all households were made up of individuals. The average household size was 2.61 and the average family size was 3.03. The median age was 38.5 years.[11]
The median income for a household in the county was $49,262 and the median income for a family was $58,811. Males had a median income of $44,224 versus $35,077 for females. The per capita income for the county was $21,432. About 9.5% of families and 12.4% of the population were below the poverty line, including 19.3% of those under age 18 and 6.8% of those age 65 or over.[14]
Politics
| Year | Republican | Democratic | Third parties |
|---|---|---|---|
| 2016 | 68.6% 17,076 | 26.2% 6,529 | 5.3% 1,307 |
| 2012 | 58.1% 14,037 | 40.1% 9,684 | 1.8% 433 |
| 2008 | 59.8% 14,228 | 38.2% 9,077 | 2.0% 482 |
| 2004 | 62.0% 14,161 | 37.5% 8,579 | 0.5% 112 |
| 2000 | 60.4% 10,717 | 37.2% 6,598 | 2.4% 425 |
| 1996 | 49.5% 8,666 | 40.2% 7,042 | 10.3% 1,793 |
| 1992 | 45.9% 8,690 | 30.5% 5,765 | 23.6% 4,475 |
| 1988 | 68.4% 10,796 | 31.1% 4,905 | 0.6% 93 |
| 1984 | 73.9% 11,942 | 25.4% 4,110 | 0.7% 108 |
| 1980 | 61.2% 9,289 | 33.3% 5,052 | 5.5% 829 |
| 1976 | 54.8% 7,695 | 42.1% 5,907 | 3.2% 443 |
| 1972 | 74.3% 9,661 | 22.9% 2,978 | 2.8% 363 |
| 1968 | 53.3% 6,690 | 28.1% 3,536 | 18.6% 2,338 |
| 1964 | 42.1% 5,317 | 57.9% 7,310 | |
| 1960 | 61.6% 7,821 | 38.4% 4,870 | |
| 1956 | 60.7% 6,956 | 39.3% 4,509 | |
| 1952 | 57.2% 6,836 | 42.8% 5,109 | |
| 1948 | 48.4% 4,965 | 51.6% 5,290 | 0.1% 7 |
| 1944 | 52.8% 5,997 | 47.2% 5,362 | |
| 1940 | 46.4% 5,974 | 53.6% 6,895 | |
| 1936 | 38.6% 4,920 | 61.2% 7,813 | 0.2% 30 |
| 1932 | 40.3% 4,395 | 58.8% 6,414 | 0.9% 98 |
| 1928 | 59.9% 5,871 | 39.7% 3,894 | 0.4% 41 |
| 1924 | 46.2% 4,166 | 50.4% 4,539 | 3.4% 304 |
| 1920 | 48.2% 5,273 | 51.6% 5,645 | 0.2% 21 |
| 1916 | 40.4% 2,629 | 58.7% 3,820 | 1.0% 63 |
| 1912 | 36.1% 2,282 | 52.4% 3,311 | 11.5% 724 |
| 1908 | 43.2% 3,119 | 55.4% 4,007 | 1.4% 103 |
| 1904 | 44.6% 2,976 | 52.4% 3,492 | 3.0% 200 |
| 1900 | 43.4% 3,201 | 54.7% 4,033 | 1.9% 139 |
| 1896 | 44.2% 3,370 | 54.7% 4,165 | 1.1% 84 |
| 1892 | 42.9% 2,953 | 54.6% 3,759 | 2.5% 173 |
| 1888 | 43.4% 3,046 | 54.6% 3,831 | 2.0% 142 |
| 1884 | 42.7% 2,931 | 56.6% 3,889 | 0.7% 51 |
| 1880 | 43.6% 2,910 | 56.3% 3,753 | 0.1% 7 |
| 1876 | 43.0% 2,565 | 56.9% 3,389 | 0.1% 7 |
| 1872 | 46.6% 2,353 | 52.7% 2,660 | 0.7% 37 |
Economy
Manufacturing makes up a significant proportion of area industry and employment; in the 2010 census, 3075 county residents (13.4%) were employed in manufacturing.[16] Circleville is home to the largest DuPont chemical plant in Ohio. Opened in the 1950s, it produces Mylar and Tedlar plastic films, the latter used extensively in the production of photovoltaic modules.[17][18]
Other manufacturing concerns in Circleville or surrounding Pickaway County include Aleris, a producer of rolled and extruded aluminum products,[19] and Florida Production Engineering, Inc. (FPE), producing plastic injection molded components for the automotive industry.[20] Georgia-Pacific, a manufacturer of paperboard containers and other paper products, has a plant located south of town. The PPG Industries Circleville plant is the company's center for polymer resin production, primarily for automotive applications.[21]
Other major employers include Berger Health System; Circleville City, Teays Valley Local and Logan Elm Local School districts; Circle Plastics/TriMold LLC; the State of Ohio; and Wal-Mart Stores.[16]
Businesses that formerly operated include the Jefferson-Smurfit paper mill[22], a 300-acre site, that is being redeveloped.[23] American Electric Power (AEP) owned the Picway Power Plant in the northern part of Pickaway County. The coal fired power plant operated from 1926 to 2015.[24] A GE Lighting plant opened in 1948.[19] The plant closed in 2017.[25]
Government
Education
Teays Valley Local School District
Teays Valley is in the northern part of the county. Schools in this district include:
- Teays Valley High School - 1,127 students
- Teays Valley East Middle School (grades 6-8) - 470
- Teays Valley West Middle School (grades 6-8) - 454
- Ashville Elementary (grades K-5) - 426
- Walnut Elementary (grades K-5) - 451
- Scioto Elementary (grades K-5) - 570
- South Bloomfield Elementary (grades K-5) - 431
Teays Valley has the largest number of students in the county.
Circleville City Schools
- Circleville High School - 559 students
- Circleville Middle School (grades 6-8) - 487
- Circleville Elementary (grades K-5) - 1,029
Logan Elm Local Schools
Logan Elm consists of the area in Southeastern Pickaway County.
- Logan Elm High School - 559 students
- George McDowell-Exchange Middle School (grades 7-8) - 299
- Salt Creek Intermediate School (grades 5-6) - 262
- Washington Elementary (grades K-4) - 212
- Pickaway Elementary (grades K-4) - 188
Westfall Local Schools
Westfall lies in the Western part of the county.
- Westfall High School - 422 students
- Westfall Middle School (grades 6-8) - 335
- Westfall Elementary (grades K-5) - 588
Pickaway-Ross Career & Technology Center
Pickaway-Ross lies just below the county line in Ross County. Students from the following affiliated Pickaway and Ross county districts at the vocational school.
- Circleville City School District (Pickaway County)
- Logan Elm Local School District (Pickaway County)
- Westfall Local School District (Pickaway County)
- Adena Local School District (Ross County)
- Chillicothe City School District (Ross County)
- Huntington Local School District (Ross County)
- Paint Valley Local School District (Ross County)
- Southeastern Local School District (Ross County)
- Unioto Local School District (Ross County)
- Zane Trace Local School District (Ross County)
Communities

City
- Circleville (county seat)
Villages
Townships
https://web.archive.org/web/20160715023447/http://www.ohiotownships.org/township-websites
Census-designated places
Unincorporated communities
Notable residents
- Dorothy Adkins (1912 - 1975), psychologist, grew up in Atlanta, Pickaway County
See also
References
- ↑ "Ohio County Profiles: Pickaway County" (PDF). Ohio Department of Development. Archived from the original (PDF) on 2007-06-21. Retrieved 2007-04-28.
- 1 2 "State & County QuickFacts". United States Census Bureau. Archived from the original on July 16, 2011. Retrieved February 10, 2015.
- ↑ "Find a County". National Association of Counties. Retrieved 2011-06-07.
- ↑ "2010 Census Gazetteer Files". United States Census Bureau. August 22, 2012. Archived from the original on May 4, 2014. Retrieved February 10, 2015.
- ↑ "Population and Housing Unit Estimates". Retrieved June 9, 2017.
- ↑ "U.S. Decennial Census". United States Census Bureau. Retrieved February 10, 2015.
- ↑ "Historical Census Browser". University of Virginia Library. Retrieved February 10, 2015.
- ↑ Forstall, Richard L., ed. (March 27, 1995). "Population of Counties by Decennial Census: 1900 to 1990". United States Census Bureau. Retrieved February 10, 2015.
- ↑ "Census 2000 PHC-T-4. Ranking Tables for Counties: 1990 and 2000" (PDF). United States Census Bureau. April 2, 2001. Retrieved February 10, 2015.
- ↑ "American FactFinder". United States Census Bureau. Retrieved 2008-01-31.
- 1 2 3 "DP-1 Profile of General Population and Housing Characteristics: 2010 Demographic Profile Data". United States Census Bureau. Retrieved 2015-12-27.
- ↑ "Population, Housing Units, Area, and Density: 2010 - County". United States Census Bureau. Retrieved 2015-12-27.
- ↑ "DP02 SELECTED SOCIAL CHARACTERISTICS IN THE UNITED STATES – 2006-2010 American Community Survey 5-Year Estimates". United States Census Bureau. Retrieved 2015-12-27.
- ↑ "DP03 SELECTED ECONOMIC CHARACTERISTICS – 2006-2010 American Community Survey 5-Year Estimates". United States Census Bureau. Retrieved 2015-12-27.
- ↑ Leip, David. "Dave Leip's Atlas of U.S. Presidential Elections". uselectionatlas.org. Retrieved 6 April 2018.
- 1 2 "Demographics and Income plus other local statistics for Pickaway County P3 Ohio". Pickawayprogress.com. Retrieved September 22, 2013.
- ↑ Murphy, Kristi (May 22, 2012). "DuPont celebrates Tedlar expansion". The Circleville Herald. Retrieved September 22, 2013.
- ↑ "News & Events for Pickaway Progress Business Development Project Central Ohio". Pickawayprogress.com. January 18, 2010. Archived from the original on September 27, 2013. Retrieved September 22, 2013.
- 1 2 Murphy, Kristi (August 22, 2013). "GE plant to add 50 jobs". The Circleville Herald. Retrieved September 22, 2013.
- ↑ "Plastic Injection Molding from 100 tons to 3000 tons in Florida, Kentucky and Ohio". Fpe-inc.com. Retrieved September 22, 2013.
- ↑ "Circleville, OH - Life At PPG - College Recruiting". Ppg.com. Retrieved September 22, 2013.
- ↑ Gaines, Sallie L. (December 2, 1998). "Smurfit To Shutter 5 Mills, Cut 1,660 Jobs". Chicago Tribune. Retrieved April 28, 2018.
- ↑ "Projects - Green Investment Group, Inc". Greeninvgroup.com. Retrieved September 22, 2013.
- ↑ "Picway". AEP. Retrieved April 28, 2018.
- ↑ Gearino, Dan (April 12, 2017). "GE Lighting to close Circleville plant, costing 148 jobs". The Columbus Dispatch. Retrieved April 28, 2018.
External links
- Official website
- Pickaway Chamber of Commerce and visitor info
- Pickaway County Local Government Links
- Pickaway County Sheriff's Office
| Wikimedia Commons has media related to Pickaway County, Ohio. |
Places adjacent to Pickaway County, Ohio | ||||||||||
|---|---|---|---|---|---|---|---|---|---|---|
| ||||||||||
Municipalities and communities of Pickaway County, Ohio, United States | ||
|---|---|---|
| City | | |
| Villages | ||
| Townships | ||
| CDPs | ||
| Unincorporated communities | ||
| Ghost town | ||
| Footnotes | ‡This populated place also has portions in an adjacent county or counties | |