Spartanburg County, South Carolina
| Spartanburg County, South Carolina | ||
|---|---|---|
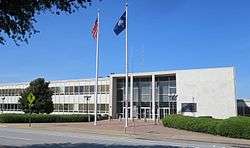 Spartanburg County Courthouse | ||
| ||
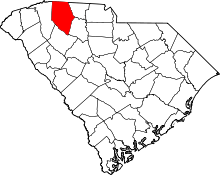 Location in the U.S. state of South Carolina | ||
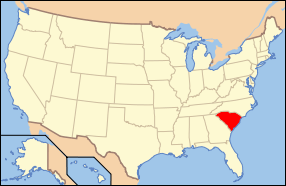 South Carolina's location in the U.S. | ||
| Founded | 1785 | |
| Seat | Spartanburg | |
| Largest city | Spartanburg | |
| Area | ||
| • Total | 819 sq mi (2,121 km2) | |
| • Land | 808 sq mi (2,093 km2) | |
| • Water | 11 sq mi (28 km2), 1.4% | |
| Population (est.) | ||
| • (2017) | 306,854 | |
| • Density | 352/sq mi (136/km2) | |
| Congressional districts | 4th, 5th | |
| Time zone | Eastern: UTC−5/−4 | |
| Website |
www | |

Spartanburg County is a county located on the northwestern border of the U.S. state of South Carolina. The 2017 population estimate is 306,854,[1] making it the fifth-most populous county in South Carolina. Its county seat is Spartanburg.[2]
Spartanburg County is included in the Spartanburg, SC Metropolitan Statistical Area, which is also included in the Greenville–Spartanburg–Anderson, SC Combined Statistical Area.
The USS Spartanburg County (LST-1192) is named after the county.
Geography
According to the U.S. Census Bureau, the county has a total area of 819 square miles (2,120 km2), of which 808 square miles (2,090 km2) is land and 11 square miles (28 km2) (1.4%) is water.[3]
History
Adjacent counties
- Rutherford County, North Carolina – north
- Cherokee County – east
- Union County – southeast
- Laurens County – south
- Greenville County – west
- Polk County, North Carolina – northwest
Major interstates
Demographics
| Historical population | |||
|---|---|---|---|
| Census | Pop. | %± | |
| 1790 | 8,800 | — | |
| 1800 | 12,122 | 37.8% | |
| 1810 | 14,259 | 17.6% | |
| 1820 | 16,989 | 19.1% | |
| 1830 | 21,150 | 24.5% | |
| 1840 | 23,669 | 11.9% | |
| 1850 | 26,400 | 11.5% | |
| 1860 | 26,919 | 2.0% | |
| 1870 | 25,784 | −4.2% | |
| 1880 | 40,409 | 56.7% | |
| 1890 | 55,385 | 37.1% | |
| 1900 | 65,560 | 18.4% | |
| 1910 | 83,465 | 27.3% | |
| 1920 | 94,265 | 12.9% | |
| 1930 | 116,323 | 23.4% | |
| 1940 | 127,733 | 9.8% | |
| 1950 | 150,349 | 17.7% | |
| 1960 | 156,830 | 4.3% | |
| 1970 | 173,724 | 10.8% | |
| 1980 | 201,861 | 16.2% | |
| 1990 | 226,800 | 12.4% | |
| 2000 | 253,791 | 11.9% | |
| 2010 | 284,307 | 12.0% | |
| Est. 2017 | 306,854 | [4] | 7.9% |
| U.S. Decennial Census[5] 1790–1960[6] 1900–1990[7] 1990–2000[8] 2010–2015[1] | |||
As of the 2010 United States Census, there were 284,307 people, 109,246 households, and 75,404 families residing in the county.[9] The population density was 351.9 inhabitants per square mile (135.9/km2). There were 122,628 housing units at an average density of 151.8 per square mile (58.6/km2).[10] The racial makeup of the county was 72.3% white, 20.6% black or African American, 2.0% Asian, 0.3% American Indian, 3.1% from other races, and 1.7% from two or more races. Those of Hispanic or Latino origin made up 5.9% of the population.[9] In terms of ancestry, 13.6% were American, 10.5% were Irish, 9.6% were English, and 8.8% were German.[11]
Of the 109,246 households, 34.3% had children under the age of 18 living with them, 48.9% were married couples living together, 15.1% had a female householder with no husband present, 31.0% were non-families, and 26.2% of all households were made up of individuals. The average household size was 2.53 and the average family size was 3.05. The median age was 38.0 years.[9]
The median income for a household in the county was $42,680 and the median income for a family was $53,149. Males had a median income of $41,445 versus $31,602 for females. The per capita income for the county was $21,924. About 11.0% of families and 14.8% of the population were below the poverty line, including 20.5% of those under age 18 and 10.9% of those age 65 or over.[12]
Education
Spartanburg County is served by the Spartanburg County School System, which is divided into seven districts. Some of the districts share a vocational school, and also share the McCarthy Teszler School, a special education school.
- School District One[13] includes Campobello-Gramling, Chapman High School, Holly Springs-Motlow Elementary, Inman Elementary, Inman Intermediate, Landrum High, Landrum Middle, Mabry Middle, New Prospect Elementary, and O.P. Earle Elementary. District One students can also attend Swofford Career Center
- School District Two[14] includes Boiling Springs Elementary, Cooley Springs-Fingerville Elementary, Chesnee Elementary, Hendrix Elementary, Carlisle-Foster's Grove Elementary, Mayo Elementary, Oakland Elementary, Boiling Springs Intermediate, Boling Springs Junior High, Rainbow Lake Middle School, Chesnee Middle School, Boiling Springs High 9th grade, Boiling Springs High School, and Chesnee High School. District Two students can also attend Swofford Career Center.
- School District Three[15] includes Cannons Elementary, Clifdale Elementary, Cowpens Elementary School, Pacolet Elementary School, Cowpens Middle School, Middle School of Pacolet, and Broome High School. District Three students can attend the Daniel Morgan Technology Center.
- School District Four[16] has four schools: Woodruff Primary, Woodruff Elementary, Woodruff Middle and Woodruff High School. High school students also can attend R.D. Anderson Applied Technology Center to learn vocational skills.
- School District Five[17] consists of Abner Creek Academy (formerly Abner Creek Elementary), Duncan Elementary, Lyman Elementary, Reidville Elementary, River Ridge Elementary, Wellford Academy of Science and Technology (formerly Wellford Elementary), Beech Springs Intermediate, Berry Shoals Intermediate, D. R. Hill Middle, Florence Chapel Middle, James F. Byrnes Freshman Academy, and James F. Byrnes High School. Vocational school students can attend R. D. Anderson Applied Technology Center.
- School District Six[18] comprises Anderson Mill Elementary, Arcadia Elementary, Jesse S. Bobo Elementary, Fairforest Elementary, Lone Oak Elementary, Pauline-Glenn Springs Elementary, Roebuck Elementary, West View Elementary, Woodland Heights Elementary, Fairforest Middle, R. P. Dawkins Middle, L. E. Gable Middle, Dorman Freshman Campus, and Paul M. Dorman High School. District Six students can attend R. D. Anderson Applied Technology Center.
- School District Seven[19] consists of Jesse Boyd Elementary, Chapman Elementary, Cleveland Elementary, Houston Elementary, Park Hills Elementary, Pine Street Elementary, Mary H. Wright Elementary, Edwin P. Todd School, George Washington Carver Middle, Joseph G. McCracken Middle, Whitlock Junior High, Spartanburg High School Freshman Academy, and Spartanburg High School. The Daniel Morgan Technology Center, ZL Madden Learning Center, The Myles W. Whitlock Flexible Learning Center, and The Early Learning Center at Park Hills also serve District Seven.
Communities
Cities
- Chesnee (partly in Cherokee County)
- Greer (mostly in Greenville County)
- Inman
- Landrum
- Spartanburg (county seat)
- Wellford
- Woodruff
Towns
Census-designated places
Unincorporated Communities
Politics
| Year | Republican | Democratic | Third parties |
|---|---|---|---|
| 2016 | 63.0% 76,277 | 33.0% 39,997 | 4.0% 4,816 |
| 2012 | 60.9% 66,969 | 37.7% 41,461 | 1.3% 1,476 |
| 2008 | 60.0% 65,042 | 38.4% 41,632 | 1.5% 1,654 |
| 2004 | 64.1% 62,004 | 34.8% 33,633 | 1.2% 1,121 |
| 2000 | 62.4% 52,114 | 35.4% 29,559 | 2.3% 1,880 |
| 1996 | 53.5% 35,972 | 39.9% 26,814 | 6.6% 4,410 |
| 1992 | 51.9% 37,707 | 35.1% 25,488 | 13.0% 9,440 |
| 1988 | 63.2% 40,801 | 35.6% 22,964 | 1.2% 803 |
| 1984 | 66.4% 41,553 | 32.2% 20,130 | 1.4% 892 |
| 1980 | 51.1% 30,092 | 46.3% 27,245 | 2.6% 1,532 |
| 1976 | 42.0% 20,456 | 57.3% 27,925 | 0.7% 336 |
| 1972 | 75.3% 31,308 | 23.1% 9,586 | 1.6% 662 |
| 1968 | 38.7% 18,183 | 24.4% 11,467 | 36.9% 17,346 |
| 1964 | 47.9% 18,411 | 52.1% 20,034 | |
| 1960 | 35.2% 10,940 | 64.8% 20,134 | |
| 1956 | 26.7% 6,822 | 65.0% 16,637 | 8.3% 2,124 |
| 1952 | 31.4% 10,028 | 68.6% 21,883 | |
| 1948 | 5.2% 627 | 56.0% 6,741 | 38.8% 4,673 |
| 1944 | 4.6% 402 | 92.6% 8,092 | 2.8% 244 |
| 1940 | 2.7% 248 | 97.4% 9,119 | |
| 1936 | 1.6% 173 | 98.4% 10,739 | |
| 1932 | 2.4% 227 | 97.6% 9,216 | 0.0% 1 |
| 1928 | 16.5% 760 | 83.5% 3,859 | 0.0% 1 |
| 1920 | 3.8% 182 | 96.2% 4,584 | |
| 1916 | 2.4% 112 | 96.3% 4,503 | 1.3% 60 |
| 1912 | 1.0% 37 | 94.1% 3,616 | 5.0% 191 |
| 1904 | 3.1% 84 | 96.9% 2,621 | |
| 1900 | 3.9% 101 | 96.1% 2,467 |
See also
References
- 1 2 "Counties Population Totals Tables: 2010-2017". United States Census Bureau. Retrieved 2018-03-26.
- ↑ "Find a County". National Association of Counties. Retrieved 2011-06-07.
- ↑ "2010 Census Gazetteer Files". United States Census Bureau. August 22, 2012. Retrieved March 19, 2015.
- ↑ "Counties Population Totals Tables: 2010-2017". Retrieved March 26, 2018.
- ↑ "U.S. Decennial Census". United States Census Bureau. Retrieved March 19, 2015.
- ↑ "Historical Census Browser". University of Virginia Library. Retrieved March 19, 2015.
- ↑ Forstall, Richard L., ed. (March 27, 1995). "Population of Counties by Decennial Census: 1900 to 1990". United States Census Bureau. Retrieved March 19, 2015.
- ↑ "Census 2000 PHC-T-4. Ranking Tables for Counties: 1990 and 2000" (PDF). United States Census Bureau. April 2, 2001. Retrieved March 19, 2015.
- 1 2 3 "DP-1 Profile of General Population and Housing Characteristics: 2010 Demographic Profile Data". United States Census Bureau. Retrieved 2016-03-11.
- ↑ "Population, Housing Units, Area, and Density: 2010 – County". United States Census Bureau. Retrieved 2016-03-11.
- ↑ "DP02 SELECTED SOCIAL CHARACTERISTICS IN THE UNITED STATES – 2006–2010 American Community Survey 5-Year Estimates". United States Census Bureau. Retrieved 2016-03-11.
- ↑ "DP03 SELECTED ECONOMIC CHARACTERISTICS – 2006–2010 American Community Survey 5-Year Estimates". United States Census Bureau. Retrieved 2016-03-11.
- ↑ "School District One". Spartanburg1.k12.sc.us. Retrieved September 1, 2011.
- ↑ "School District Two". Spartanburg2.k12.sc.us. Retrieved September 1, 2011.
- ↑ "School District Three". Spa3.k12.sc.us. Retrieved September 1, 2011.
- ↑ "School District Four". Spartanburg4.org. September 10, 2008. Retrieved September 1, 2011.
- ↑ "School District Five". Spart5.k12.sc.us. Retrieved November 21, 2013.
- ↑ "School District Six". Spartanburg6.k12.sc.us. May 30, 2011. Retrieved September 1, 2011.
- ↑ "School District Seven". Spart7.org. Retrieved September 1, 2011.
- ↑ Leip, David. "Dave Leip's Atlas of U.S. Presidential Elections". uselectionatlas.org. Retrieved 2018-03-13.
External links
| Wikimedia Commons has media related to Spartanburg County, South Carolina. |
- https://web.archive.org/web/20100715053617/http://www.statelibrary.sc.gov/spartanburg-county

Places adjacent to Spartanburg County, South Carolina | ||||||||||
|---|---|---|---|---|---|---|---|---|---|---|
| ||||||||||
Municipalities and communities of Spartanburg County, South Carolina, United States | ||
|---|---|---|
| Cities | | |
| Towns | ||
| CDPs | ||
| Unincorporated communities | ||
| Ghost town | ||
| Footnotes | ‡This populated place also has portions in an adjacent county or counties | |