Lexington County, South Carolina
| Lexington County, South Carolina | |
|---|---|
 Lexington County Courthouse in October 2013 | |
| Motto: In God We Trust | |
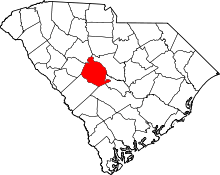 Location in the U.S. state of South Carolina | |
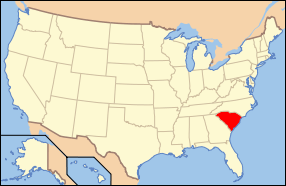 South Carolina's location in the U.S. | |
| Founded | 1785 |
| Named for | Battle of Lexington and Concord |
| Seat | Lexington |
| Largest town | Lexington |
| Area | |
| • Total | 758 sq mi (1,963 km2) |
| • Land | 699 sq mi (1,810 km2) |
| • Water | 59 sq mi (153 km2), 7.8% |
| Population (est.) | |
| • (2017) | 290,642[1] |
| • Density | 416/sq mi (161/km2) |
| Congressional district | 2nd |
| Time zone | Eastern: UTC−5/−4 |
| Website |
www |
Lexington County is a county located in the U.S. state of South Carolina. As of the 2010 census, the population was 262,391,[2] and the 2016 population estimate was 286,186.[1] Its county seat and largest town is Lexington.[3] The county was created in 1785.[4] Its name commemorates the Battle of Lexington in the American Revolutionary War.[5]
Lexington County is part of the Columbia, SC Metropolitan Statistical Area.
Geography
According to the U.S. Census Bureau, the county has a total area of 758 square miles (1,960 km2), of which 699 square miles (1,810 km2) is land and 59 square miles (150 km2) (7.8%) is water.[6] The largest body of water is Lake Murray, while other waterways include Broad River, Saluda River and Congaree River.
Adjacent counties
- Richland County - east
- Orangeburg County - southeast
- Calhoun County - southeast
- Aiken County - southwest
- Saluda County - west
- Newberry County - northwest
Climate
Lexington County, SC, gets 48 inches of rain per year. The US average is 37. Snowfall is 2 inches. The average US city gets 25 inches of snow per year. The number of days with any measurable precipitation is 104.
On average, there are 218 sunny days per year in Lexington County, SC. The July high is around 92 degrees. The January low is 33. The comfort index, which is based on humidity during the hot months, is a 29 out of 100, where higher is more comfortable. The US average on the comfort index is 44.[7]
Demographics
| Historical population | |||
|---|---|---|---|
| Census | Pop. | %± | |
| 1810 | 6,641 | — | |
| 1820 | 8,083 | 21.7% | |
| 1830 | 9,065 | 12.1% | |
| 1840 | 12,111 | 33.6% | |
| 1850 | 12,930 | 6.8% | |
| 1860 | 15,579 | 20.5% | |
| 1870 | 12,988 | −16.6% | |
| 1880 | 18,564 | 42.9% | |
| 1890 | 22,181 | 19.5% | |
| 1900 | 27,264 | 22.9% | |
| 1910 | 32,040 | 17.5% | |
| 1920 | 35,676 | 11.3% | |
| 1930 | 36,494 | 2.3% | |
| 1940 | 35,994 | −1.4% | |
| 1950 | 44,279 | 23.0% | |
| 1960 | 60,726 | 37.1% | |
| 1970 | 89,012 | 46.6% | |
| 1980 | 140,353 | 57.7% | |
| 1990 | 167,611 | 19.4% | |
| 2000 | 216,014 | 28.9% | |
| 2010 | 262,391 | 21.5% | |
| Est. 2017 | 290,642 | [8] | 10.8% |
| U.S. Decennial Census[9] 1790-1960[10] 1900-1990[11] 1990-2000[12] 2010-2013[2] | |||
2000 census
As of the census[13] of 2000, there were 216,014 people, 83,240 households, and 59,849 families residing in the county. The population density was 309 people per square mile (119/km²). There were 90,978 housing units at an average density of 130 per square mile (50/km²). The racial makeup of the county was 84.18% White, 12.63% Black or African American, 0.34% Native American, 1.05% Asian, 0.04% Pacific Islander, 0.79% from other races, and 0.98% from two or more races. 1.92% of the population were Hispanic or Latino of any race.
There were 83,240 households out of which 35.50% had children under the age of 18 living with them, 56.60% were married couples living together, 11.60% had a female householder with no husband present, and 28.10% were non-families. 22.50% of all households were made up of individuals and 6.90% had someone living alone who was 65 years of age or older. The average household size was 2.56 and the average family size was 3.01.
In the county, the population was spread out with 26.10% under the age of 18, 8.30% from 18 to 24, 31.60% from 25 to 44, 23.80% from 45 to 64, and 10.20% who were 65 years of age or older. The median age was 36 years. For every 100 females, there were 94.50 males. For every 100 females age 18 and over, there were 91.30 males.
The median income for a household in the county was $44,659, and the median income for a family was $52,637. Males had a median income of $36,435 versus $26,387 for females. The per capita income for the county was $21,063. About 6.40% of families and 9.00% of the population were below the poverty line, including 11.10% of those under age 18 and 9.30% of those age 65 or over.
2010 census
As of the 2010 United States Census, there were 262,391 people, 102,733 households, and 70,952 families residing in the county.[14] The population density was 375.4 inhabitants per square mile (144.9/km2). There were 113,957 housing units at an average density of 163.0 per square mile (62.9/km2).[15] The racial makeup of the county was 79.3% white, 14.3% black or African American, 1.4% Asian, 0.4% American Indian, 2.7% from other races, and 1.9% from two or more races. Those of Hispanic or Latino origin made up 5.5% of the population.[14] In terms of ancestry, 17.2% were German, 14.0% were American, 12.5% were English, and 11.8% were Irish.[16]
Of the 102,733 households, 34.5% had children under the age of 18 living with them, 51.4% were married couples living together, 13.0% had a female householder with no husband present, 30.9% were non-families, and 24.9% of all households were made up of individuals. The average household size was 2.53 and the average family size was 3.01. The median age was 37.9 years.[14]
The median income for a household in the county was $52,205 and the median income for a family was $64,630. Males had a median income of $44,270 versus $34,977 for females. The per capita income for the county was $26,393. About 8.5% of families and 11.1% of the population were below the poverty line, including 15.7% of those under age 18 and 8.4% of those age 65 or over.[17]
Transportation
Public transportation in Lexington County is provided by the Central Midlands Regional Transit Authority.
Referendums and elections
On November 4, 2014, Lexington County residents voted against a proposed sales tax increase. The money generated from this tax would have mostly been used to improve traffic conditions upon roadways.[18] Likewise on November 4, 2014, residents voted to repeal a ban on alcohol sales on Sundays within the county.[19]
Communities
Cities
- Cayce (partly in Richland County)
- Columbia (mostly in Richland County)
- West Columbia
Towns
- Batesburg-Leesville (partly in Saluda County)
- Chapin
- Gaston
- Gilbert
- Irmo (partly in Richland County)
- Lexington (county seat)
- Pelion
- Pine Ridge
- South Congaree
- Springdale
- Summit
- Swansea
Census-designated places
Ghost town
Politics
Lexington is a powerfully Republican county. The last Democrat to carry the county at a Presidential level was Franklin D. Roosevelt in 1944 – at a time when South Carolina had completely disenfranchised its once-majority African-American population and the Republican Party had been comatose for over half a century to the extent of not reaching 7 percent of the vote in a Presidential election since the previous century.[20] Indeed, Adlai Stevenson II in 1952 is the last Democrat to top forty percent in Lexington County, and Jimmy Carter in 1976 the last to top 31 percent, whilst even then it was by almost eight percent Gerald Ford's best county in the state.
| Year | Republican | Democratic | Third parties |
|---|---|---|---|
| 2016 | 65.6% 80,026 | 28.9% 35,230 | 5.6% 6,837 |
| 2012 | 68.1% 76,662 | 30.3% 34,148 | 1.6% 1,813 |
| 2008 | 68.5% 74,960 | 30.4% 33,303 | 1.1% 1,249 |
| 2004 | 71.9% 67,132 | 27.2% 25,393 | 1.0% 907 |
| 2000 | 69.9% 58,095 | 27.5% 22,830 | 2.6% 2,156 |
| 1996 | 63.2% 39,658 | 30.2% 18,907 | 6.6% 4,155 |
| 1992 | 60.5% 41,759 | 26.5% 18,312 | 13.0% 8,951 |
| 1988 | 77.9% 41,467 | 21.4% 11,366 | 0.8% 405 |
| 1984 | 81.0% 38,628 | 18.5% 8,828 | 0.6% 265 |
| 1980 | 67.6% 28,313 | 29.5% 12,334 | 3.0% 1,239 |
| 1976 | 59.4% 21,442 | 39.8% 14,339 | 0.8% 296 |
| 1972 | 84.8% 25,327 | 13.6% 4,069 | 1.6% 490 |
| 1968 | 48.5% 12,204 | 16.1% 4,058 | 35.4% 8,907 |
| 1964 | 71.5% 12,041 | 28.5% 4,807 | |
| 1960 | 61.0% 6,511 | 39.0% 4,159 | |
| 1956 | 20.7% 1,188 | 36.5% 2,094 | 42.8% 2,455 |
| 1952 | 53.4% 4,018 | 46.7% 3,513 | |
| 1948 | 2.0% 58 | 19.8% 566 | 78.2% 2,237 |
| 1944 | 0.9% 20 | 93.7% 1,986 | 5.4% 114 |
| 1940 | 1.1% 17 | 98.9% 1,496 | |
| 1936 | 1.5% 32 | 98.5% 2,138 | |
| 1932 | 3.4% 5 | 95.9% 141 | 0.7% 1 |
| 1928 | 4.7% 61 | 95.3% 1,228 | |
| 1924 | 0.5% 7 | 99.4% 1,395 | 0.1% 2 |
| 1920 | 3.2% 59 | 96.9% 1,813 | |
| 1916 | 1.4% 31 | 95.2% 2,060 | 3.4% 74 |
| 1912 | 0.2% 3 | 94.9% 1,201 | 4.8% 61 |
| 1904 | 2.4% 60 | 97.6% 2,403 | |
| 1900 | 2.3% 30 | 97.8% 1,302 |
In other elections, Lexington County is similarly Republican. It has supported that party for governor in every election since 1982 when Richard Riley carried every county in the state,[22] although as late as 2006 Tommy Moore did manage 44 percent of the vote.[23] The last Democratic senatorial nominee to pass 30 percent of the county's ballots was Inez Tenenbaum in 2004, and no Democratic nominee has won the county for this office since Ernest "Fritz" Hollings did so in 1980: in 1986 it was the only county to support Hollings' GOP opponent Henry McMaster.[24]
See also
- Birch County, South Carolina, a proposed county that would include existing portions of Lexington County
- National Register of Historic Places listings in Lexington County, South Carolina
References
- 1 2 "QuickFacts. Lexington County, South Carolina". Census.gov. Retrieved June 26, 2018.
- 1 2 "State & County QuickFacts". United States Census Bureau. Archived from the original on July 13, 2011. Retrieved March 18, 2015.
- ↑ "Find a County". National Association of Counties. Archived from the original on May 31, 2011. Retrieved 2011-06-07.
- ↑ "South Carolina: Individual County Chronologies". South Carolina Atlas of Historical County Boundaries. The Newberry Library. 2009. Retrieved March 21, 2015.
- ↑ Barefoot, Daniel W. (1999). Touring South Carolina's Revolutionary War Sites. John F. Blair, Publisher. p. 293.
- ↑ "2010 Census Gazetteer Files". United States Census Bureau. August 22, 2012. Retrieved March 18, 2015.
- ↑ Climate in Lexington County, South Carolina. Bestplaces.net. Retrieved on 2013-07-24.
- ↑ "Population and Housing Unit Estimates". Retrieved June 9, 2017.
- ↑ "U.S. Decennial Census". United States Census Bureau. Archived from the original on May 12, 2015. Retrieved March 18, 2015.
- ↑ "Historical Census Browser". University of Virginia Library. Retrieved March 18, 2015.
- ↑ Forstall, Richard L., ed. (March 27, 1995). "Population of Counties by Decennial Census: 1900 to 1990". United States Census Bureau. Retrieved March 18, 2015.
- ↑ "Census 2000 PHC-T-4. Ranking Tables for Counties: 1990 and 2000" (PDF). United States Census Bureau. April 2, 2001. Retrieved March 18, 2015.
- ↑ "American FactFinder". United States Census Bureau. Archived from the original on September 11, 2013. Retrieved 2011-05-14.
- 1 2 3 "DP-1 Profile of General Population and Housing Characteristics: 2010 Demographic Profile Data". United States Census Bureau. Retrieved 2016-03-11.
- ↑ "Population, Housing Units, Area, and Density: 2010 - County". United States Census Bureau. Retrieved 2016-03-11.
- ↑ "DP02 SELECTED SOCIAL CHARACTERISTICS IN THE UNITED STATES – 2006-2010 American Community Survey 5-Year Estimates". United States Census Bureau. Retrieved 2016-03-11.
- ↑ "DP03 SELECTED ECONOMIC CHARACTERISTICS – 2006-2010 American Community Survey 5-Year Estimates". United States Census Bureau. Retrieved 2016-03-11.
- ↑ "Lexington County Voters Reject Penny Tax". Wltx.com. Retrieved 2 January 2018.
- ↑ "Lexington County, Cayce voters repeal Sunday alcohol sales ban". Coladaily.com. 4 November 2014. Retrieved 2 January 2018.
- ↑ Mickey, Robert; Paths out of Dixie: The Democratization of Authoritarian Enclaves in America's Deep South, 1944-1972, p. 440 ISBN 1400838789
- ↑ Leip, David. "Dave Leip's Atlas of U.S. Presidential Elections". Uselectionatlas.org. Retrieved 2 January 2018.
- ↑ Dave Leip's U.S. Election Atlas; 1982 Gubernatorial General Election Results – South Carolina
- ↑ Dave Leip's U.S. Election Atlas; 2006 Gubernatorial General Election Results – South Carolina
- ↑ Dave Leip's U.S. Election Atlas; 1986 Senatorial General Election Results – South Carolina
External links
Places adjacent to Lexington County, South Carolina | ||||||||||
|---|---|---|---|---|---|---|---|---|---|---|
| ||||||||||
Municipalities and communities of Lexington County, South Carolina, United States | ||
|---|---|---|
| Cities | | |
| Towns | ||
| CDPs | ||
| Ghost town | ||
| Footnotes | ‡This populated place also has portions in an adjacent county or counties | |