Bamberg County, South Carolina
| Bamberg County, South Carolina | |
|---|---|
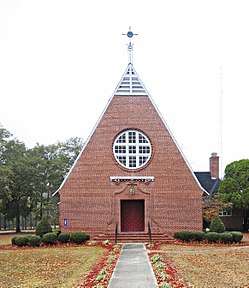 St. Philips Episcopal Church | |
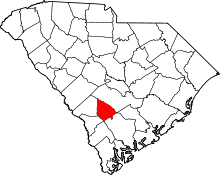 Location in the U.S. state of South Carolina | |
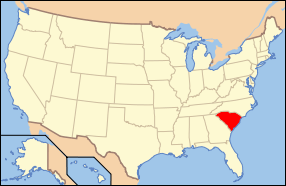 South Carolina's location in the U.S. | |
| Founded | 1897 |
| Named for | Francis Marion Bamberg |
| Seat | Bamberg |
| Largest city | Bamberg |
| Area | |
| • Total | 396 sq mi (1,026 km2) |
| • Land | 393 sq mi (1,018 km2) |
| • Water | 2.2 sq mi (6 km2), 0.6% |
| Population (est.) | |
| • (2015) | 14,880 |
| • Density | 41/sq mi (16/km2) |
| Congressional district | 6th |
| Time zone | Eastern: UTC−5/−4 |
| Website |
www |
Bamberg County is a county located in the U.S. state of South Carolina. As of the 2010 census, the population was 15,987,[1] making it the fourth-least populous county in South Carolina. Its county seat is Bamberg.[2]
History
The county was created from the eastern portion of Barnwell County after the South Carolina Constitution was adopted in 1895 with an article prescribing the process to establish new counties.[3] The election to create Bamberg County was held on January 19, 1897. The name Bamberg was selected to honor General Francis Marion Bamberg.[4] In 1919. and again in 1920, tiny portions of northwestern Colleton County were annexed to Bamberg County. Bamberg county council is the governing body in the county. The council consists of seven members, Trent Kinard-District 1, Sharon Hammond-District 2, Larry Haynes-District 3, Joe Guess,Jr- District 4, Isaiah Odom-District 5, Evert Comer, Jr- District 6, Clint Carter-District 7.
Geography
According to the U.S. Census Bureau, the county has a total area of 396 square miles (1,030 km2), of which 393 square miles (1,020 km2) is land and 2.2 square miles (5.7 km2) (0.6%) is water.[5] It is the fourth-smallest county in South Carolina by land area and third-smallest by total area.
Adjacent counties
- Orangeburg County – north
- Dorchester County – east
- Colleton County – southeast
- Hampton County – south
- Allendale County – southwest
- Barnwell County – west
Major highways
Demographics
| Historical population | |||
|---|---|---|---|
| Census | Pop. | %± | |
| 1900 | 17,296 | — | |
| 1910 | 18,544 | 7.2% | |
| 1920 | 20,962 | 13.0% | |
| 1930 | 19,410 | −7.4% | |
| 1940 | 18,643 | −4.0% | |
| 1950 | 17,533 | −6.0% | |
| 1960 | 16,274 | −7.2% | |
| 1970 | 15,950 | −2.0% | |
| 1980 | 18,118 | 13.6% | |
| 1990 | 16,902 | −6.7% | |
| 2000 | 16,658 | −1.4% | |
| 2010 | 15,987 | −4.0% | |
| Est. 2016 | 14,434 | [6] | −9.7% |
| U.S. Decennial Census[7] 1790–1960[8] 1900–1990[9] 1990–2000[10] 2010–2013[1] | |||
2000 census
As of the census[11] of 2000, there were 16,658 people, 6,123 households, and 4,255 families residing in the county. The population density was 42 people per square mile (16/km²). There were 7,130 housing units at an average density of 18 per square mile (7/km²). The racial makeup of the county was 62.50% Black or African American, 36.47% White, 0.16% Native American, 0.19% Asian, 0.01% Pacific Islander, 0.14% from other races, and 0.53% from two or more races. 0.71% of the population were Hispanic or Latino of any race.
There were 6,123 households out of which 31.10% had children under the age of 18 living with them, 43.60% were married couples living together, 21.30% had a female householder with no husband present, and 30.50% were non-families. 27.80% of all households were made up of individuals and 11.60% had someone living alone who was 65 years of age or older. The average household size was 2.55 and the average family size was 3.10.
In the county, the population was spread out with 25.40% under the age of 18, 12.90% from 18 to 24, 24.60% from 25 to 44, 23.20% from 45 to 64, and 13.90% who were 65 years of age or older. The median age was 35 years. For every 100 females there were 88.70 males. For every 100 females age 18 and over, there were 84.00 males.
The median income for a household in the county was $24,007, and the median income for a family was $29,360. Males had a median income of $25,524 versus $3 for females. The per capita income for the county was $12,584. About 23.90% of families and 27.80% of the population were below the poverty line, including 87.00% of those under age 18 and .80% of those age 65 or over.[12]
2010 census
As of the 2010 United States Census, there were 15,987 people, 6,048 households, and 3,920 families residing in the county.[13] The population density was 40.6 inhabitants per square mile (15.7/km2). There were 7,716 housing units at an average density of 19.6 per square mile (7.6/km2).[14] The racial makeup of the county was 61.5% black or African American, 36.1% white, 0.4% Asian, 0.3% American Indian, 0.7% from other races, and 1.0% from two or more races. Those of Hispanic or Latino origin made up 1.6% of the population.[13] In terms of ancestry, 5.1% were American, and 5.0% were German.[15]
Of the 6,048 households, 31.4% had children under the age of 18 living with them, 38.3% were married couples living together, 21.6% had a female householder with no husband present, 35.2% were non-families, and 31.8% of all households were made up of individuals. The average household size was 2.44 and the average family size was 3.07. The median age was 39.3 years.[13]
The median income for a household in the county was $32,538 and the median income for a family was $41,625. Males had a median income of $33,893 versus $27,324 for females. The per capita income for the county was $16,236. About 23.6% of families and 29.9% of the population were below the poverty line, including 40.7% of those under age 18 and 27.0% of those age 65 or over.[16]
Communities
Cities
Towns
Politics
| Year | Republican | Democratic | Third parties |
|---|---|---|---|
| 2016 | 35.5% 2,204 | 62.7% 3,898 | 1.8% 112 |
| 2012 | 31.9% 2,194 | 67.2% 4,624 | 0.9% 64 |
| 2008 | 33.9% 2,309 | 65.0% 4,426 | 1.2% 79 |
| 2004 | 35.4% 2,138 | 63.6% 3,841 | 0.9% 57 |
| 2000 | 36.9% 2,047 | 62.2% 3,451 | 1.0% 53 |
| 1996 | 32.3% 1,715 | 63.6% 3,380 | 4.1% 217 |
| 1992 | 33.3% 1,906 | 59.8% 3,426 | 6.9% 395 |
| 1988 | 45.7% 2,403 | 53.9% 2,830 | 0.4% 22 |
| 1984 | 49.9% 2,908 | 49.6% 2,892 | 0.5% 31 |
| 1980 | 38.7% 2,098 | 60.8% 3,294 | 0.6% 30 |
| 1976 | 35.5% 1,849 | 63.8% 3,330 | 0.7% 37 |
| 1972 | 59.7% 2,537 | 39.5% 1,680 | 0.9% 36 |
| 1968 | 27.7% 1,327 | 38.5% 1,845 | 33.8% 1,618 |
| 1964 | 62.5% 2,366 | 37.5% 1,419 | |
| 1960 | 64.5% 1,652 | 35.5% 908 | |
| 1956 | 17.4% 326 | 23.0% 430 | 59.7% 1,118 |
| 1952 | 65.2% 1,407 | 34.8% 750 | |
| 1948 | 1.8% 34 | 6.6% 124 | 91.6% 1,715 |
| 1944 | 10.2% 106 | 70.8% 737 | 19.0% 198 |
| 1940 | 1.4% 13 | 98.6% 904 | |
| 1936 | 0.3% 5 | 99.7% 1,542 | |
| 1932 | 0.9% 15 | 99.1% 1,598 | |
| 1928 | 0.5% 4 | 99.5% 779 | |
| 1924 | 1.0% 7 | 97.1% 708 | 1.9% 14 |
| 1920 | 0.0% 0 | 100.0% 688 | |
| 1916 | 0.0% 0 | 99.9% 820 | 0.1% 1 |
| 1912 | 0.5% 3 | 99.4% 616 | 0.2% 1 |
| 1904 | 2.6% 23 | 97.4% 868 | |
| 1900 | 4.3% 36 | 95.7% 793 |
See also
References
- Specific
- 1 2 "State & County QuickFacts". United States Census Bureau. Retrieved November 22, 2013.
- ↑ "Find a County". National Association of Counties. Archived from the original on May 31, 2011. Retrieved 2011-06-07.
- ↑ Article VII Archived 2009-03-31 at the Wayback Machine. – Counties and County Government of the South Carolina Constitution
- ↑ Lawrence 2003: Chapter 6 – 1897–1899 Bamberg County Created.
- ↑ "2010 Census Gazetteer Files". United States Census Bureau. August 22, 2012. Retrieved March 16, 2015.
- ↑ "Population and Housing Unit Estimates". Retrieved June 9, 2017.
- ↑ "U.S. Decennial Census". United States Census Bureau. Archived from the original on May 12, 2015. Retrieved March 16, 2015.
- ↑ "Historical Census Browser". University of Virginia Library. Retrieved March 16, 2015.
- ↑ Forstall, Richard L., ed. (March 27, 1995). "Population of Counties by Decennial Census: 1900 to 1990". United States Census Bureau. Retrieved March 16, 2015.
- ↑ "Census 2000 PHC-T-4. Ranking Tables for Counties: 1990 and 2000" (PDF). United States Census Bureau. April 2, 2001. Retrieved March 16, 2015.
- ↑ "American FactFinder". United States Census Bureau. Archived from the original on September 11, 2013. Retrieved 2011-05-14.
- ↑ US Census Bureau Demographics Data
- 1 2 3 "DP-1 Profile of General Population and Housing Characteristics: 2010 Demographic Profile Data". United States Census Bureau. Retrieved 2016-03-09.
- ↑ "Population, Housing Units, Area, and Density: 2010 – County". United States Census Bureau. Retrieved 2016-03-09.
- ↑ "DP02 SELECTED SOCIAL CHARACTERISTICS IN THE UNITED STATES – 2006–2010 American Community Survey 5-Year Estimates". United States Census Bureau. Retrieved 2016-03-09.
- ↑ "DP03 SELECTED ECONOMIC CHARACTERISTICS – 2006–2010 American Community Survey 5-Year Estimates". United States Census Bureau. Retrieved 2016-03-09.
- ↑ Leip, David. "Dave Leip's Atlas of U.S. Presidential Elections". uselectionatlas.org. Retrieved 2018-03-13.
- General
- Lawrence, Margaret Spann (2003). Betty Jane Barker Miller, ed. History of Bamberg County, South Carolina : commemorating one hundred years (1897–1997. Spartanburg, South Carolina: The Reprint Co. ISBN 0-87152-543-7. Archived from the original on 1 February 2009. Retrieved 2009-01-18.
- Copeland, D. Graham (1940). Many years after : a bit of history and some recollections of Bamberg with appendix of data concerning a few Bamberg County families and their connections. Retrieved 5 October 2014.
External links
![]()
Places adjacent to Bamberg County, South Carolina | ||||||||||
|---|---|---|---|---|---|---|---|---|---|---|
| ||||||||||
Municipalities and communities of Bamberg County, South Carolina, United States | ||
|---|---|---|
| Cities | | |
| Towns | ||
| Unincorporated communities | ||