Beaufort County, South Carolina
| Beaufort County, South Carolina | ||
|---|---|---|
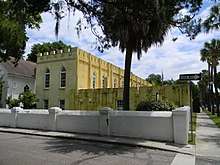 The Arsenal at Beaufort Historic District. | ||
| ||
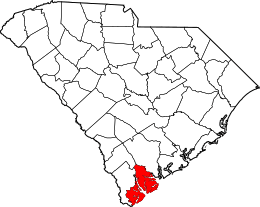 Location in the U.S. state of South Carolina | ||
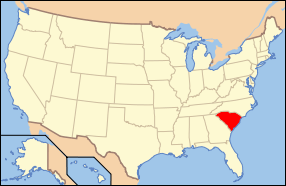 South Carolina's location in the U.S. | ||
| Founded | 1769 | |
| Seat | Beaufort | |
| Largest town | Hilton Head Island | |
| Area | ||
| • Total | 923 sq mi (2,391 km2) | |
| • Land | 576 sq mi (1,492 km2) | |
| • Water | 347 sq mi (899 km2), 38% | |
| Population (est.) | ||
| • (2017) | 186,844 | |
| • Density | 282/sq mi (109/km2) | |
| Congressional districts | 1st, 6th | |
| Time zone | Eastern: UTC−5/−4 | |
| Website |
www | |

Beaufort County (/ˈbjuːfərt/ BEW-fərt) is a county in the U.S. state of South Carolina. As of the 2010 census, its population was 162,233.[1] Its county seat is Beaufort.[2]
Beaufort County is part of the Hilton Head Island-Bluffton-Beaufort, SC Metropolitan Statistical Area.
Beaufort County is one of the South's fastest-growing counties, primarily because of development south of the Broad River clustered along the U.S. Highway 278 corridor.[3] The county's northern portions have also grown steadily, due in part to the strong federal military presence around the city of Beaufort. The county's two portions are connected by the Broad River Bridge, which carries South Carolina Highway 170.
History
From the early days of plantations, African slaves outnumbered the European minority in the colony. The plantations on the Sea Islands had large concentrations of slaves, and frequently limited interaction with whites. The islands were sites of the development of the Gullah culture, which preserved elements from a variety of West African roots; the people also developed the Gullah language, a creole language. The county was majority black nearly to the mid-20th century.
Union troops took control of Beaufort County and occupied the area beginning in 1861. Many slaves escaped and went to Union lines. In some cases, planters had moved inland for refuge, leaving their slaves on the Sea Islands. Slaves began to organize schools and other parts of their communities early in the war in this county, especially on the islands. The Army founded Mitchellville on Hilton Head by March 1863 as a village where blacks could practice self-governance, and in 1865 it had 1500 residents. After the war, the Drayton family reclaimed this land for their use. In some cases the Union Army allocated plots for blacks for housing and cultivating crops.[4]
When freedmen were granted citizenship and the franchise after the American Civil War by constitutional amendments, most joined the Republican Party. Although not the only black majority state, South Carolina was the only southern state during Reconstruction to elect a black majority of representatives to the state legislature.[4] Beaufort County had many prominent black leaders, such as Robert Smalls, Jonathan Jasper Wright, William James Whipper, Julius I. Washington, and Thomas E. Miller.[4]
Increasing violence during election campaigns in the state from 1868 on was used by white insurgents and paramilitary groups to suppress black voting; results were also dependent on fraud. In 1876, the Democrats regained control of the state legislature and governor's office, although results were disputed. While black Republicans continued to be elected to local office in Beaufort County and other areas through the next decades, in 1895 the Democrat-dominated state legislature passed a new constitution that effectively disfranchised most blacks through making voter registration and voting more difficult. They were excluded from the political system and kept in second-class status for decades. In 1903 the county "was reported to have 3,434 literate black males to 927 whites," but due to the discriminatory practices, nearly all blacks were barred from voting.[4]
From 1900 through 1950, Beaufort County's economy suffered from the decline in agriculture, which together with oppressive social conditions of Jim Crow contributed to the blacks making a Great Migration out of the South. African Americans went to northern and midwestern industrial cities for jobs and became an urbanized population. The total county population of 35,495 in 1900 dropped by more than one third to 1930, and did not reach the 1900 population level again until well after 1950, when the population was 26,933. Southern Democrats in Congress helped gain the establishment of military installations in the county and state, which added more population and stimulated area jobs in the second half of the 20th century.
In addition, vacation and resort areas were developed that attracted increasing numbers of tourists through the winter season, and then others all year-round as retirees.
Geography
According to the U.S. Census Bureau, the county has a total area of 923 square miles (2,390 km2), of which 576 square miles (1,490 km2) is land and 347 square miles (900 km2) (38%) is water.[5]
Adjacent counties
- Colleton County - north
- Jasper County - west
- Hampton County - northwest
National protected areas
Demographics
| Historical population | |||
|---|---|---|---|
| Census | Pop. | %± | |
| 1790 | 18,753 | — | |
| 1800 | 20,428 | 8.9% | |
| 1810 | 25,887 | 26.7% | |
| 1820 | 32,199 | 24.4% | |
| 1830 | 37,032 | 15.0% | |
| 1840 | 35,794 | −3.3% | |
| 1850 | 38,805 | 8.4% | |
| 1860 | 40,053 | 3.2% | |
| 1870 | 34,359 | −14.2% | |
| 1880 | 30,176 | −12.2% | |
| 1890 | 34,119 | 13.1% | |
| 1900 | 35,495 | 4.0% | |
| 1910 | 30,355 | −14.5% | |
| 1920 | 22,269 | −26.6% | |
| 1930 | 21,815 | −2.0% | |
| 1940 | 22,037 | 1.0% | |
| 1950 | 26,993 | 22.5% | |
| 1960 | 44,187 | 63.7% | |
| 1970 | 51,136 | 15.7% | |
| 1980 | 65,364 | 27.8% | |
| 1990 | 86,425 | 32.2% | |
| 2000 | 120,937 | 39.9% | |
| 2010 | 162,233 | 34.1% | |
| Est. 2017 | 186,844 | [6] | 15.2% |
| U.S. Decennial Census[7] 1790-1960[8] 1900-1990[9] 1990-2000[10] 2010-2013[1] | |||
2000 census
As of the census[11] of 2000, there were 120,937 people, 45,532 households, and 33,056 families residing in the county. The population density was 206 people per square mile (80/km²). There were 60,509 housing units at an average density of 103 per square mile (40/km²). The racial makeup of the county was 70.66% White, 23.98% Black or African American, 0.27% Native American, 0.79% Asian, 0.05% Pacific Islander, 2.84% from other races, and 1.41% from two or more races. 6.79% of the population were Hispanic or Latino of any race.
There were 45,532 households out of which 30.40% had children under the age of 18 living with them, 58.20% were married couples living together, 11.00% had a female householder with no husband present, and 27.40% were non-families. 21.50% of all households were made up of individuals and 8.30% had someone living alone who was 65 years of age or older. The average household size was 2.51 and the average family size was 2.90.
In the county, the population was spread out with 23.30% under the age of 18, 12.00% from 18 to 24, 27.20% from 25 to 44, 22.10% from 45 to 64, and 15.50% who were 65 years of age or older. The median age was 36 years. For every 100 females, there were 102.40 males. For every 100 females age 18 and over, there were 102.00 males.
The median income for a household in the county was $46,992, and the median income for a family was $52,704. Males had a median income of $30,541 versus $25,284 for females. The per capita income for the county was $25,377. About 8.00% of families and 10.70% of the population were below the poverty line, including 15.40% of those under age 18 and 6.70% of those age 65 or over.
2010 census
As of the 2010 United States Census, there were 162,233 people, 64,945 households, and 45,322 families residing in the county.[12] The population density was 281.5 inhabitants per square mile (108.7/km2). There were 93,023 housing units at an average density of 161.4 per square mile (62.3/km2).[13] The racial makeup of the county was 71.9% white, 19.3% black or African American, 1.2% Asian, 0.3% American Indian, 0.1% Pacific islander, 5.2% from other races, and 2.1% from two or more races. Those of Hispanic or Latino origin made up 12.1% of the population.[12] In terms of ancestry, 15.5% were German, 13.4% were Irish, 13.1% were English, 5.4% were Italian, and 5.0% were American.[14]
Of the 64,945 households, 28.5% had children under the age of 18 living with them, 55.4% were married couples living together, 10.7% had a female householder with no husband present, 30.2% were non-families, and 24.3% of all households were made up of individuals. The average household size was 2.42 and the average family size was 2.84. The median age was 40.6 years.[12]
The median income for a household in the county was $55,286 and the median income for a family was $65,071. Males had a median income of $41,059 versus $33,959 for females. The per capita income for the county was $32,731. About 7.4% of families and 10.5% of the population were below the poverty line, including 16.3% of those under age 18 and 5.8% of those age 65 or over.[15]
Education
Colleges and universities
Community, junior, and technical colleges
High schools
- Battery Creek High School
- Beaufort High School
- Beaufort Jasper Academy for Career Excellence
- Bluffton High School
- Hilton Head Island High School
- Islands Academy
- May River High School
- Whale Branch Early College High School
Communities
Beaufort County is included within the Hilton Head Island-Bluffton-Beaufort, SC Metropolitan Statistical Area. The population was estimated to be 211,614 in 2016.
Cities
- Beaufort (county seat)
Towns
- Bluffton
- Hilton Head Island
- Port Royal
- Yemassee (partly in Hampton County)
Census-designated places
Other unincorporated communities
- Brighton Beach
- Dale
- Frogmore
- Lady's Island
- Lobeco
- Parris Island
- Pocotaligo
- Pritchardville
- Sheldon
- Sun City
- Seabrook
Named islands
Some islands are also towns.
- Barataria Island
- Bull Island
- Callawassie Island
- Cane Island
- Coosaw Island
- Dataw Island
- Daufuskie Island
- Fripp Island
- Grays Hill
- Harbor Island
- Hilton Head Island
- Hunting Island
- Lady's Island
- Lemon Island
- Little Capers Island (uninhabited)
- Morgan Island
- Parris Island
- Poppy Hill
- Port Royal Island
- Pritchard Island (uninhabited research station)
- Saint Helena Island
- Spring Island
- St. Phillips Island
- Warsaw Island
Notable people
- Pat Conroy, author
- Joe Frazier, boxer
- Candice Glover, American Idol Season 12 winner
- Bob Inglis, politician
- Greg Jones, football player
- James Saxon, football player
- Duncan Sheik, musician
- Wayne Simmons, football player
- Robert Smalls, politician
- Stan Smith, tennis player
- Devin Taylor, football player
- D. J. Trahan, golfer
- Kathryn R. Wall, author[16]
Politics
| Year | Republican | Democratic | Third parties |
|---|---|---|---|
| 2016 | 54.7% 42,922 | 40.9% 32,138 | 4.4% 3,464 |
| 2012 | 58.2% 42,687 | 40.7% 29,848 | 1.0% 762 |
| 2008 | 54.9% 37,821 | 44.1% 30,396 | 1.0% 653 |
| 2004 | 60.3% 33,331 | 38.9% 21,505 | 0.7% 399 |
| 2000 | 57.9% 25,561 | 39.6% 17,487 | 2.5% 1,100 |
| 1996 | 53.0% 17,575 | 40.8% 13,532 | 6.2% 2,055 |
| 1992 | 47.1% 14,735 | 36.7% 11,466 | 16.3% 5,086 |
| 1988 | 64.7% 16,184 | 34.7% 8,691 | 0.6% 146 |
| 1984 | 64.7% 13,668 | 34.8% 7,347 | 0.5% 103 |
| 1980 | 51.6% 8,620 | 44.4% 7,415 | 4.0% 665 |
| 1976 | 49.3% 5,935 | 50.3% 6,049 | 0.4% 45 |
| 1972 | 64.1% 5,929 | 35.0% 3,237 | 0.9% 81 |
| 1968 | 36.3% 2,983 | 45.5% 3,740 | 18.2% 1,498 |
| 1964 | 55.5% 3,432 | 44.5% 2,747 | |
| 1960 | 52.9% 2,021 | 47.1% 1,800 | |
| 1956 | 37.9% 1,051 | 25.6% 710 | 36.6% 1,016 |
| 1952 | 59.1% 1,599 | 40.9% 1,106 | |
| 1948 | 11.9% 150 | 20.1% 253 | 67.9% 854 |
| 1944 | 13.6% 108 | 74.5% 594 | 11.9% 95 |
| 1940 | 13.5% 91 | 86.5% 582 | |
| 1936 | 7.9% 43 | 92.1% 501 | |
| 1932 | 10.1% 63 | 88.9% 555 | 1.0% 6 |
| 1928 | 22.9% 124 | 76.5% 414 | 0.6% 3 |
| 1924 | 14.6% 64 | 83.3% 365 | 2.1% 9 |
| 1920 | 36.0% 149 | 64.0% 265 | |
| 1916 | 21.7% 105 | 77.5% 376 | 0.8% 4 |
| 1912 | 8.7% 50 | 80.6% 464 | 10.8% 62 |
| 1904 | 43.5% 319 | 56.5% 415 | |
| 1900 | 50.5% 385 | 49.5% 378 |
See also
Footnotes
- 1 2 "State & County QuickFacts". United States Census Bureau. Retrieved November 22, 2013.
- ↑ "Find a County". National Association of Counties. Archived from the original on 2012-07-12. Retrieved 2011-06-07.
- ↑ "U.S. County Population Estimates, 2015". United States Census Bureau. Archived from the original on 2012-07-12. Retrieved 2015-06-01.
- 1 2 3 4 Giselle White-Perry, "The Reconstruction Legacy of Renty Franklin Greaves of Beaufort County, South Carolina", Prologue Magazine, Fall 2010, Vol. 42, No. 3, accessed 14 November 2014
- ↑ "2010 Census Gazetteer Files". United States Census Bureau. August 22, 2012. Retrieved March 16, 2015.
- ↑ "Population and Housing Unit Estimates". Retrieved August 13, 2018.
- ↑ "U.S. Decennial Census". United States Census Bureau. Archived from the original on May 12, 2015. Retrieved March 16, 2015.
- ↑ "Historical Census Browser". University of Virginia Library. Retrieved March 16, 2015.
- ↑ Forstall, Richard L., ed. (March 27, 1995). "Population of Counties by Decennial Census: 1900 to 1990". United States Census Bureau. Retrieved March 16, 2015.
- ↑ "Census 2000 PHC-T-4. Ranking Tables for Counties: 1990 and 2000" (PDF). United States Census Bureau. April 2, 2001. Retrieved March 16, 2015.
- ↑ "American FactFinder". United States Census Bureau. Archived from the original on 2013-09-11. Retrieved 2011-05-14.
- 1 2 3 "DP-1 Profile of General Population and Housing Characteristics: 2010 Demographic Profile Data". United States Census Bureau. Retrieved 2016-03-09.
- ↑ "Population, Housing Units, Area, and Density: 2010 - County". United States Census Bureau. Retrieved 2016-03-09.
- ↑ "DP02 SELECTED SOCIAL CHARACTERISTICS IN THE UNITED STATES – 2006-2010 American Community Survey 5-Year Estimates". United States Census Bureau. Retrieved 2016-03-09.
- ↑ "DP03 SELECTED ECONOMIC CHARACTERISTICS – 2006-2010 American Community Survey 5-Year Estimates". United States Census Bureau. Retrieved 2016-03-09.
- ↑ "Kathryn Wall". Cincinnati Media. Retrieved Nov 28, 2016.
- ↑ Leip, David. "Dave Leip's Atlas of U.S. Presidential Elections". uselectionatlas.org. Retrieved 2018-03-13.
Further reading
- Lawrence S. Rowland, The History of Beaufort County, South Carolina. Columbia, SC: University of South Carolina Press, 1996.
- Stephen R. Wise and Lawrence S. Rowland, Rebellion, Reconstruction, and Redemption, 1861-1893: The History of Beaufort County, South Carolina, Volume 2. Columbia, SC: University of South Carolina Press, 2015.
External links
- Beaufort County official website
- Beaufort Regional Chamber of Commerce
- The Beaufort Gazette - Daily newspaper circulating primarily "north of the Broad"
- The Island Packet - Daily newspaper circulating primarily "south of the Broad"
- Beaufort County history and images
Coordinates: 32°21′N 80°41′W / 32.35°N 80.69°W
Places adjacent to Beaufort County, South Carolina | ||||||||||
|---|---|---|---|---|---|---|---|---|---|---|
| ||||||||||
Municipalities and communities of Beaufort County, South Carolina, United States | ||
|---|---|---|
| Cities | | |
| Towns | ||
| CDPs | ||
| Unincorporated communities | ||
| Footnotes | ‡This populated place also has portions in an adjacent county or counties | |
The Lowcountry of South Carolina | ||
|---|---|---|
| Counties |  | |
| Major communities | ||
| Sea Islands | ||
| History & culture | ||
| Military installations | ||
| Natural areas | ||
| Other articles | ||