United States presidential election in South Carolina, 1940
|
| ||||||||||||||||||||||||||
| ||||||||||||||||||||||||||
| ||||||||||||||||||||||||||
| ||||||||||||||||||||||||||
The 1940 United States presidential election in South Carolina took place on November 5, 1940. All contemporary 48 states were part of the 1940 United States presidential election. State voters chose eight electors to the Electoral College, which selected the president and vice president.
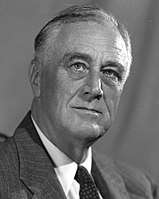
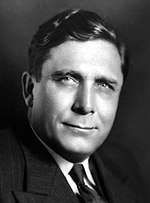
South Carolina was won by incumbent Democratic President Franklin D. Roosevelt of New York, who was running against Republican businessman Wendell Willkie of Indiana. Roosevelt ran with Henry A. Wallace of Iowa as his running mate, and Willkie ran with Senator Charles L. McNary of Oregon.
Roosevelt won South Carolina by a landslide margin of 91.27 percent.
Results
| United States presidential election in South Carolina, 1940[1] | ||||||||
|---|---|---|---|---|---|---|---|---|
| Party | Candidate | Running mate | Popular vote | Electoral vote | ||||
| Count | % | Count | % | |||||
| Democratic | Franklin Delano Roosevelt of New York | Henry Agard Wallace of Iowa | 95,470 | 95.63% | 8 | 100.00% | ||
| Republican | Wendell Willkie of Indiana | Charles Linza McNary of Oregon | 4,360[lower-alpha 1][2] | 4.36% | 0 | 0.00% | ||
| Write-in | Roger Ward Babson of Massachusetts | Edgar Moorman of Illinois | 2 | 0.01% | 0 | 0.00% | ||
| Total | 99,832 | 100.00% | 8 | 100.00% | ||||
Results by county
| County | Roosevelt# | Roosevelt% | Willkie# | Willkie% | Total votes cast[3] |
|---|---|---|---|---|---|
| Abbeville | 1,007 | 96.92% | 32 | 3.08% | 1,039 |
| Aiken | 2,772 | 96.89% | 89 | 3.11% | 2,861 |
| Allendale | 905 | 96.79% | 30 | 3.21% | 935 |
| Anderson | 3,763 | 97.77% | 86 | 2.23% | 3,849 |
| Bamberg | 904 | 98.58% | 13 | 1.42% | 917 |
| Barnwell | 1,845 | 99.30% | 13 | 0.70% | 1,858 |
| Beaufort | 582 | 86.48% | 91 | 13.52% | 673 |
| Berkeley | 490 | 84.34% | 91 | 15.66% | 581 |
| Calhoun | 657 | 99.55% | 3 | 0.45% | 660 |
| Charleston | 8,145 | 85.58% | 1,372 | 14.42% | 9,517 |
| Cherokee | 2,069 | 98.29% | 36 | 1.71% | 2,105 |
| Chester | 1,930 | 98.22% | 35 | 1.78% | 1,965 |
| Chesterfield | 2,880 | 99.31% | 20 | 0.69% | 2,900 |
| Clarendon | 1,154 | 95.53% | 54 | 4.47% | 1,208 |
| Colleton | 1,197 | 94.85% | 65 | 5.15% | 1,262 |
| Darlington | 1,395 | 95.88% | 60 | 4.12% | 1,455 |
| Dillon | 868 | 97.20% | 25 | 2.80% | 893 |
| Dorchester | 993 | 90.03% | 110 | 9.97% | 1,103 |
| Edgefield | 1,065 | 99.16% | 9 | 0.84% | 1,074 |
| Fairfield | 848 | 97.70% | 20 | 2.30% | 868 |
| Florence | 2,597 | 96.47% | 95 | 3.53% | 2,692 |
| Georgetown | 1,503 | 90.65% | 155 | 9.35% | 1,658 |
| Greenville | 8,118 | 94.05% | 514 | 5.95% | 8,632 |
| Greenwood | 2,914 | 98.68% | 39 | 1.32% | 2,953 |
| Hampton | 1,198 | 98.04% | 24 | 1.96% | 1,222 |
| Horry | 2,111 | 92.79% | 164 | 7.21% | 2,275 |
| Jasper | 418 | 91.07% | 41 | 8.93% | 459 |
| Kershaw | 1,174 | 98.32% | 20 | 1.68% | 1,194 |
| Lancaster | 3,205 | 99.57% | 14 | 0.43% | 3,219 |
| Laurens | 2,697 | 98.54% | 40 | 1.46% | 2,737 |
| Lee | 825 | 97.63% | 20 | 2.37% | 845 |
| Lexington | 1,496 | 98.88% | 17 | 1.12% | 1,513 |
| Marion | 716 | 97.55% | 18 | 2.45% | 734 |
| Marlboro | 526 | 97.59% | 13 | 2.41% | 539 |
| McCormick | 419 | 97.44% | 11 | 2.56% | 430 |
| Newberry | 1,739 | 98.03% | 35 | 1.97% | 1,774 |
| Oconee | 1,593 | 91.76% | 143 | 8.24% | 1,736 |
| Orangeburg | 2,356 | 97.68% | 56 | 2.32% | 2,412 |
| Pickens | 2,122 | 96.54% | 76 | 3.46% | 2,198 |
| Richland | 4,781 | 96.62% | 167 | 3.38% | 4,948 |
| Saluda | 1,115 | 98.67% | 15 | 1.33% | 1,130 |
| Spartanburg | 9,119 | 97.35% | 248 | 2.65% | 9,367 |
| Union | 3,662 | 99.21% | 29 | 0.79% | 3,691 |
| Williamsburg | 1,089 | 96.97% | 34 | 3.03% | 1,123 |
| York | 2,508 | 95.51% | 118 | 4.49% | 2,626 |
| Sumter[lower-alpha 2] | 0 | N/A | 0 | N/A | 0 |
| Totals | 95,470 | 95.63% | 4,360 | 4.37% | 99,832[lower-alpha 3] |
Notes
- ↑ Willkie total is a fusion of 2,496 "Jeffersonian Democratic", 1,727 "Republican" and 137 "Tolbert" elector ticket votes
- ↑ No returns were canvassed for Sumter County and voters in this county were listed in neighbouring counties
- ↑ There were two write-in votes for Prohibition Party nominee Roger Ward Babson not tabulated by county.
References
- ↑ "1940 Presidential General Election Results – South Carolina". U.S. Election Atlas. Retrieved 23 December 2013.
- ↑ Scammon, Richard M. (compiler); America at the Polls: A Handbook of Presidential Election Statistics 1920-1964; p. 399 ISBN 0405077114
- ↑ Scammon (compiler); America at the Polls; p. 395
| Candidates | 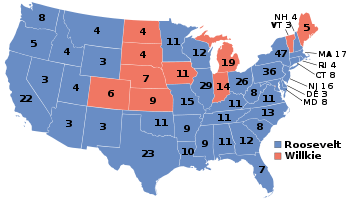 | |
|---|---|---|
| General articles |
| |
| Local results |
| |
| Other 1940 elections | ||
This article is issued from
Wikipedia.
The text is licensed under Creative Commons - Attribution - Sharealike.
Additional terms may apply for the media files.