| Elections in South Carolina |
|---|
 |
|
Presidential elections |
|---|
|
|
|
Presidential primaries |
|---|
|
|
|
United States Senate elections |
|---|
|
|
|
United States House elections |
|---|
|
|
|
Special elections |
|---|
- Senate, 1897
- 7th district, 1901
- 4th district, 1915
- Senate, 1918
- 6th district, 1919
- 7th district, 1919
- Senate, 1941
- 4th district, 1953
- 1st district, 1971
- 2nd district, 2001
- 1st district, 2013
- Senate, 2014
- 5th district, 2017
- Others
|
|
|
|
|
|
|
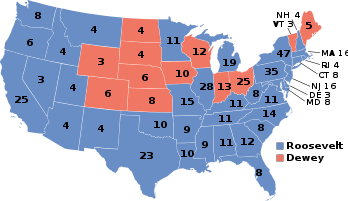
The 1944 United States presidential election in South Carolina took place on November 7, 1944, as part of the 1944 United States presidential election. State voters chose eight electors to the Electoral College, which selected the president and vice president.
South Carolina was won by Democratic candidate, incumbent President Franklin D. Roosevelt won the state over New York governor Thomas E. Dewey by a landslide margin of 83.18 percent. Unpledged Southern Democrats – foreshadowing the Dixiecrat bolt that would begin in the following election to completely transform the state’s politics – received 7.54 percent of the vote as write ins. As of the 2016 presidential election, this constitutes the last election in which Lexington County voted for a Democratic presidential candidate.
Results
Results by county
| County |
Roosevelt# |
Roosevelt% |
Dewey# |
Dewey% |
Others# |
Others% |
Total votes cast[2] |
| Abbeville |
789 |
96.34% |
19 |
2.32% |
11 |
1.34% |
819 |
| Aiken |
2,403 |
91.26% |
60 |
2.28% |
170 |
6.46% |
2,633 |
| Allendale |
678 |
94.43% |
8 |
1.11% |
32 |
4.46% |
718 |
| Anderson |
2,687 |
90.23% |
89 |
2.99% |
202 |
6.78% |
2,978 |
| Bamberg |
737 |
70.80% |
106 |
10.18% |
198 |
19.02% |
1,041 |
| Barnwell |
1,482 |
98.41% |
8 |
0.53% |
16 |
1.06% |
1,506 |
| Beaufort |
594 |
74.53% |
108 |
13.55% |
95 |
11.92% |
797 |
| Berkeley |
521 |
72.77% |
32 |
4.47% |
163 |
22.77% |
716 |
| Calhoun |
602 |
87.76% |
1 |
0.15% |
83 |
12.10% |
686 |
| Charleston |
6,260 |
72.95% |
1,184 |
13.80% |
1,137 |
13.25% |
8,581 |
| Cherokee |
1,620 |
94.13% |
68 |
3.95% |
33 |
1.92% |
1,721 |
| Chester |
1,441 |
88.68% |
89 |
5.48% |
95 |
5.85% |
1,625 |
| Chesterfield |
3,222 |
98.77% |
15 |
0.46% |
25 |
0.77% |
3,262 |
| Clarendon |
1,053 |
81.69% |
27 |
2.09% |
209 |
16.21% |
1,289 |
| Colleton |
1,653 |
82.77% |
45 |
2.25% |
299 |
14.97% |
1,997 |
| Darlington |
1,808 |
91.41% |
46 |
2.33% |
124 |
6.27% |
1,978 |
| Dillon |
864 |
86.06% |
27 |
2.69% |
113 |
11.25% |
1,004 |
| Dorchester |
1,181 |
70.47% |
65 |
3.88% |
430 |
25.66% |
1,676 |
| Edgefield |
654 |
92.24% |
3 |
0.42% |
52 |
7.33% |
709 |
| Fairfield |
798 |
92.47% |
21 |
2.43% |
44 |
5.10% |
863 |
| Florence |
2,822 |
87.86% |
128 |
3.99% |
262 |
8.16% |
3,212 |
| Georgetown |
1,197 |
85.01% |
52 |
3.69% |
159 |
11.29% |
1,408 |
| Greenville |
7,107 |
87.81% |
711 |
8.78% |
276 |
3.41% |
8,094 |
| Greenwood |
2,381 |
88.64% |
71 |
2.64% |
234 |
8.71% |
2,686 |
| Hampton |
575 |
67.65% |
3 |
0.35% |
272 |
32.00% |
850 |
| Horry |
2,403 |
88.09% |
137 |
5.02% |
188 |
6.89% |
2,728 |
| Jasper |
230 |
50.66% |
18 |
3.96% |
206 |
45.37% |
454 |
| Kershaw |
1,872 |
94.98% |
21 |
1.07% |
78 |
3.96% |
1,971 |
| Lancaster |
2,383 |
93.97% |
13 |
0.51% |
140 |
5.52% |
2,536 |
| Laurens |
1,924 |
93.40% |
38 |
1.84% |
98 |
4.76% |
2,060 |
| Lee |
764 |
87.31% |
50 |
5.71% |
61 |
6.97% |
875 |
| Lexington |
1,986 |
93.68% |
20 |
0.94% |
114 |
5.38% |
2,120 |
| Marion |
858 |
92.86% |
9 |
0.97% |
57 |
6.17% |
924 |
| Marlboro |
874 |
89.27% |
34 |
3.47% |
71 |
7.25% |
979 |
| McCormick |
307 |
86.72% |
1 |
0.28% |
46 |
12.99% |
354 |
| Newberry |
1,940 |
82.80% |
70 |
2.99% |
333 |
14.21% |
2,343 |
| Oconee |
1,316 |
87.85% |
106 |
7.08% |
76 |
5.07% |
1,498 |
| Orangeburg |
2,440 |
90.61% |
87 |
3.23% |
166 |
6.16% |
2,693 |
| Pickens |
1,662 |
67.34% |
211 |
8.55% |
595 |
24.11% |
2,468 |
| Richland |
6,590 |
93.12% |
140 |
1.98% |
347 |
4.90% |
7,077 |
| Saluda |
924 |
85.56% |
14 |
1.30% |
142 |
13.15% |
1,080 |
| Spartanburg |
8,092 |
92.61% |
402 |
4.60% |
244 |
2.79% |
8,738 |
| Sumter |
2,111 |
87.92% |
73 |
3.04% |
217 |
9.04% |
2,401 |
| Union |
3,041 |
96.48% |
33 |
1.05% |
78 |
2.47% |
3,152 |
| Williamsburg |
1,118 |
86.60% |
27 |
2.09% |
146 |
11.31% |
1,291 |
| York |
2,637 |
94.48% |
127 |
4.55% |
27 |
0.97% |
2,791 |
| Totals | 90,601 | 87.64% | 4,617 | 4.47% | 8,164 | 7.90% | 103,382 |
References
|
|---|
| Candidates | | |
|---|
General
articles | |
|---|
Local
results | |
|---|
Other 1944
elections | |
|---|
|
|---|
|
- See also
- Presidential elections
- Senate elections
- House elections
- Gubernatorial elections
|
(small).jpg)