| Elections in South Carolina |
|---|
 |
|
Presidential elections |
|---|
|
|
|
Presidential primaries |
|---|
|
|
|
United States Senate elections |
|---|
|
|
|
United States House elections |
|---|
|
|
|
Special elections |
|---|
- Senate, 1897
- 7th district, 1901
- 4th district, 1915
- Senate, 1918
- 6th district, 1919
- 7th district, 1919
- Senate, 1941
- 4th district, 1953
- 1st district, 1971
- 2nd district, 2001
- 1st district, 2013
- Senate, 2014
- 5th district, 2017
- Others
|
|
|
|
|
|
|
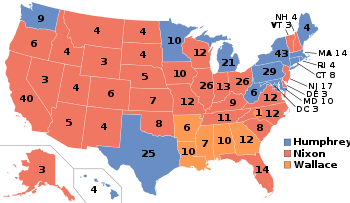
The 1968 United States presidential election in South Carolina took place on November 5, 1968. All 50 states and the District of Columbia were part of the 1968 United States presidential election. South Carolina voters chose eight electors to the Electoral College, who voted for president and vice president.
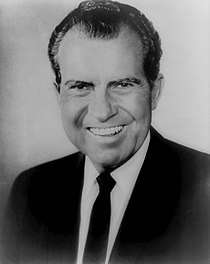
South Carolina voted more or less equally for the candidates, resulting in Republican candidate Richard Nixon of California and his running mate Vice President Spiro Agnew of Maryland receiving a plurality of the votes as opposed to a majority.
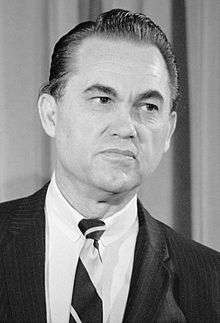
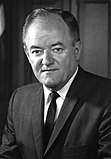
Nixon carried South Carolina with 38.09% of the vote to American Independent Party candidate George Wallace’s 32.30% and Democratic candidate Hubert Humphrey's 29.61%, a victory margin of 5.79%.[1][2]
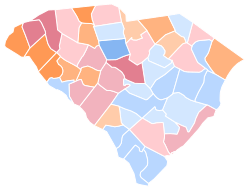
Results
Results by county
| County |
Nixon# |
Nixon% |
Humphrey# |
Humphrey% |
Wallace# |
Wallace% |
Write-ins# |
Write-ins% |
Total votes cast |
| Abbeville |
1,213 |
20.77% |
1,425 |
24.40% |
3,201 |
54.82% |
|
|
5,839 |
| Aiken |
12,264 |
44.76% |
6,319 |
23.06% |
8,815 |
32.17% |
|
|
27,398 |
| Allendale |
997 |
29.72% |
1,538 |
45.84% |
820 |
24.44% |
|
|
3,355 |
| Anderson |
5,661 |
24.33% |
5,218 |
22.43% |
12,384 |
53.23% |
|
|
23,263 |
| Bamberg |
1,327 |
27.70% |
1,845 |
38.52% |
1,618 |
33.78% |
|
|
4,790 |
| Barnwell |
1,849 |
31.25% |
1,716 |
29.01% |
2,351 |
39.74% |
|
|
5,916 |
| Beaufort |
2,983 |
36.29% |
3,740 |
45.49% |
1,498 |
18.22% |
|
|
8,221 |
| Berkeley |
4,021 |
28.89% |
5,089 |
36.56% |
4,808 |
34.55% |
|
|
13,918 |
| Calhoun |
885 |
28.74% |
1,216 |
39.49% |
978 |
31.76% |
|
|
3,079 |
| Charleston |
24,282 |
43.45% |
18,343 |
32.83% |
13,255 |
23.72% |
|
|
55,880 |
| Cherokee |
2,853 |
27.19% |
1,998 |
19.04% |
5,642 |
53.77% |
|
|
10,493 |
| Chester |
2,862 |
33.71% |
2,865 |
33.75% |
2,762 |
32.54% |
|
|
8,489 |
| Chesterfield |
2,564 |
25.47% |
3,180 |
31.59% |
4,324 |
42.95% |
|
|
10,068 |
| Clarendon |
2,201 |
27.85% |
3,606 |
45.62% |
2,097 |
26.53% |
|
|
7,904 |
| Colleton |
2,824 |
34.67% |
2,651 |
32.55% |
2,670 |
32.78% |
|
|
8,145 |
| Darlington |
4,947 |
35.38% |
3,803 |
27.20% |
5,231 |
37.42% |
|
|
13,981 |
| Dillon |
2,396 |
35.73% |
2,178 |
32.48% |
2,132 |
31.79% |
|
|
6,706 |
| Dorchester |
3,354 |
31.21% |
3,855 |
35.87% |
3,539 |
32.93% |
|
|
10,748 |
| Edgefield |
1,688 |
43.07% |
1,225 |
31.26% |
1,006 |
25.67% |
|
|
3,919 |
| Fairfield |
1,619 |
27.14% |
3,011 |
50.47% |
1,336 |
22.39% |
|
|
5,966 |
| Florence |
8,917 |
36.19% |
8,079 |
32.79% |
7,642 |
31.02% |
|
|
24,638 |
| Georgetown |
3,269 |
32.62% |
4,110 |
41.01% |
2,642 |
26.36% |
|
|
10,021 |
| Greenville |
31,652 |
52.91% |
12,928 |
21.61% |
15,241 |
25.48% |
|
|
59,821 |
| Greenwood |
4,891 |
33.37% |
3,741 |
25.52% |
6,024 |
41.10% |
2 |
0.00% |
14,658 |
| Hampton |
1,671 |
31.95% |
2,107 |
40.29% |
1,452 |
27.76% |
|
|
5,230 |
| Horry |
3,924 |
26.97% |
3,924 |
26.97% |
6,701 |
46.06% |
|
|
14,549 |
| Jasper |
633 |
20.31% |
1,402 |
44.99% |
1,081 |
34.69% |
|
|
3,116 |
| Kershaw |
4,079 |
38.56% |
2,539 |
24.00% |
3,960 |
37.44% |
|
|
10,578 |
| Lancaster |
4,874 |
37.75% |
3,151 |
24.41% |
4,886 |
37.84% |
|
|
12,911 |
| Laurens |
4,813 |
39.75% |
3,016 |
24.91% |
4,279 |
35.34% |
|
|
12,108 |
| Lee |
1,219 |
22.23% |
2,151 |
39.23% |
2,113 |
38.54% |
|
|
5,483 |
| Lexington |
12,204 |
48.49% |
4,058 |
16.12% |
8,907 |
35.39% |
|
|
25,169 |
| McCormick |
466 |
21.08% |
988 |
44.69% |
757 |
34.24% |
|
|
2,211 |
| Marion |
2,512 |
36.85% |
2,821 |
41.38% |
1,484 |
21.77% |
|
|
6,817 |
| Marlboro |
2,024 |
31.34% |
2,294 |
35.52% |
2,140 |
33.14% |
|
|
6,458 |
| Newberry |
4,538 |
42.35% |
2,444 |
22.81% |
3,734 |
34.85% |
|
|
10,716 |
| Oconee |
2,618 |
27.94% |
2,009 |
21.44% |
4,742 |
50.61% |
|
|
9,369 |
| Orangeburg |
5,144 |
24.20% |
8,971 |
42.20% |
7,144 |
33.60% |
|
|
21,259 |
| Pickens |
6,873 |
51.63% |
2,016 |
15.14% |
4,424 |
33.23% |
|
|
13,313 |
| Richland |
26,215 |
50.96% |
18,198 |
35.37% |
7,030 |
13.67% |
2 |
0.00% |
51,445 |
| Saluda |
1,466 |
30.53% |
1,200 |
24.99% |
2,136 |
44.48% |
|
|
4,802 |
| Spartanburg |
18,183 |
38.69% |
11,467 |
24.40% |
17,346 |
36.91% |
|
|
46,996 |
| Sumter |
5,451 |
33.43% |
6,103 |
37.42% |
4,754 |
29.15% |
|
|
16,308 |
| Union |
3,011 |
30.50% |
2,271 |
23.00% |
4,590 |
46.50% |
|
|
9,872 |
| Williamsburg |
3,029 |
28.08% |
5,106 |
47.33% |
2,652 |
24.59% |
|
|
10,787 |
| York |
7,596 |
37.48% |
5,571 |
27.49% |
7,102 |
35.04% |
|
|
20,269 |
| Totals | 254,062 | 38.09% | 197,486 | 29.61% | 215,430 | 32.30% | 4 | 0.0006% | 666,982 |
Notes
- ↑ Although he was born in California and he served as a U.S. Senator from California, in 1968 Richard Nixon's official state of residence was New York, because he moved there to practice law after his defeat in the 1962 California gubernatorial election. During his first term as president, Nixon re-established his residency in California. Consequently, most reliable reference books list Nixon's home state as New York in the 1968 election and his home state as California in the 1972 (and 1960) election.
References
|
|---|
| Candidates | | |
|---|
General
articles | |
|---|
Local
results | |
|---|
Other 1968
elections | |
|---|