| Elections in South Carolina |
|---|
 |
|
Presidential elections |
|---|
|
|
|
Presidential primaries |
|---|
|
|
|
United States Senate elections |
|---|
|
|
|
United States House elections |
|---|
|
|
|
Special elections |
|---|
- Senate, 1897
- 7th district, 1901
- 4th district, 1915
- Senate, 1918
- 6th district, 1919
- 7th district, 1919
- Senate, 1941
- 4th district, 1953
- 1st district, 1971
- 2nd district, 2001
- 1st district, 2013
- Senate, 2014
- 5th district, 2017
- Others
|
|
|
|
|
|
|
The 1976 United States presidential election in South Carolina took place on November 2, 1976. All fifty states and the District of Columbia were part of the 1976 United States presidential election. South Carolina voters chose eight electors to the Electoral College, who voted for president and vice president.
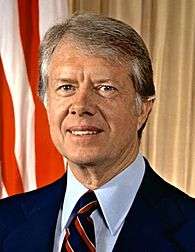
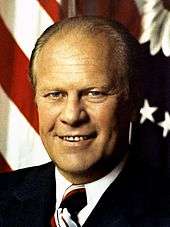
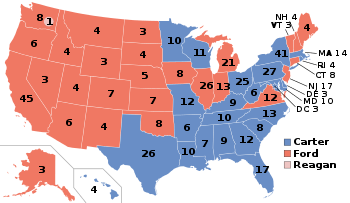
South Carolina voted for the Democratic nominee, former Georgia Governor Jimmy Carter, and his running mate Walter Mondale over the Republican nominee, President Gerald Ford and his running mate Senator Bob Dole. Carter won South Carolina by a margin of 13.04 percent above Ford.[1]
Ford managed to carry just three of South Carolina’s counties, while Nixon managed to carry all forty-six counties four years earlier. As of the 2016 presidential election, this is the last time that the Democratic nominee carried South Carolina, the last time a Democrat won Horry County, Spartanburg County, Berkeley County, Beaufort County, Dorchester County, Florence County, Pickens County, Kershaw County, and Newberry County,[2] and the last time a Democrat swept every congressional district in the state.
Results
Results by county
| County |
Carter# |
Carter% |
Ford# |
Ford% |
Others# |
Others% |
Total votes cast |
| Abbeville |
4,700 |
72.06% |
1,791 |
27.46% |
31 |
0.48% |
6,522 |
| Aiken |
14,927 |
47.88% |
16,011 |
51.36% |
235 |
0.75% |
31,173 |
| Allendale |
2,634 |
71.02% |
1,064 |
28.69% |
11 |
0.30% |
3,709 |
| Anderson |
19,002 |
66.32% |
9,496 |
33.14% |
156 |
0.54% |
28,654 |
| Bamberg |
3,330 |
63.84% |
1,849 |
35.45% |
37 |
0.71% |
5,216 |
| Barnwell |
4,083 |
61.38% |
2,569 |
38.62% |
0 |
0.00% |
6,652 |
| Beaufort |
6,049 |
50.29% |
5,935 |
49.34% |
45 |
0.37% |
12,029 |
| Berkeley |
9,741 |
58.05% |
6,981 |
41.60% |
59 |
0.35% |
16,781 |
| Calhoun |
2,055 |
59.29% |
1,382 |
39.87% |
29 |
0.84% |
3,466 |
| Charleston |
34,328 |
49.64% |
34,010 |
49.18% |
817 |
1.18% |
69,155 |
| Cherokee |
7,765 |
66.19% |
3,931 |
33.51% |
36 |
0.31% |
11,732 |
| Chester |
5,200 |
63.32% |
2,982 |
36.31% |
30 |
0.37% |
8,212 |
| Chesterfield |
7,687 |
75.04% |
2,537 |
24.77% |
20 |
0.20% |
10,244 |
| Clarendon |
5,489 |
64.13% |
3,040 |
35.52% |
30 |
0.35% |
8,559 |
| Colleton |
5,134 |
60.24% |
3,324 |
39.00% |
64 |
0.75% |
8,522 |
| Darlington |
10,165 |
60.16% |
6,678 |
39.52% |
54 |
0.32% |
16,897 |
| Dillon |
5,089 |
66.62% |
2,527 |
33.08% |
23 |
0.30% |
7,639 |
| Dorchester |
8,046 |
54.44% |
6,695 |
45.30% |
38 |
0.26% |
14,779 |
| Edgefield |
3,216 |
62.60% |
1,879 |
36.58% |
42 |
0.82% |
5,137 |
| Fairfield |
4,153 |
69.36% |
1,817 |
30.34% |
18 |
0.30% |
5,988 |
| Florence |
16,294 |
54.49% |
13,539 |
45.27% |
71 |
0.24% |
29,904 |
| Georgetown |
7,169 |
63.54% |
4,058 |
35.97% |
56 |
0.50% |
11,283 |
| Greenville |
35,943 |
47.31% |
39,099 |
51.46% |
939 |
1.24% |
75,981 |
| Greenwood |
9,976 |
62.39% |
5,974 |
37.36% |
41 |
0.26% |
15,991 |
| Hampton |
3,923 |
68.56% |
1,773 |
30.99% |
26 |
0.45% |
5,722 |
| Horry |
15,720 |
62.59% |
9,339 |
37.18% |
58 |
0.23% |
25,117 |
| Jasper |
2,903 |
70.12% |
1,221 |
29.49% |
16 |
0.39% |
4,140 |
| Kershaw |
6,211 |
50.08% |
6,126 |
49.40% |
65 |
0.52% |
12,402 |
| Lancaster |
8,324 |
62.19% |
4,997 |
37.33% |
64 |
0.48% |
13,385 |
| Laurens |
7,440 |
57.98% |
5,300 |
41.31% |
91 |
0.71% |
12,831 |
| Lee |
3,869 |
61.86% |
2,357 |
37.69% |
28 |
0.45% |
6,254 |
| Lexington |
14,339 |
39.75% |
21,442 |
59.43% |
296 |
0.82% |
36,077 |
| McCormick |
1,774 |
73.09% |
640 |
26.37% |
13 |
0.54% |
2,427 |
| Marion |
5,927 |
65.74% |
3,076 |
34.12% |
13 |
0.14% |
9,016 |
| Marlboro |
5,409 |
73.32% |
1,961 |
26.58% |
7 |
0.09% |
7,377 |
| Newberry |
5,034 |
50.26% |
4,931 |
49.23% |
51 |
0.51% |
10,016 |
| Oconee |
8,447 |
68.61% |
3,805 |
30.90% |
60 |
0.49% |
12,312 |
| Orangeburg |
13,652 |
60.40% |
8,794 |
38.90% |
158 |
0.70% |
22,604 |
| Pickens |
8,505 |
51.07% |
8,029 |
48.21% |
121 |
0.73% |
16,655 |
| Richland |
36,855 |
52.68% |
32,727 |
46.78% |
380 |
0.54% |
69,962 |
| Saluda |
2,715 |
56.11% |
2,085 |
43.09% |
39 |
0.81% |
4,839 |
| Spartanburg |
27,925 |
57.32% |
20,456 |
41.99% |
336 |
0.69% |
48,717 |
| Sumter |
10,471 |
52.59% |
9,332 |
46.87% |
109 |
0.55% |
19,912 |
| Union |
6,363 |
64.51% |
3,463 |
35.11% |
37 |
0.38% |
9,863 |
| Williamsburg |
8,745 |
62.22% |
5,275 |
37.53% |
35 |
0.25% |
14,055 |
| York |
14,099 |
58.73% |
9,843 |
41.00% |
63 |
0.26% |
24,005 |
| Totals | 450,825 | 56.22% | 346,140 | 43.16% | 4,948 | 0.62% | 801,913 |
References
|
|---|
| Candidates | | |
|---|
General
articles | |
|---|
Local
results | |
|---|
Other 1976
elections | |
|---|