McLean County, North Dakota
| McLean County, North Dakota | |
|---|---|
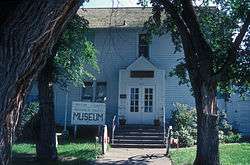 Historic McLean County Courthouse, now Historical Museum. | |
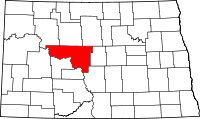 Location in the U.S. state of North Dakota | |
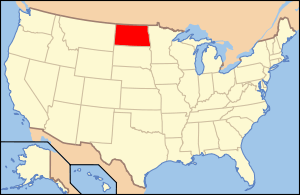 North Dakota's location in the U.S. | |
| Founded | November 1, 1883 |
| Seat | Washburn |
| Largest city | Garrison |
| Area | |
| • Total | 2,328 sq mi (6,029 km2) |
| • Land | 2,111 sq mi (5,467 km2) |
| • Water | 217 sq mi (562 km2), 9.3% |
| Population (est.) | |
| • (2016) | 9,729 |
| • Density | 4.2/sq mi (1.6/km2) |
| Congressional district | At-large |
| Time zone | Central: UTC−6/−5 |
| Website |
www |
McLean County (/məˈkleɪn/ mə-KLAYN) is a county located in the U.S. state of North Dakota. As of the 2010 census, the population was 8,962.[1] Its county seat is Washburn.[2] The county was created by the 1883 territorial legislature and organized on November 1, 1883.[3] It was named for John A. McLean, a prominent citizen and the first mayor of Bismarck, North Dakota.[4]
Geography
According to the U.S. Census Bureau, the county has a total area of 2,328 square miles (6,030 km2), of which 2,111 square miles (5,470 km2) is land and 217 square miles (560 km2) (9.3%) is water.[5] It is the third-largest county in North Dakota by land area and second-largest by total area.
Adjacent counties
- Ward County (north)
- McHenry County (northeast)
- Sheridan County (east)
- Burleigh County (southeast)
- Oliver County (south)
- Mercer County (southwest)
- Dunn County (west)
- Mountrail County (northwest)
Major highways


National protected areas
Demographics
| Historical population | |||
|---|---|---|---|
| Census | Pop. | %± | |
| 1890 | 860 | — | |
| 1900 | 4,791 | 457.1% | |
| 1910 | 14,496 | 202.6% | |
| 1920 | 17,266 | 19.1% | |
| 1930 | 17,991 | 4.2% | |
| 1940 | 16,082 | −10.6% | |
| 1950 | 18,824 | 17.1% | |
| 1960 | 14,030 | −25.5% | |
| 1970 | 11,251 | −19.8% | |
| 1980 | 12,383 | 10.1% | |
| 1990 | 10,457 | −15.6% | |
| 2000 | 9,311 | −11.0% | |
| 2010 | 8,962 | −3.7% | |
| Est. 2016 | 9,729 | [6] | 8.6% |
| U.S. Decennial Census[7] 1790-1960[8] 1900-1990[9] 1990-2000[10] 2010-2016[1] | |||
2000 census
As of the census of 2000, there were 9,311 people, 3,815 households, and 2,712 families residing in the county. The population density was 4 people per square mile (2/km²). There were 5,264 housing units at an average density of 2 per square mile (1/km²). The racial makeup of the county was 92.52% White, 0.02% Black or African American, 5.95% Native American, 0.12% Asian, 0.01% Pacific Islander, 0.19% from other races, and 1.18% from two or more races. 0.87% of the population were Hispanic or Latino of any race. 48.6% were of German and 22.1% Norwegian ancestry.
There were 3,815 households out of which 29.30% had children under the age of 18 living with them, 62.30% were married couples living together, 5.60% had a female householder with no husband present, and 28.90% were non-families. 26.60% of all households were made up of individuals and 14.30% had someone living alone who was 65 years of age or older. The average household size was 2.40 and the average family size was 2.88.
In the county, the population was spread out with 23.80% under the age of 18, 5.10% from 18 to 24, 22.70% from 25 to 44, 27.90% from 45 to 64, and 20.40% who were 65 years of age or older. The median age was 44 years. For every 100 females there were 98.20 males. For every 100 females age 18 and over, there were 97.60 males.
The median income for a household in the county was $32,337, and the median income for a family was $39,604. Males had a median income of $32,376 versus $18,224 for females. The per capita income for the county was $16,220. About 10.40% of families and 13.50% of the population were below the poverty line, including 17.30% of those under age 18 and 12.90% of those age 65 or over.
2010 census
As of the 2010 United States Census, there were 8,962 people, 3,897 households, and 2,600 families residing in the county.[11] The population density was 4.2 inhabitants per square mile (1.6/km2). There were 5,590 housing units at an average density of 2.6 per square mile (1.0/km2).[12] The racial makeup of the county was 91.0% white, 7.0% American Indian, 0.1% black or African American, 0.1% Asian, 0.2% from other races, and 1.5% from two or more races. Those of Hispanic or Latino origin made up 1.2% of the population.[11] In terms of ancestry, 54.4% were German, 24.6% were Norwegian, 6.5% were Irish, 5.6% were Swedish, 5.1% were English, and 3.6% were American.[13]
Of the 3,897 households, 23.0% had children under the age of 18 living with them, 57.8% were married couples living together, 5.1% had a female householder with no husband present, 33.3% were non-families, and 29.0% of all households were made up of individuals. The average household size was 2.25 and the average family size was 2.75. The median age was 49.1 years.[11]
The median income for a household in the county was $52,922 and the median income for a family was $62,686. Males had a median income of $48,906 versus $29,431 for females. The per capita income for the county was $27,029. About 6.5% of families and 9.3% of the population were below the poverty line, including 12.5% of those under age 18 and 13.3% of those age 65 or over.[14]
Communities
Cities
- Benedict
- Butte
- Coleharbor
- Garrison
- Max
- Mercer
- Riverdale
- Ruso
- Turtle Lake
- Underwood
- Washburn (county seat)
- Wilton (partly in Burleigh County)
Townships
- Amundsville
- Andrews
- Aurena
- Blackwater
- Blue Hill
- Butte
- Byersville
- Cremerville
- Deepwater
- Dogden
- Douglas
- Gate
- Greatstone
- Horseshoe Valley
- Lake Williams
- Longfellow
- Loquemont
- Malcolm
- McGinnis
- Medicine Hill
- Mercer
- Otis
- Roseglen
- Rosemont
- Saint Mary
- Snow
- Turtle Lake
- Victoria
- Wise
Census-designated place
Unincorporated communities
- Emmet
- Falkirk
- Raub
- Roseglen
Communities flooded by Garrison Dam
- Elbowoods
- Red Butte, Mandan community
- Lucky Mound
- Nishu
- Beaver Creek
- Independence
- Shell Creek
- Charging Eagle
Politics
| Year | Republican | Democratic | Third parties |
|---|---|---|---|
| 2016 | 72.6% 3,860 | 20.3% 1,081 | 7.0% 374 |
| 2012 | 63.6% 3,141 | 33.8% 1,670 | 2.6% 127 |
| 2008 | 58.4% 2,767 | 39.4% 1,867 | 2.2% 102 |
| 2004 | 63.5% 3,014 | 35.0% 1,664 | 1.5% 72 |
| 2000 | 62.2% 2,891 | 31.5% 1,465 | 6.2% 290 |
| 1996 | 45.4% 1,988 | 40.2% 1,759 | 14.5% 633 |
| 1992 | 40.1% 2,124 | 34.1% 1,808 | 25.9% 1,371 |
| 1988 | 53.9% 2,906 | 45.0% 2,428 | 1.2% 62 |
| 1984 | 62.8% 3,673 | 35.3% 2,062 | 1.9% 112 |
| 1980 | 67.8% 4,234 | 25.8% 1,613 | 6.4% 399 |
| 1976 | 48.2% 2,729 | 49.7% 2,815 | 2.1% 121 |
| 1972 | 66.2% 3,575 | 31.6% 1,703 | 2.2% 120 |
| 1968 | 55.0% 2,764 | 40.8% 2,050 | 4.3% 216 |
| 1964 | 39.7% 2,204 | 60.2% 3,339 | 0.1% 4 |
| 1960 | 55.1% 3,398 | 44.9% 2,771 | 0.1% 4 |
| 1956 | 58.2% 3,653 | 41.5% 2,609 | 0.3% 18 |
| 1952 | 68.6% 5,184 | 30.4% 2,295 | 1.0% 76 |
| 1948 | 50.1% 2,762 | 41.4% 2,283 | 8.5% 468 |
| 1944 | 53.4% 2,822 | 44.0% 2,326 | 2.7% 140 |
| 1940 | 59.0% 4,113 | 38.2% 2,666 | 2.8% 193 |
| 1936 | 25.2% 1,732 | 58.6% 4,018 | 16.2% 1,112 |
| 1932 | 23.9% 1,369 | 76.1% 4,354 | |
| 1928 | 47.5% 2,730 | 49.7% 2,855 | 2.8% 161 |
| 1924 | 36.0% 1,651 | 4.2% 194 | 59.8% 2,738 |
| 1920 | 74.2% 3,724 | 14.9% 748 | 10.9% 545 |
| 1916 | 41.6% 1,054 | 47.8% 1,210 | 10.6% 267 |
| 1912 | 25.6% 505 | 29.6% 583 | 44.8% 882[16] |
| 1908 | 67.8% 2,273 | 27.7% 927 | 4.5% 151 |
| 1904 | 88.4% 1,928 | 10.1% 219 | 1.5% 33 |
| 1900 | 83.7% 587 | 15.7% 110 | 0.6% 4 |
See also
References
- 1 2 "State & County QuickFacts". United States Census Bureau. Archived from the original on July 14, 2011. Retrieved November 1, 2013.
- ↑ "Find a County". National Association of Counties. Archived from the original on May 31, 2011. Retrieved 2011-06-07.
- ↑ "Dakota Territory, South Dakota, and North Dakota: Individual County Chronologies". Dakota Territory Atlas of Historical County Boundaries. The Newberry Library. 2006. Retrieved February 3, 2015.
- ↑ "County History". Official Portal for North Dakota State Government. Retrieved 4 May 2011.
- ↑ "2010 Census Gazetteer Files". United States Census Bureau. August 22, 2012. Archived from the original on January 29, 2015. Retrieved February 1, 2015.
- ↑ "Population and Housing Unit Estimates". Retrieved June 9, 2017.
- ↑ "U.S. Decennial Census". United States Census Bureau. Archived from the original on May 12, 2015. Retrieved February 1, 2015.
- ↑ "Historical Census Browser". University of Virginia Library. Retrieved February 1, 2015.
- ↑ Forstall, Richard L., ed. (April 20, 1995). "Population of Counties by Decennial Census: 1900 to 1990". United States Census Bureau. Retrieved February 1, 2015.
- ↑ "Census 2000 PHC-T-4. Ranking Tables for Counties: 1990 and 2000" (PDF). United States Census Bureau. April 2, 2001. Retrieved February 1, 2015.
- 1 2 3 "DP-1 Profile of General Population and Housing Characteristics: 2010 Demographic Profile Data". United States Census Bureau. Retrieved 2016-03-14.
- ↑ "Population, Housing Units, Area, and Density: 2010 - County". United States Census Bureau. Retrieved 2016-03-14.
- ↑ "DP02 SELECTED SOCIAL CHARACTERISTICS IN THE UNITED STATES – 2006-2010 American Community Survey 5-Year Estimates". United States Census Bureau. Retrieved 2016-03-14.
- ↑ "DP03 SELECTED ECONOMIC CHARACTERISTICS – 2006-2010 American Community Survey 5-Year Estimates". United States Census Bureau. Retrieved 2016-03-14.
- ↑ Leip, David. "Dave Leip's Atlas of U.S. Presidential Elections". uselectionatlas.org. Retrieved 2018-04-12.
- ↑ The leading "other" candidate, Progressive Theodore Roosevelt, received 526 votes, while Socialist candidate Eugene Debs received 325 votes, Prohibition candidate Eugene Chafin received 31 votes.
Further reading
- Mary Ann Barnes Williams, Pioneer Days of Washburn, N. Dakota and Vicinity. Washburn, ND: Washburn Leader, 1936.
- McLean County Heritage. Washburn, ND: McLean County Historical Society, 1978.
Places adjacent to McLean County, North Dakota | ||||||||||
|---|---|---|---|---|---|---|---|---|---|---|
| ||||||||||
Municipalities and communities of McLean County, North Dakota, United States | ||
|---|---|---|
| Cities | | |
| Townships |
| |
| CDP | ||
| Unorganized territories |
| |
| Unincorporated communities | ||
| Indian reservation | ||
| Footnotes | ‡This populated place also has portions in an adjacent county or counties | |