Mountrail County, North Dakota
| Mountrail County, North Dakota | |
|---|---|
 Mountrail County Courthouse in Stanley | |
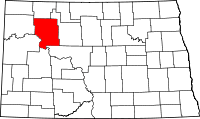 Location in the U.S. state of North Dakota | |
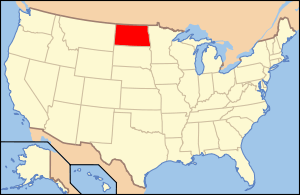 North Dakota's location in the U.S. | |
| Founded |
January 4, 1873 1892 (eliminated) January 29, 1909 (reestablished) |
| Seat | Stanley |
| Largest city | Stanley |
| Area | |
| • Total | 1,942 sq mi (5,030 km2) |
| • Land | 1,825 sq mi (4,727 km2) |
| • Water | 116 sq mi (300 km2), 6.0% |
| Population (est.) | |
| • (2016) | 10,242 |
| • Density | 4.2/sq mi (1.6/km2) |
| Congressional district | At-large |
| Time zone | Central: UTC−6/−5 |
| Website |
www |
Mountrail County is a county located in the northwestern part of North Dakota, United States. As of the 2010 census, the population was 7,673.[1] Its county seat is Stanley.[2] The county was originally created in 1873, then removed in 1892, annexed by Ward County. It was re-created and organized in 1909.[3][4]
Oil production from the Bakken formation in the early 21st century has attracted workers and reversed decades of population decline in the county. From 2010 to 2015, especially, population has markedly increased, creating its own strains.
History
Mountrail County was first established in 1873 (as Mountraille County) by the Dakota Territorial Legislature. The boundaries extended from the Missouri River north to the border with Canada.[4][5] It remained a county when North Dakota became a state in 1889, but in 1892 North Dakota Legislature authorized neighboring Ward County to take over all of Mountrail's territory, and this county was eliminated.[4]
At the November 3, 1908, general election, a vote was held in Ward County on whether to recreate Mountrail with different boundaries.[4][6] The vote was 4,207 to 4,024 in favor of the new county, but North Dakota's Attorney General sued the Secretary of State over the validity of the vote. Organization of the new Mountrail County was delayed until the Supreme Court affirmed the vote in January 1909.[4][7]
Geography
According to the U.S. Census Bureau, the county has a total area of 1,942 square miles (5,030 km2), of which 1,825 square miles (4,730 km2) is land and 116 square miles (300 km2) (6.0%) is water.[8]
Mountrail County is one of several western North Dakota counties with significant exposure to the Bakken Formation in the Williston Basin.
Adjacent counties
- Burke County (north)
- Ward County (east)
- McLean County (southeast)
- Dunn County (south)
- McKenzie County (southwest)
- Williams County (west)
Major highways


National protected areas
Demographics
| Historical population | |||
|---|---|---|---|
| Census | Pop. | %± | |
| 1910 | 8,491 | — | |
| 1920 | 12,140 | 43.0% | |
| 1930 | 13,544 | 11.6% | |
| 1940 | 10,482 | −22.6% | |
| 1950 | 9,418 | −10.2% | |
| 1960 | 10,077 | 7.0% | |
| 1970 | 8,437 | −16.3% | |
| 1980 | 7,679 | −9.0% | |
| 1990 | 7,021 | −8.6% | |
| 2000 | 6,631 | −5.6% | |
| 2010 | 7,673 | 15.7% | |
| Est. 2016 | 10,242 | [9] | 33.5% |
| U.S. Decennial Census[10] 1790-1960[11] 1900-1990[12] 1990-2000[13] 2010-2015[1] | |||
2000 census
As of the census of 2000, there were 6,631 people, 2,560 households, and 1,753 families residing in the county. The population density was 4 people per square mile (1/km²). There were 3,438 housing units at an average density of 2 per square mile (1/km²). The racial makeup of the county was 65.99% White, 0.09% Black or African American, 29.98% Native American, 0.21% Asian, 0.05% Pacific Islander, 0.26% from other races, and 3.42% from two or more races. 1.31% of the population were Hispanic or Latino of any race. 37.1% were of Norwegian and 15.4% German ancestry.
There were 2,560 households out of which 31.80% had children under the age of 18 living with them, 51.80% were married couples living together, 11.80% had a female householder with no husband present, and 31.50% were non-families. 28.50% of all households were made up of individuals and 14.60% had someone living alone who was 65 years of age or older. The average household size was 2.53 and the average family size was 3.09.
In the county, the population was spread out with 28.10% under the age of 18, 6.80% from 18 to 24, 23.20% from 25 to 44, 24.20% from 45 to 64, and 17.70% who were 65 years of age or older. The median age was 40 years. For every 100 females there were 96.80 males. For every 100 females age 18 and over, there were 95.10 males.
The median income for a household in the county was $27,098, and the median income for a family was $31,864. Males had a median income of $24,750 versus $20,844 for females. The per capita income for the county was $13,422. About 14.00% of families and 19.30% of the population were below the poverty line, including 23.40% of those under age 18 and 18.30% of those age 65 or over.
2010 census
As of the 2010 United States Census, there were 7,673 people, 2,793 households, and 1,852 families residing in the county.[14] The population density was 4.2 inhabitants per square mile (1.6/km2). There were 4,119 housing units at an average density of 2.3 per square mile (0.89/km2).[15] The racial makeup of the county was 65.6% white, 30.6% American Indian, 0.2% black or African American, 0.2% Asian, 0.8% from other races, and 2.6% from two or more races. Those of Hispanic or Latino origin made up 3.7% of the population.[14] In terms of ancestry, 36.6% were Norwegian, 24.4% were German, 6.6% were Irish, and 0.8% were American.[16]
Of the 2,793 households, 31.1% had children under the age of 18 living with them, 48.3% were married couples living together, 11.4% had a female householder with no husband present, 33.7% were non-families, and 28.3% of all households were made up of individuals. The average household size was 2.55 and the average family size was 3.11. The median age was 37.0 years.[14]
The median income for a household in the county was $53,912 and the median income for a family was $63,238. Males had a median income of $43,386 versus $29,432 for females. The per capita income for the county was $25,762. About 13.5% of families and 16.5% of the population were below the poverty line, including 24.2% of those under age 18 and 14.2% of those age 65 or over.[17]
Communities
Cities
Townships
- Alger
- Austin
- Banner
- Bicker
- Big Bend
- Brookbank
- Burke
- Clearwater
- Cottonwood
- Crane Creek
- Crowfoot
- Debing
- Egan
- Fertile
- Howie
- Idaho
- James Hill
- Kickapoo
- Knife River
- Liberty
- Lostwood
- Lowland
- Manitou
- McAlmond
- McGahan
- Model
- Mountrail
- Myrtle
- Oakland
- Osborn
- Osloe
- Palermo
- Parshall
- Plaza
- Powers
- Powers Lake
- Purcell
- Rat Lake
- Redmond
- Ross
- Shell
- Sidonia
- Sikes
- Sorkness
- Spring Coulee
- Stave
- Van Hook
- Wayzetta
- White Earth
Unincorporated communities
Politics
Mountrail County is a swing area, unusual for the western part of this state that usually votes in Republican candidates. Bill Clinton won both of his terms, and Barack Obama carried this county in the 2008 election. However, he wasn't able to carry this county in 2012, falling to Republican Mitt Romney by over 16%. Hillary Clinton received the smallest vote by a Democratic candidate (29.7%) since Progressive Party candidate Robert La Follette received an overwhelming vote in 1924.
| Year | Republican | Democratic | Third parties |
|---|---|---|---|
| 2016 | 62.9% 2,582 | 29.7% 1,220 | 7.4% 304 |
| 2012 | 56.8% 1,962 | 40.6% 1,403 | 2.7% 92 |
| 2008 | 47.9% 1,406 | 50.3% 1,477 | 1.9% 55 |
| 2004 | 50.4% 1,527 | 48.4% 1,465 | 1.3% 38 |
| 2000 | 50.6% 1,466 | 43.4% 1,256 | 6.0% 174 |
| 1996 | 36.9% 965 | 48.8% 1,277 | 14.3% 373 |
| 1992 | 30.9% 1,017 | 42.4% 1,393 | 26.7% 879 |
| 1988 | 41.7% 1,443 | 57.2% 1,977 | 1.1% 38 |
| 1984 | 55.1% 1,959 | 44.0% 1,565 | 0.9% 31 |
| 1980 | 60.4% 2,165 | 33.0% 1,183 | 6.7% 239 |
| 1976 | 38.6% 1,430 | 59.0% 2,189 | 2.4% 89 |
| 1972 | 58.3% 2,038 | 39.8% 1,391 | 1.9% 67 |
| 1968 | 44.3% 1,494 | 49.3% 1,662 | 6.4% 214 |
| 1964 | 30.7% 1,131 | 69.2% 2,548 | 0.1% 4 |
| 1960 | 45.5% 1,894 | 54.4% 2,264 | 0.1% 5 |
| 1956 | 47.2% 1,699 | 52.6% 1,891 | 0.2% 7 |
| 1952 | 62.9% 2,516 | 35.9% 1,437 | 1.1% 45 |
| 1948 | 42.2% 1,395 | 46.0% 1,521 | 11.7% 388 |
| 1944 | 45.1% 1,666 | 53.6% 1,981 | 1.3% 46 |
| 1940 | 44.7% 1,981 | 53.9% 2,392 | 1.4% 62 |
| 1936 | 14.7% 700 | 58.2% 2,775 | 27.1% 1,294 |
| 1932 | 22.2% 986 | 73.8% 3,284 | 4.0% 178 |
| 1928 | 52.3% 2,354 | 44.5% 2,003 | 3.2% 144 |
| 1924 | 36.2% 1,354 | 3.5% 130 | 60.3% 2,257 |
| 1920 | 72.7% 2,960 | 16.9% 687 | 10.4% 423 |
| 1916 | 32.6% 740 | 55.7% 1,262 | 11.7% 265 |
| 1912 | 28.1% 407 | 21.2% 307 | 50.8% 737[19] |
See also
References
- 1 2 "State & County QuickFacts". United States Census Bureau. Archived from the original on July 15, 2011. Retrieved November 1, 2013.
- ↑ "Find a County". National Association of Counties. Retrieved 2011-06-07.
- ↑ "County History". North Dakota.gov. The State of North Dakota. Retrieved February 1, 2015.
- 1 2 3 4 5 Long, John H. (2006). "Dakota Territory, South Dakota, and North Dakota: Individual County Chronologies". Dakota Territory Atlas of Historical County Boundaries. The Newberry Library. Archived from the original on 2007-11-11. Retrieved 2008-01-31.
- ↑ "Dakota Territory Historical Counties: Interactive Map". Atlas of Historical County Boundaries. The Newberry Library. Archived from the original on 2006-08-11. Retrieved 2010-07-06.
- ↑ "North Dakota Historical Counties: Interactive Map". Atlas of Historical County Boundaries. The Newberry Library. Archived from the original on 2006-08-11. Retrieved 2010-07-06.
- ↑ STATE ex rel. McCue, Attorney General v. Blaisdell, Secretary of State, et al., 18 N.D. 31 (N.D. 1909).
- ↑ "2010 Census Gazetteer Files". United States Census Bureau. August 22, 2012. Archived from the original on January 29, 2015. Retrieved February 1, 2015.
- ↑ "Population and Housing Unit Estimates". Retrieved June 9, 2017.
- ↑ "U.S. Decennial Census". United States Census Bureau. Retrieved February 1, 2015.
- ↑ "Historical Census Browser". University of Virginia Library. Retrieved February 1, 2015.
- ↑ Forstall, Richard L., ed. (April 20, 1995). "Population of Counties by Decennial Census: 1900 to 1990". United States Census Bureau. Retrieved February 1, 2015.
- ↑ "Census 2000 PHC-T-4. Ranking Tables for Counties: 1990 and 2000" (PDF). United States Census Bureau. April 2, 2001. Retrieved February 1, 2015.
- 1 2 3 "DP-1 Profile of General Population and Housing Characteristics: 2010 Demographic Profile Data". United States Census Bureau. Retrieved 2016-03-14.
- ↑ "Population, Housing Units, Area, and Density: 2010 - County". United States Census Bureau. Retrieved 2016-03-14.
- ↑ "DP02 SELECTED SOCIAL CHARACTERISTICS IN THE UNITED STATES – 2006-2010 American Community Survey 5-Year Estimates". United States Census Bureau. Retrieved 2016-03-14.
- ↑ "DP03 SELECTED ECONOMIC CHARACTERISTICS – 2006-2010 American Community Survey 5-Year Estimates". United States Census Bureau. Retrieved 2016-03-14.
- ↑ Leip, David. "Dave Leip's Atlas of U.S. Presidential Elections". uselectionatlas.org. Retrieved 2018-04-13.
- ↑ The leading "other" candidate, Socialist Eugene Debs received 372 votes, Progressive Theodore Roosevelt, received 347 votes, while Prohibition candidate Eugene Chafin received 18 votes.
Places adjacent to Mountrail County, North Dakota | ||||||||||
|---|---|---|---|---|---|---|---|---|---|---|
| ||||||||||
Municipalities and communities of Mountrail County, North Dakota, United States | ||
|---|---|---|
| Cities | | |
| Townships |
| |
| Unorganized territory |
| |
| Unincorporated communities | ||
| Ghost town | ||
| Indian reservation | ||
| Footnotes | ‡This populated place also has portions in an adjacent county or counties | |