Sheridan County, North Dakota
Coordinates: 47°35′N 100°20′W / 47.58°N 100.34°W
| Sheridan County, North Dakota | |
|---|---|
 | |
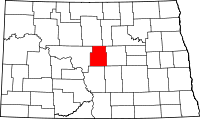 Location in the U.S. state of North Dakota | |
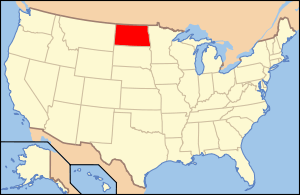 North Dakota's location in the U.S. | |
| Founded | December 24, 1908 |
| Named for | Philip Henry Sheridan |
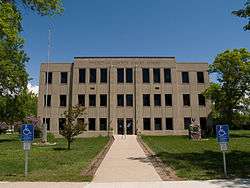
| Seat | McClusky |
| Largest city | McClusky |
| Area | |
| • Total | 1,006 sq mi (2,606 km2) |
| • Land | 972 sq mi (2,517 km2) |
| • Water | 33 sq mi (85 km2), 3.3% |
| Population (est.) | |
| • (2016) | 1,322 |
| • Density | 4/sq mi (1.4/km2) |
| Congressional district | At-large |
| Time zone | Central: UTC−6/−5 |
Sheridan County is a county located in the U.S. state of North Dakota. As of the 2010 census, the population was 1,321,[1] making it the third-least populous county in North Dakota. Its county seat is McClusky.[2] The county was formed by the 1872–1873 territorial legislature but was attached to McLean County for judicial purposes until the 1908 general election, when voters decided to split Sheridan from McLean County entirely.[3] The name comes from Civil War General Philip Henry Sheridan. The county government was first organized on December 24, 1908.[4][5]
Sheridan has been severely affected by the depopulation of the Great Plains, with its population collapsing from 7,373 in 1930 to 1,321 by 2010.[6] Its population decline of 38.4% from 1990 to 2016 was the worst among all North Dakota counties.[7]
Geography
According to the U.S. Census Bureau, the county has a total area of 1,006 square miles (2,610 km2), of which 972 square miles (2,520 km2) is land and 33 square miles (85 km2) (3.3%) is water.[8]
Major highways


Adjacent counties
- McHenry County (north)
- Pierce County (northeast)
- Wells County (east)
- Kidder County (southeast)
- Burleigh County (south)
- McLean County (west)
National protected area
Demographics
| Historical population | |||
|---|---|---|---|
| Census | Pop. | %± | |
| 1910 | 8,103 | — | |
| 1920 | 7,935 | −2.1% | |
| 1930 | 7,373 | −7.1% | |
| 1940 | 6,616 | −10.3% | |
| 1950 | 5,253 | −20.6% | |
| 1960 | 4,350 | −17.2% | |
| 1970 | 3,232 | −25.7% | |
| 1980 | 2,819 | −12.8% | |
| 1990 | 2,148 | −23.8% | |
| 2000 | 1,710 | −20.4% | |
| 2010 | 1,321 | −22.7% | |
| Est. 2016 | 1,322 | [9] | 0.1% |
| U.S. Decennial Census[10] 1790-1960[11] 1900-1990[12] 1990-2000[13] 2010-2016[1] | |||
2000 census
As of the census of 2000, there were 1,710 people, 731 households, and 515 families residing in the county. The population density was 2 people per square mile (1/km²). There were 924 housing units at an average density of 1 per square mile (0/km²). The racial makeup of the county was 99.24% White, 0.12% Black or African American, 0.41% Native American, 0.06% from other races, and 0.18% from two or more races. 0.35% of the population were Hispanic or Latino of any race. 72.3% were of German and 12.5% Norwegian ancestry.
There were 731 households out of which 25.00% had children under the age of 18 living with them, 62.80% were married couples living together, 4.40% had a female householder with no husband present, and 29.50% were non-families. 27.50% of all households were made up of individuals and 16.70% had someone living alone who was 65 years of age or older. The average household size was 2.31 and the average family size was 2.80.
In the county, the population was spread out with 21.40% under the age of 18, 3.80% from 18 to 24, 19.90% from 25 to 44, 28.30% from 45 to 64, and 26.60% who were 65 years of age or older. The median age was 48 years. For every 100 females there were 105.80 males. For every 100 females age 18 and over, there were 104.30 males.
The median income for a household in the county was $24,450, and the median income for a family was $30,156. Males had a median income of $21,094 versus $14,327 for females. The per capita income for the county was $13,283. About 16.00% of families and 21.00% of the population were below the poverty line, including 24.90% of those under age 18 and 18.30% of those age 65 or over.
2010 census
As of the 2010 United States Census, there were 1,321 people, 645 households, and 417 families residing in the county.[14] The population density was 1.4 inhabitants per square mile (0.54/km2). There were 894 housing units at an average density of 0.9 per square mile (0.35/km2).[15] The racial makeup of the county was 96.7% white, 1.1% American Indian, 0.3% black or African American, 0.2% Pacific islander, 0.2% Asian, 0.4% from other races, and 1.2% from two or more races. Those of Hispanic or Latino origin made up 1.2% of the population.[14] In terms of ancestry, 70.1% were German, 14.2% were Norwegian, 6.3% were English, 6.0% were Russian, and 1.8% were American.[16]
Of the 645 households, 17.5% had children under the age of 18 living with them, 54.3% were married couples living together, 5.7% had a female householder with no husband present, 35.3% were non-families, and 33.0% of all households were made up of individuals. The average household size was 2.05 and the average family size was 2.55. The median age was 53.4 years.[14]
The median income for a household in the county was $37,727 and the median income for a family was $43,906. Males had a median income of $30,833 versus $24,583 for females. The per capita income for the county was $24,286. About 15.0% of families and 18.9% of the population were below the poverty line, including 31.1% of those under age 18 and 19.7% of those age 65 or over.[17]
Communities
Cities
Townships
- Berlin
- Boone
- Denhoff
- Edgemont
- Fairview
- Goodrich
- Highland
- Lincoln Dale
- Martin
- Mauch
- McClusky
- Pickard
- Prophets
- Rosenfield
- Strassburg
Defunct townships
Census-designated place
Politics
| Year | Republican | Democratic | Third parties |
|---|---|---|---|
| 2016 | 82.6% 650 | 12.1% 95 | 5.3% 42 |
| 2012 | 78.1% 642 | 19.8% 163 | 2.1% 17 |
| 2008 | 69.1% 555 | 28.5% 229 | 2.4% 19 |
| 2004 | 77.0% 727 | 21.2% 200 | 1.8% 17 |
| 2000 | 76.2% 707 | 17.4% 161 | 6.5% 60 |
| 1996 | 60.2% 566 | 26.8% 252 | 13.1% 123 |
| 1992 | 50.1% 589 | 23.5% 276 | 26.4% 310 |
| 1988 | 67.2% 885 | 32.5% 428 | 0.4% 5 |
| 1984 | 77.0% 1,075 | 21.9% 306 | 1.1% 15 |
| 1980 | 82.5% 1,326 | 12.9% 208 | 4.5% 73 |
| 1976 | 60.9% 935 | 37.0% 569 | 2.1% 32 |
| 1972 | 80.7% 1,460 | 18.5% 334 | 0.8% 15 |
| 1968 | 75.0% 1,295 | 20.3% 350 | 4.7% 82 |
| 1964 | 62.1% 1,187 | 37.9% 724 | |
| 1960 | 74.0% 1,552 | 25.7% 539 | 0.3% 7 |
| 1956 | 77.7% 1,646 | 22.3% 472 | |
| 1952 | 87.3% 2,016 | 11.6% 267 | 1.1% 26 |
| 1948 | 78.9% 1,554 | 18.9% 372 | 2.2% 43 |
| 1944 | 82.8% 1,910 | 16.7% 386 | 0.5% 12 |
| 1940 | 81.3% 2,405 | 18.4% 543 | 0.3% 9 |
| 1936 | 29.8% 834 | 41.1% 1,150 | 29.1% 814 |
| 1932 | 19.1% 468 | 79.3% 1,945 | 1.6% 40 |
| 1928 | 56.6% 1,242 | 43.0% 944 | 0.4% 8 |
| 1924 | 34.7% 594 | 2.9% 49 | 62.5% 1,071 |
| 1920 | 92.1% 1,776 | 7.0% 134 | 0.9% 18 |
| 1916 | 70.1% 807 | 26.9% 310 | 3.0% 35 |
| 1912 | 32.0% 306 | 17.8% 170 | 50.2% 480 |
See also
References
- 1 2 "State & County QuickFacts". United States Census Bureau. Retrieved November 1, 2013.
- ↑ "Find a County". National Association of Counties. Retrieved 2011-06-07.
- ↑ "Sheridan County - Main Page". Archived from the original on 29 September 2011. Retrieved 5 May 2011.
- ↑ "County History". Official Portal for North Dakota State Government. Retrieved 4 May 2011.
- ↑ "Dakota Territory, South Dakota, and North Dakota: Individual County Chronologies". Dakota Territory Atlas of Historical County Boundaries. The Newberry Library. 2006. Retrieved February 4, 2015.
- ↑ Wilkerson, Isabel (3 January 1990). With Rural Towns Vanishing, States Choose Which to Save, The New York Times
- ↑ (11 April 2017). Population Decline; The Hardest Hit Counties In Each State Since 1990, Lost Americana, Retrieved 24 October 2017.
- ↑ "2010 Census Gazetteer Files". United States Census Bureau. August 22, 2012. Archived from the original on January 29, 2015. Retrieved February 1, 2015.
- ↑ "Population and Housing Unit Estimates". Retrieved June 9, 2017.
- ↑ "U.S. Decennial Census". United States Census Bureau. Retrieved February 1, 2015.
- ↑ "Historical Census Browser". University of Virginia Library. Retrieved February 1, 2015.
- ↑ Forstall, Richard L., ed. (April 20, 1995). "Population of Counties by Decennial Census: 1900 to 1990". United States Census Bureau. Retrieved February 1, 2015.
- ↑ "Census 2000 PHC-T-4. Ranking Tables for Counties: 1990 and 2000" (PDF). United States Census Bureau. April 2, 2001. Retrieved February 1, 2015.
- 1 2 3 "DP-1 Profile of General Population and Housing Characteristics: 2010 Demographic Profile Data". United States Census Bureau. Retrieved 2016-04-03.
- ↑ "Population, Housing Units, Area, and Density: 2010 - County". United States Census Bureau. Retrieved 2016-04-03.
- ↑ "DP02 SELECTED SOCIAL CHARACTERISTICS IN THE UNITED STATES – 2006-2010 American Community Survey 5-Year Estimates". United States Census Bureau. Retrieved 2016-04-03.
- ↑ "DP03 SELECTED ECONOMIC CHARACTERISTICS – 2006-2010 American Community Survey 5-Year Estimates". United States Census Bureau. Retrieved 2016-04-03.
- 1 2 US Census boundary changes - North Dakota
- ↑ Leip, David. "Dave Leip's Atlas of U.S. Presidential Elections". uselectionatlas.org. Retrieved 2018-04-13.
External links
Places adjacent to Sheridan County, North Dakota | ||||||||||
|---|---|---|---|---|---|---|---|---|---|---|
| ||||||||||
Municipalities and communities of Sheridan County, North Dakota, United States | ||
|---|---|---|
| Cities | | |
| Townships |
| |
| CDP | ||
| Unorganized territories |
| |
| Unincorporated community |
| |