Burleigh County, North Dakota
| Burleigh County, North Dakota | |
|---|---|
 | |
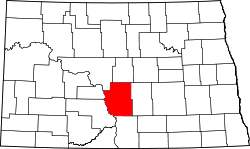 Location in the U.S. state of North Dakota | |
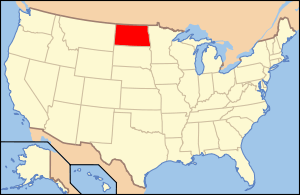 North Dakota's location in the U.S. | |
| Founded | July 16, 1873 |
| Named for | Walter A. Burleigh |
| Seat | Bismarck |
| Largest city | Bismarck |
| Area | |
| • Total | 1,668 sq mi (4,320 km2) |
| • Land | 1,633 sq mi (4,229 km2) |
| • Water | 36 sq mi (93 km2), 2.1% |
| Population (est.) | |
| • (2017) | 95,030[1] |
| • Density | 58/sq mi (22/km2) |
| Congressional district | At-large |
| Time zone | Central: UTC−6/−5 |
| Website |
www |
Burleigh County is a county located in the U.S. state of North Dakota. As of the 2010 census, the population was 81,308,[2] making it the second-most populous county in North Dakota. Its county seat is Bismarck,[3] the state capital. The county was created on January 4, 1873 and later organized on July 16.[4][5]
Burleigh County is included in the Bismarck, ND Metropolitan Statistical Area, commonly called "Bismarck–Mandan".
Geography
According to the U.S. Census Bureau, the county has a total area of 1,668 square miles (4,320 km2), of which 1,633 square miles (4,230 km2) is land and 36 square miles (93 km2) (2.1%) is water.[6]
Major highways


Adjacent counties
- Sheridan County (north)
- Kidder County (east)
- Emmons County (south)
- Morton County (southwest)
- Oliver County (west)
- McLean County (northwest)
National protected areas
Demographics
| Historical population | |||
|---|---|---|---|
| Census | Pop. | %± | |
| 1880 | 3,246 | — | |
| 1890 | 4,247 | 30.8% | |
| 1900 | 6,081 | 43.2% | |
| 1910 | 13,087 | 115.2% | |
| 1920 | 15,578 | 19.0% | |
| 1930 | 19,769 | 26.9% | |
| 1940 | 22,736 | 15.0% | |
| 1950 | 25,673 | 12.9% | |
| 1960 | 34,016 | 32.5% | |
| 1970 | 40,714 | 19.7% | |
| 1980 | 54,811 | 34.6% | |
| 1990 | 60,131 | 9.7% | |
| 2000 | 69,416 | 15.4% | |
| 2010 | 81,308 | 17.1% | |
| Est. 2017 | 95,030 | [7] | 16.9% |
| U.S. Decennial Census[8] 1790-1960[9] 1900-1990[10] 1990-2000[11] 2010-2016[2] | |||
As of the 2010 United States Census, there were 81,308 people, 33,976 households, and 21,213 families residing in the county.[12] The population density was 49.8 inhabitants per square mile (19.2/km2). There were 35,754 housing units at an average density of 21.9 per square mile (8.5/km2).[13] The racial makeup of the county was 93.0% white, 4.2% American Indian, 0.6% black or African American, 0.5% Asian, 0.3% from other races, and 1.4% from two or more races. Those of Hispanic or Latino origin made up 1.2% of the population.[12] In terms of ancestry, 61.0% were German, 21.1% were Norwegian, 8.1% were Russian, 6.8% were Irish, and 2.6% were American.[14]
Of the 33,976 households, 29.0% had children under the age of 18 living with them, 50.2% were married couples living together, 8.7% had a female householder with no husband present, 37.6% were non-families, and 30.5% of all households were made up of individuals. The average household size was 2.31 and the average family size was 2.90. The median age was 37.3 years.[12]
The median income for a household in the county was $53,465 and the median income for a family was $71,103. Males had a median income of $44,944 versus $31,943 for females. The per capita income for the county was $28,784. About 6.3% of families and 9.4% of the population were below the poverty line, including 11.6% of those under age 18 and 11.0% of those age 65 or over.[15]
Population by decade

Communities
Cities
Townships
- Apple Creek
- Boyd
- Burn Creek
- Canfield
- Christiania
- Clear Lake
- Crofte
- Cromwell
- Driscoll
- Ecklund
- Estherville
- Florence Lake
- Francis
- Ghylin
- Gibbs
- Glenview
- Grass Lake
- Harriet-Lien
- Hay Creek
- Hazel Grove
- Logan
- Long Lake
- McKenzie
- Menoken
- Missouri
- Morton
- Naughton
- Painted Woods
- Richmond
- Rock Hill
- Schrunk
- Sibley Butte
- Steiber
- Sterling
- Taft
- Telfer
- Thelma
- Trygg
- Wild Rose
- Wilson
- Wing
Census-designated places
Unincorporated communities
Politics
| Year | Republican | Democratic | Third parties |
|---|---|---|---|
| 2016 | 67.8% 32,532 | 22.7% 10,881 | 9.5% 4,566 |
| 2012 | 64.4% 27,951 | 32.6% 14,122 | 3.0% 1,314 |
| 2008 | 60.6% 25,443 | 37.1% 15,600 | 2.3% 956 |
| 2004 | 68.5% 26,577 | 29.9% 11,621 | 1.6% 616 |
| 2000 | 65.2% 22,467 | 28.5% 9,842 | 6.3% 2,173 |
| 1996 | 51.7% 15,464 | 35.7% 10,679 | 12.5% 3,747 |
| 1992 | 50.9% 16,484 | 27.6% 8,940 | 21.5% 6,960 |
| 1988 | 61.9% 18,000 | 37.0% 10,760 | 1.1% 324 |
| 1984 | 68.3% 19,913 | 30.1% 8,781 | 1.7% 482 |
| 1980 | 67.9% 18,437 | 22.6% 6,129 | 9.5% 2,571 |
| 1976 | 58.1% 13,680 | 39.0% 9,188 | 2.9% 681 |
| 1972 | 67.4% 13,909 | 28.3% 5,841 | 4.3% 894 |
| 1968 | 64.0% 10,661 | 30.9% 5,139 | 5.1% 849 |
| 1964 | 47.0% 7,239 | 52.7% 8,120 | 0.4% 60 |
| 1960 | 62.1% 9,492 | 37.7% 5,761 | 0.2% 25 |
| 1956 | 73.8% 9,199 | 25.9% 3,231 | 0.3% 37 |
| 1952 | 79.6% 9,526 | 20.0% 2,400 | 0.4% 49 |
| 1948 | 59.5% 5,049 | 36.7% 3,117 | 3.9% 327 |
| 1944 | 60.0% 4,616 | 39.8% 3,061 | 0.3% 23 |
| 1940 | 57.1% 5,858 | 42.4% 4,350 | 0.6% 58 |
| 1936 | 25.2% 2,447 | 64.9% 6,314 | 9.9% 962 |
| 1932 | 31.8% 2,687 | 66.6% 5,621 | 1.6% 131 |
| 1928 | 55.6% 3,955 | 43.2% 3,076 | 1.2% 84 |
| 1924 | 53.2% 3,152 | 6.4% 379 | 40.4% 2,397 |
| 1920 | 77.3% 4,300 | 17.0% 943 | 5.8% 321 |
| 1916 | 45.5% 1,182 | 48.7% 1,267 | 5.8% 151 |
| 1912 | 36.2% 720 | 30.6% 609 | 33.2% 660 |
| 1908 | 65.8% 1,375 | 31.6% 660 | 2.6% 54 |
| 1904 | 83.2% 1,340 | 14.7% 237 | 2.1% 33 |
| 1900 | 66.4% 679 | 33.2% 339 | 0.4% 4 |
See also
References
- ↑ "QuickFacts. Burleigh County, North Dakota". Census.gov. Retrieved June 28, 2018.
- 1 2 "State & County QuickFacts". United States Census Bureau. Retrieved October 31, 2013.
- ↑ "Find a County". National Association of Counties. Archived from the original on 2011-05-31. Retrieved 2011-06-07.
- ↑ "Dakota Territory, South Dakota, and North Dakota: Individual County Chronologies". Dakota Territory Atlas of Historical County Boundaries. The Newberry Library. 2006. Retrieved February 2, 2015.
- ↑ "County History". North Dakota.gov. The State of North Dakota. Retrieved February 2, 2015.
- ↑ "2010 Census Gazetteer Files". United States Census Bureau. August 22, 2012. Archived from the original on January 29, 2015. Retrieved January 27, 2015.
- ↑ "Population and Housing Unit Estimates". Retrieved June 9, 2017.
- ↑ "U.S. Decennial Census". United States Census Bureau. Archived from the original on May 12, 2015. Retrieved April 10, 2016.
- ↑ "Historical Census Browser". University of Virginia Library. Retrieved January 27, 2015.
- ↑ Forstall, Richard L., ed. (March 27, 1995). "Population of Counties by Decennial Census: 1900 to 1990". United States Census Bureau. Retrieved January 27, 2015.
- ↑ "Census 2000 PHC-T-4. Ranking Tables for Counties: 1990 and 2000" (PDF). United States Census Bureau. April 2, 2001. Retrieved January 27, 2015.
- 1 2 3 "DP-1 Profile of General Population and Housing Characteristics: 2010 Demographic Profile Data". United States Census Bureau. Retrieved 2016-03-14.
- ↑ "Population, Housing Units, Area, and Density: 2010 - County". United States Census Bureau. Retrieved 2016-03-14.
- ↑ "DP02 SELECTED SOCIAL CHARACTERISTICS IN THE UNITED STATES – 2006-2010 American Community Survey 5-Year Estimates". United States Census Bureau. Retrieved 2016-03-14.
- ↑ "DP03 SELECTED ECONOMIC CHARACTERISTICS – 2006-2010 American Community Survey 5-Year Estimates". United States Census Bureau. Retrieved 2016-03-14.
- ↑ Leip, David. "Dave Leip's Atlas of U.S. Presidential Elections". uselectionatlas.org. Retrieved 2018-04-12.
External links
- A brief history of Burleigh County : with a chronology of some of the county's earlier days (1932) from the Digital Horizons website
- A brief history of Burleigh County : with a chronology of some of the outstanding events of the county's earlier days (1932) from the Digital Horizons website
Coordinates: 46°59′N 100°28′W / 46.98°N 100.47°W
Places adjacent to Burleigh County, North Dakota | ||||||||||
|---|---|---|---|---|---|---|---|---|---|---|
| ||||||||||
Municipalities and communities of Burleigh County, North Dakota, United States | ||
|---|---|---|
| Cities | | |
| Townships |
| |
| CDPs | ||
| Unorganized territories |
| |
| Unincorporated communities | ||
| Ghost town | ||
| Footnotes | ‡This populated place also has portions in an adjacent county or counties | |
| Counties |  | |
|---|---|---|
| Core cities | ||
| Surrounding areas |
| |